You are not logged in.
This means you
CAN ONLY VIEW reports that were published prior to Monday, April 14, 2025.
You
MUST UPGRADE YOUR MEMBERSHIP if you want to see any current reports.
AFTER MARKET UPDATE - MONDAY, MARCH 21ST, 2011
Previous After Market Report Next After Market Report >>>
|
|
|
|
DOW |
+178.01 |
12,036.53 |
+1.50% |
|
Volume |
1,002,227,410 |
-47% |
|
Volume |
1,708,366,050 |
-32% |
|
NASDAQ |
+48.42 |
2,692.09 |
+1.83% |
|
Advancers |
2,467 |
79% |
|
Advancers |
2,060 |
75% |
|
S&P 500 |
+19.18 |
1,298.38 |
+1.50% |
|
Decliners |
561 |
18% |
|
Decliners |
584 |
21% |
|
Russell 2000 |
+18.36 |
813.02 |
+2.31% |
|
52 Wk Highs |
123 |
|
|
52 Wk Highs |
92 |
|
|
S&P 600 |
+9.17 |
431.23 |
+2.17% |
|
52 Wk Lows |
8 |
|
|
52 Wk Lows |
30 |
|
|
 |
Dow Jones Industrials Rallied Back Above 50-Day Average
Kenneth J. Gruneisen - Passed the CAN SLIM® Master's Exam
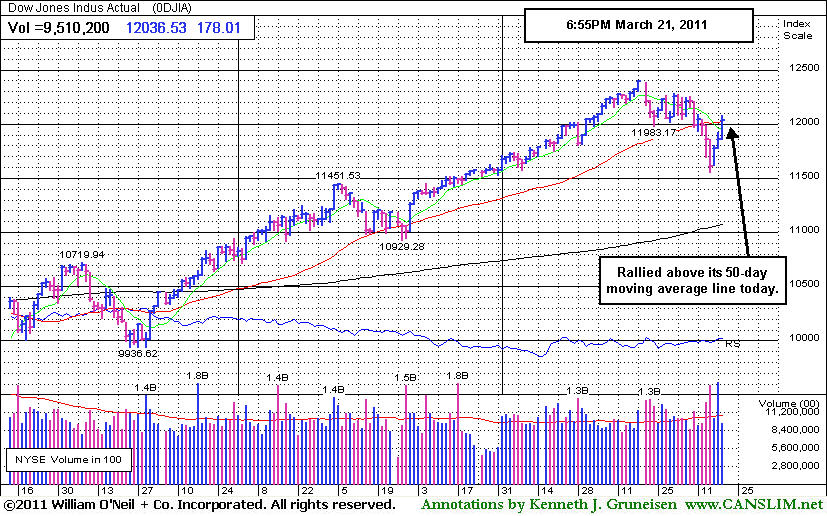
Volume totals were reported much lighter on the NYSE and on the Nasdaq exchange versus the prior session's totals, which suggested that on Monday's session there was not really serious accumulation of stocks taking place by institutional investors. Of course, Friday's session had marked the quarterly options expirations day known as "quadruple witching" which regularly inflates volume totals on the exchanges. On Monday advancing issues beat decliners by nearly 5-1 on the NYSE and by 7-2 on the Nasdaq exchange. New 52-week highs outnumbered new 52-week lows on the Nasdaq exchange and on the NYSE, and new lows on the NYSE slumped into the single digits again. There were 44 high-ranked companies from the CANSLIM.net Leaders List that made new 52-week highs and appeared on the CANSLIM.net BreakOuts Page, up from a total of 25 on the prior session. On the Featured Stocks Page there were gains from 17 of the 18 high-ranked market leaders currently listed.
The advance was triggered by corporate deal-making and easing concerns about the nuclear crisis in Japan. The markets ignored weak sales of previously owned homes as the major averages pushed their winning streaks to a 3rd day with a broad rally. Sales of previously owned homes fell more than forecast in February, and the median purchase price dropped to the lowest since April 2002. Energy shares followed oil prices higher as air strikes continued in Libya. Meanwhile, insurance shares gained as a Nuclear Regulatory Commission official said the Japan crisis is stabilizing.
AT&T (T +1.15%) rose after announcing a $39 billion purchase of T-Mobile USA, meanwhile, Sprint Nextel (S -13.6%) shares fell after being outbid in its attempt to buy the company. Tiffany & Co (TIF +5.11%) reported earnings that beat expectations. CBS Corp (CBS +5.5%) rallied after sources cited strong demand for advertising for the NCAA basketball tournament carried by the network. Ratings are up 11%.
More damaging distributional action has the potential to lead to a much more substantial correction for the major averages (bad M criteria). During a correction investors should raise their cash levels and reduce stock market exposure. New buying efforts should be avoided until a new rally with a follow-through day (FTD) provides a fresh confirmation that buying demand from the institutional crowd is returning again. Even after a FTD, marked by an expansion in volume and stocks hitting new highs with higher volume, buying efforts should only be cautiously and carefully made when all of the investment system's key criteria are met.
PICTURED: The Dow Jones Industrial Average rose above the much talked about 12,000 level and completed its best three-day point move since September. What was technically most significant, however, was that its rally helped it close back above its 50-day moving average (DMA) line.
|
 Kenneth J. Gruneisen started out as a licensed stockbroker in August 1987, a couple of months prior to the historic stock market crash that took the Dow Jones Industrial Average down -22.6% in a single day. He has published daily fact-based fundamental and technical analysis on high-ranked stocks online for two decades. Through FACTBASEDINVESTING.COM, Kenneth provides educational articles, news, market commentary, and other information regarding proven investment systems that work in good times and bad.
Comments contained in the body of this report are technical opinions only and are not necessarily those of Gruneisen Growth Corp. The material herein has been obtained from sources believed to be reliable and accurate, however, its accuracy and completeness cannot be guaranteed. Our firm, employees, and customers may effect transactions, including transactions contrary to any recommendation herein, or have positions in the securities mentioned herein or options with respect thereto. Any recommendation contained in this report may not be suitable for all investors and it is not to be deemed an offer or solicitation on our part with respect to the purchase or sale of any securities. |
|
 |
Commodity-Linked Groups and Tech Sector Led Gainers
Kenneth J. Gruneisen - Passed the CAN SLIM® Master's Exam
Commodity linked groups were standout gainers as the Gold & Silver Index ($XAU +2.10%), Integrated Oil Index ($XOI +2.68%), and Oil Services Index ($OSX +3.92%) surged higher. The tech sector had a positive bias as the Biotechnology Index ($BTK +0.41%), Internet Index ($IIX +1.66%), Semiconductor Index ($SOX +1.81%), and Networking Index ($NWX +2.04%) posted unanimous gains. The Retail Index ($RLX +1.24%) and the Healthcare Index ($HMO +1.33%) also helped the major averages' positive bias. As for the influential financial indexes, the Broker/Dealer Index ($XBD +1.60%) posted a solid gain, meanwhile the Bank Index ($BKX -0.17%) struggled on Monday.
Charts courtesy www.stockcharts.com
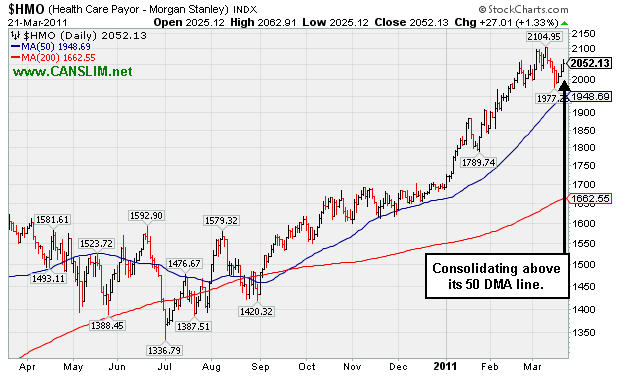
PICTURED: The Healthcare Index ($HMO +1.33%) is consolidating above its 50-day moving average line, up better than +20% year-to-date.
| Oil Services |
$OSX |
288.87 |
+10.90 |
+3.92% |
+17.85% |
| Healthcare |
$HMO |
2,052.13 |
+27.00 |
+1.33% |
+21.28% |
| Integrated Oil |
$XOI |
1,345.67 |
+35.13 |
+2.68% |
+10.92% |
| Semiconductor |
$SOX |
426.79 |
+7.59 |
+1.81% |
+3.64% |
| Networking |
$NWX |
318.05 |
+6.35 |
+2.04% |
+13.36% |
| Internet |
$IIX |
307.15 |
+5.02 |
+1.66% |
-0.19% |
| Broker/Dealer |
$XBD |
120.56 |
+1.90 |
+1.60% |
-0.79% |
| Retail |
$RLX |
501.25 |
+6.15 |
+1.24% |
-1.40% |
| Gold & Silver |
$XAU |
208.60 |
+4.30 |
+2.10% |
-7.94% |
| Bank |
$BKX |
52.00 |
-0.09 |
-0.17% |
-0.40% |
| Biotech |
$BTK |
1,285.00 |
+5.23 |
+0.41% |
-0.97% |
|
|
|
 |
Positive Reversal For Small Gain Today Right at 50-Day Average
Kenneth J. Gruneisen - Passed the CAN SLIM® Master's Exam
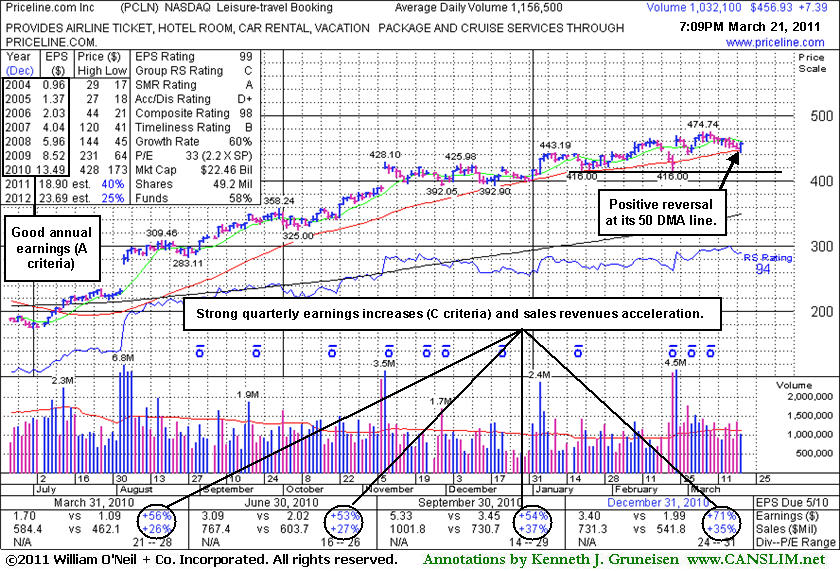
For now it deserves the bullish benefit of the doubt, however, disciplined investors avoid chasing extended stocks and might wait in the meanwhile for a sound new base of sufficient length to be noted. The M criteria is a critical factor to consider, as 3 out of 4 stocks will tend to go in the direction of the major averages. This stock has maintained a strong and steady annual earnings (A criteria) history. Fundamentally, its earnings increases have been impressive in the 8 most recent quarterly comparisons, solidly above the +25% guideline (C criteria), and recent comparisons showed earnings and sales acceleration. Return On Equity is reported at 44%, well above the 17% minimum guideline. Its relatively small supply of only 49.2 million shares (S criteria) can lead to great price volatility in the event of institutional accumulation or distribution. With respect to the investment system's I criteria, the number of top-rated funds owning its shares increased from 1,351 in Sep '10 to 1,473 in Dec '10.
Priceline.com Inc. (PCLN +$7.39 or +1.64% to $456.93) overcame early weakness after dipping below its 50-day moving average (DMA) line today, positively reversing near that important short-term average. It is perched only -3.8% off its 52-week high, but it has not built a sound new base pattern. Since its last appearance in this FSU section with an annotated graph on 2/14/11 under the headline, "Gains Helped Stock Gradually Get Extended", it endured heavy distributional pressure on February 23rd but halted its slide right at an earlier chart low $116.00 previously noted as a support level to watch below its 50 DMA line. It found prompt support near its short-term average and then blasted to a new high with heavy volume behind its subsequent gain on strong earnings news. However, this high-ranked Norwalk, CT-based firm in the strong-performing Leisure - Travel Booking industry did not make a lot of significant progress above prior highs, and it has been enduring mild distributional pressure in recent weeks.
|
|
|
Color Codes Explained :
Y - Better candidates highlighted by our
staff of experts.
G - Previously featured
in past reports as yellow but may no longer be buyable under the
guidelines.
***Last / Change / Volume data in this table is the closing quote data***
Symbol/Exchange
Company Name
Industry Group |
PRICE |
CHANGE
(%Change) |
Day High |
Volume
(% DAV)
(% 50 day avg vol) |
52 Wk Hi
% From Hi |
Featured
Date |
Price
Featured |
Pivot Featured |
|
Max Buy |
BIDU
-
NASDAQ
Baidu Inc Ads
INTERNET - Internet Information Providers
|
$124.00
|
+3.50
2.90% |
$124.88
|
5,752,698
85.33% of 50 DAV
50 DAV is 6,742,000
|
$131.63
-5.80%
|
3/17/2011
|
$121.97
|
PP = $131.73
|
|
MB = $138.32
|
 Most Recent Note - 3/21/2011 1:36:40 PM
Y - Small gap up today. Color code was changed to yellow with new pivot point cited based on its 52-week high plus 10 cents after consolidating for the past 5 weeks above support at its 50 DMA line. Volume-driven gains above its pivot point and a new rally with follow-through day from at least one of the major averages (M criteria) are necessary first in order to justify new (or add-on) buying efforts under the system's guidelines. Its recent chart low ($112.95 on 2/23/11) is the next important chart support to watch below its short-term average.
>>> The latest Featured Stock Update with an annotated graph appeared on 3/9/2011. Click here.
View all notes |
Alert me of new notes |
CANSLIM.net Company Profile |
SEC |
Zacks Reports |
StockTalk |
News |
Chart |
Request a new note
C
A N
S L
I M


|
CMG
-
NYSE
Chipotle Mexican Grill
LEISURE - Restaurants
|
$247.50
|
+0.69
0.28% |
$250.78
|
668,069
62.02% of 50 DAV
50 DAV is 1,077,200
|
$275.00
-10.00%
|
2/11/2011
|
$271.15
|
PP = $262.87
|
|
MB = $276.01
|
Most Recent Note - 3/17/2011 3:49:40 PM
G - Perched -8% of its all-time high today. Reassuring signs of support have been noted while consolidating above its 50 DMA line and prior highs in the $237 area. Subsequent violations and damaging losses would raise greater concerns and trigger technical sell signals. See the latest FSU analysis for more details and a new annotated graph.
>>> The latest Featured Stock Update with an annotated graph appeared on 3/14/2011. Click here.
View all notes |
Alert me of new notes |
CANSLIM.net Company Profile |
SEC |
Zacks Reports |
StockTalk |
News |
Chart |
Request a new note
C
A N
S L
I M
|
CTSH
-
NASDAQ
Cognizant Tech Sol Cl A
COMPUTER SOFTWARE and SERVICES - Business Software and Services
|
$75.61
|
+1.42
1.91% |
$75.81
|
1,819,377
76.64% of 50 DAV
50 DAV is 2,373,900
|
$78.69
-3.91%
|
2/7/2011
|
$75.09
|
PP = $76.46
|
|
MB = $80.28
|
Most Recent Note - 3/17/2011 3:42:07 PM
G - Halted its slide today after 3 consecutive losses violated its 50 DMA line and its previously noted chart low ($73.25 on 2/23/11). Color code was changed to green after the damaging technical violations. See the latest FSU analysis for more details and a new annotated graph.
>>> The latest Featured Stock Update with an annotated graph appeared on 3/17/2011. Click here.
View all notes |
Alert me of new notes |
CANSLIM.net Company Profile |
SEC |
Zacks Reports |
StockTalk |
News |
Chart |
Request a new note
C
A N
S L
I M
|
DECK
-
NASDAQ
Deckers Outdoor Corp
CONSUMER NON-DURABLES - Textile - Apparel Footwear
|
$81.07
|
+2.28
2.89% |
$81.42
|
1,356,258
87.47% of 50 DAV
50 DAV is 1,550,600
|
$94.70
-14.39%
|
2/3/2011
|
$79.61
|
PP = $82.67
|
|
MB = $86.80
|
Most Recent Note - 3/21/2011 1:39:09 PM
G - Up today, yet still lingering below its 50 DMA line. A rebound above that important short-term average would technically help its outlook improve.
>>> The latest Featured Stock Update with an annotated graph appeared on 3/3/2011. Click here.
View all notes |
Alert me of new notes |
CANSLIM.net Company Profile |
SEC |
Zacks Reports |
StockTalk |
News |
Chart |
Request a new note
C
A N
S L
I M
|
EBIX
-
NASDAQ
Ebix Inc
COMPUTER SOFTWARE and SERVICES - Business Software and Services
|
$29.45
|
+1.39
4.95% |
$29.82
|
747,921
121.89% of 50 DAV
50 DAV is 613,600
|
$29.61
-0.54%
|
2/28/2011
|
$25.70
|
PP = $25.97
|
|
MB = $27.27
|
Most Recent Note - 3/21/2011 10:02:42 AM
G - Gapped up today, rising within close striking distance of its all-time high. Prior highs in the $25-26 area define important chart support to watch along with its 50 DMA line.
>>> The latest Featured Stock Update with an annotated graph appeared on 2/28/2011. Click here.
View all notes |
Alert me of new notes |
CANSLIM.net Company Profile |
SEC |
Zacks Reports |
StockTalk |
News |
Chart |
Request a new note
C
A N
S L
I M
|
Symbol/Exchange
Company Name
Industry Group |
PRICE |
CHANGE
(%Change) |
Day High |
Volume
(% DAV)
(% 50 day avg vol) |
52 Wk Hi
% From Hi |
Featured
Date |
Price
Featured |
Pivot Featured |
|
Max Buy |
EZPW
-
NASDAQ
Ezcorp Inc Cl A
SPECIALTY RETAIL - Specialty Retail, Other
|
$29.08
|
+1.50
5.44% |
$29.10
|
368,197
100.00% of 50 DAV
50 DAV is 368,200
|
$29.94
-2.87%
|
2/18/2011
|
$27.94
|
PP = $30.04
|
|
MB = $31.54
|
Most Recent Note - 3/21/2011 10:06:27 AM
Y - Gapped up today, rising above its 50 DMA line, a technical improvement that helps its outlook. Color code is changed to yellow while its pivot point last cited remains the same. The recent low ($25.56 on 1/25/11) defines the next important support level.
>>> The latest Featured Stock Update with an annotated graph appeared on 3/10/2011. Click here.
View all notes |
Alert me of new notes |
CANSLIM.net Company Profile |
SEC |
Zacks Reports |
StockTalk |
News |
Chart |
Request a new note
C
A N
S L
I M
|
FOSL
-
NASDAQ
Fossil Inc
CONSUMER DURABLES - Recreational Goods, Other
|
$81.80
|
+2.28
2.87% |
$81.99
|
917,057
94.05% of 50 DAV
50 DAV is 975,100
|
$85.20
-3.99%
|
2/1/2011
|
$73.30
|
PP = $74.44
|
|
MB = $78.16
|
Most Recent Note - 3/21/2011 2:47:32 PM
G - Up today with lighter volume. It has not formed a sound base. It found support at its 50 DMA line while consolidating above prior resistance in the $74 area.
>>> The latest Featured Stock Update with an annotated graph appeared on 2/24/2011. Click here.
View all notes |
Alert me of new notes |
CANSLIM.net Company Profile |
SEC |
Zacks Reports |
StockTalk |
News |
Chart |
Request a new note
C
A N
S L
I M
|
HMSY
-
NASDAQ
H M S Holdings Corp
COMPUTER SOFTWARE and SERVICES - Healthcare Information Service
|
$81.14
|
+3.23
4.15% |
$81.14
|
152,051
88.25% of 50 DAV
50 DAV is 172,300
|
$81.36
-0.27%
|
11/19/2010
|
$61.89
|
PP = $63.01
|
|
MB = $66.16
|
Most Recent Note - 3/21/2011 10:12:14 AM
G - Rallying within close striking distance of its 52-week high today after a brief consolidation, not a sound new base. Support to watch is its 50 DMA line.
>>> The latest Featured Stock Update with an annotated graph appeared on 2/16/2011. Click here.
View all notes |
Alert me of new notes |
CANSLIM.net Company Profile |
SEC |
Zacks Reports |
StockTalk |
News |
Chart |
Request a new note
C
A N
S L
I M
|
LULU
-
NASDAQ
Lululemon Athletica
MANUFACTURING - Textile Manufacturing
|
$76.88
|
+1.32
1.75% |
$77.34
|
2,095,261
98.88% of 50 DAV
50 DAV is 2,118,900
|
$85.28
-9.85%
|
1/26/2011
|
$68.11
|
PP = $74.70
|
|
MB = $78.44
|
Most Recent Note - 3/17/2011 11:20:45 AM
G - Down today with heavy volume after reporting earnings per share +60% on +53% revenues for the quarter ended January 31, 2011 versus the year ago period. Volume and volatility often increase near earnings news. It is again testing its 50 DMA line, a classic chart support level. As previously noted - "A close below a significant prior high close ($73.51 on 12/21/10) would completely negate its latest breakout, raising more serious concerns."
>>> The latest Featured Stock Update with an annotated graph appeared on 2/25/2011. Click here.
View all notes |
Alert me of new notes |
CANSLIM.net Company Profile |
SEC |
Zacks Reports |
StockTalk |
News |
Chart |
Request a new note
C
A N
S L
I M
|
MG
-
NYSE
Mistras Group Inc
DIVERSIFIED SERVICES - Bulding and Faci;ity Management Services
|
$16.98
|
+0.50
3.03% |
$17.00
|
121,646
122.01% of 50 DAV
50 DAV is 99,700
|
$16.60
2.29%
|
3/15/2011
|
$15.48
|
PP = $15.90
|
|
MB = $16.70
|
Most Recent Note - 3/21/2011 9:44:33 AM
G - Gapped up today, rallying beyond its "max buy" level. Color code is changed to green. Prior highs near its pivot point define chart support to watch following last week's technical breakout. The M criteria argues against new buying efforts until a confirmed rally with follow-through day occurs.
>>> The latest Featured Stock Update with an annotated graph appeared on 3/15/2011. Click here.
View all notes |
Alert me of new notes |
CANSLIM.net Company Profile |
SEC |
Zacks Reports |
StockTalk |
News |
Chart |
Request a new note
C
A N
S L
I M
|
Symbol/Exchange
Company Name
Industry Group |
PRICE |
CHANGE
(%Change) |
Day High |
Volume
(% DAV)
(% 50 day avg vol) |
52 Wk Hi
% From Hi |
Featured
Date |
Price
Featured |
Pivot Featured |
|
Max Buy |
MWIV
-
NASDAQ
M W I Veterinary Supply
HEALTH SERVICES - Medical Instruments and; Supplies
|
$76.16
|
-0.04
-0.05% |
$77.12
|
57,453
63.62% of 50 DAV
50 DAV is 90,300
|
$78.48
-2.96%
|
11/4/2010
|
$61.79
|
PP = $59.60
|
|
MB = $62.58
|
Most Recent Note - 3/18/2011 4:43:33 PM
G - Today's gain leaves its -2.8% off its all-time high. It is extended from any sound base pattern.
>>> The latest Featured Stock Update with an annotated graph appeared on 3/8/2011. Click here.
View all notes |
Alert me of new notes |
CANSLIM.net Company Profile |
SEC |
Zacks Reports |
StockTalk |
News |
Chart |
Request a new note
C
A N
S L
I M
|
OPEN
-
NASDAQ
Opentable Inc
INTERNET - Internet Software and Services
|
$92.15
|
+2.13
2.37% |
$92.86
|
870,928
77.65% of 50 DAV
50 DAV is 1,121,600
|
$95.97
-3.98%
|
3/17/2011
|
$90.71
|
PP = $96.07
|
|
MB = $100.87
|
Most Recent Note - 3/21/2011 1:45:55 PM
Y - Inching higher today without great volume conviction. Color code was changed to yellow after it formed a sound new flat base pattern of sufficient length. Volume-driven gains above the new pivot point cited and a confirmed rally with follow-through day may eventually justify new (or add-on) buying efforts under the investment system guidelines. Important support to watch in the meanwhile is at its 50 DMA line and prior chart highs.
>>> The latest Featured Stock Update with an annotated graph appeared on 2/15/2011. Click here.
View all notes |
Alert me of new notes |
CANSLIM.net Company Profile |
SEC |
Zacks Reports |
StockTalk |
News |
Chart |
Request a new note
C
A N
S L
I M
|
PAY
-
NYSE
Verifone Systems Inc
COMPUTER HARDWARE - Transaction Automation Systems
|
$53.16
|
+2.36
4.65% |
$53.17
|
1,401,496
73.34% of 50 DAV
50 DAV is 1,910,900
|
$53.85
-1.28%
|
1/27/2011
|
$41.77
|
PP = $44.97
|
|
MB = $47.22
|
Most Recent Note - 3/21/2011 1:33:15 PM
G - Gap up gain today has it poised for a possible new high close. Repeatedly noted - "No resistance remains due to overhead supply, but it is extended from a sound base pattern. Its 50 DMA line defines chart support to watch."
>>> The latest Featured Stock Update with an annotated graph appeared on 3/2/2011. Click here.
View all notes |
Alert me of new notes |
CANSLIM.net Company Profile |
SEC |
Zacks Reports |
StockTalk |
News |
Chart |
Request a new note
C
A N
S L
I M
|
PCLN
-
NASDAQ
Priceline.Com Inc
INTERNET - Internet Software and Services
|
$456.93
|
+7.39
1.64% |
$458.47
|
1,032,926
89.31% of 50 DAV
50 DAV is 1,156,500
|
$474.74
-3.75%
|
1/3/2011
|
$399.55
|
PP = $428.20
|
|
MB = $449.61
|
Most Recent Note - 3/21/2011 1:44:48 PM
G - Overcame early weakness after dipping below its 50 DMA line today, positively reversing near that important short-term average. Perched only -4.1% off its 52-week high, but it has not built a sound base pattern.
>>> The latest Featured Stock Update with an annotated graph appeared on 3/21/2011. Click here.
View all notes |
Alert me of new notes |
CANSLIM.net Company Profile |
SEC |
Zacks Reports |
StockTalk |
News |
Chart |
Request a new note
C
A N
S L
I M
|
RAX
-
NYSE
Rackspace Hosting Inc
INTERNET - Internet Software and; Services
|
$37.91
|
+1.31
3.58% |
$37.94
|
1,257,708
67.41% of 50 DAV
50 DAV is 1,865,700
|
$40.62
-6.67%
|
3/16/2011
|
$36.28
|
PP = $40.72
|
|
MB = $42.76
|
Most Recent Note - 3/21/2011 1:35:29 PM
Y - Small gap up today after recently testing prior highs near $35 and its 50 DMA line defining chart support to watch. Color code was changed to yellow with new pivot point cited after a new 5-week flat base pattern was identified. However, the negative market environment (M criteria) is an overriding concern for now arguing against new buying efforts until a rally with follow-through day occurs.
>>> The latest Featured Stock Update with an annotated graph appeared on 3/16/2011. Click here.
View all notes |
Alert me of new notes |
CANSLIM.net Company Profile |
SEC |
Zacks Reports |
StockTalk |
News |
Chart |
Request a new note
C
A N
S L
I M
|
Symbol/Exchange
Company Name
Industry Group |
PRICE |
CHANGE
(%Change) |
Day High |
Volume
(% DAV)
(% 50 day avg vol) |
52 Wk Hi
% From Hi |
Featured
Date |
Price
Featured |
Pivot Featured |
|
Max Buy |
TIBX
-
NASDAQ
Tibco Software Inc
COMPUTER SOFTWARE and SERVICES - Business Software and Services
|
$24.58
|
+0.70
2.93% |
$24.61
|
1,309,063
51.81% of 50 DAV
50 DAV is 2,526,800
|
$25.94
-5.24%
|
3/18/2011
|
$23.88
|
PP = $26.04
|
|
MB = $27.34
|
Most Recent Note - 3/21/2011 1:41:13 PM
Y - Small gap up today. Color code was changed to yellow with new pivot point cited based on its 52-week high plus ten cents. Currently consolidating above support at its 50 DMA line and recent chart lows defining support above its old resistance area. More damaging losses would raise concerns and trigger more worrisome technical sell signals.
>>> The latest Featured Stock Update with an annotated graph appeared on 3/18/2011. Click here.
View all notes |
Alert me of new notes |
CANSLIM.net Company Profile |
SEC |
Zacks Reports |
StockTalk |
News |
Chart |
Request a new note
C
A N
S L
I M
|
UA
-
NYSE
Under Armour Inc Cl A
CONSUMER NON-DURABLES - Textile - Apparel Clothing
|
$65.51
|
+2.20
3.47% |
$65.83
|
638,885
80.48% of 50 DAV
50 DAV is 793,800
|
$70.69
-7.33%
|
1/27/2011
|
$58.31
|
PP = $56.99
|
|
MB = $59.84
|
Most Recent Note - 3/21/2011 1:41:53 PM
G -Small gap up today after slumping last week near its 50 DMA line and recent lows defining important chart support. It may be forming a base-on-base pattern, but more damaging losses would hurt its outlook.
>>> The latest Featured Stock Update with an annotated graph appeared on 3/7/2011. Click here.
View all notes |
Alert me of new notes |
CANSLIM.net Company Profile |
SEC |
Zacks Reports |
StockTalk |
News |
Chart |
Request a new note
C
A N
S L
I M
|
ULTA
-
NASDAQ
Ulta Salon Cosm & Frag
SPECIALTY RETAIL - Specialty Retail, Other
|
$47.25
|
+0.48
1.03% |
$47.93
|
578,109
90.08% of 50 DAV
50 DAV is 641,800
|
$47.93
-1.42%
|
1/6/2011
|
$36.12
|
PP = $37.34
|
|
MB = $39.21
|
Most Recent Note - 3/18/2011 4:45:15 PM
G - Perched at its all-time high, holding its ground after a spurt of volume-driven gains. Support to watch is at its 50 DMA line and recent chart lows near the $40 level.
>>> The latest Featured Stock Update with an annotated graph appeared on 2/17/2011. Click here.
View all notes |
Alert me of new notes |
CANSLIM.net Company Profile |
SEC |
Zacks Reports |
StockTalk |
News |
Chart |
Request a new note
C
A N
S L
I M
|
|
|
|
THESE ARE NOT BUY RECOMMENDATIONS!
Comments contained in the body of this report are technical
opinions only. The material herein has been obtained
from sources believed to be reliable and accurate, however,
its accuracy and completeness cannot be guaranteed.
This site is not an investment advisor, hence it does
not endorse or recommend any securities or other investments.
Any recommendation contained in this report may not
be suitable for all investors and it is not to be deemed
an offer or solicitation on our part with respect to
the purchase or sale of any securities. All trademarks,
service marks and trade names appearing in this report
are the property of their respective owners, and are
likewise used for identification purposes only.
This report is a service available
only to active Paid Premium Members.
You may opt-out of receiving report notifications
at any time. Questions or comments may be submitted
by writing to Premium Membership Services 665 S.E. 10 Street, Suite 201 Deerfield Beach, FL 33441-5634 or by calling 1-800-965-8307
or 954-785-1121.
|
|
|

