You are not logged in.
This means you
CAN ONLY VIEW reports that were published prior to Monday, February 26, 2024.
You
MUST UPGRADE YOUR MEMBERSHIP if you want to see any current reports.
AFTER MARKET UPDATE - FRIDAY, MARCH 20TH, 2020
Previous After Market Report Next After Market Report >>>
|
|
|
|
DOW |
-913.21 |
19,173.98 |
-4.55% |
|
Volume |
2,701,795,700 |
+58% |
|
Volume |
5,192,896,900 |
+10% |
|
NASDAQ |
-271.06 |
6,879.52 |
-3.79% |
|
Advancers |
1,295 |
44% |
|
Advancers |
1,301 |
40% |
|
S&P 500 |
-104.47 |
2,304.92 |
-4.34% |
|
Decliners |
1,617 |
56% |
|
Decliners |
1,973 |
60% |
|
Russell 2000 |
-44.70 |
1,014.05 |
-4.22% |
|
52 Wk Highs |
1 |
|
|
52 Wk Highs |
8 |
|
|
S&P 600 |
-30.45 |
604.74 |
-4.79% |
|
52 Wk Lows |
299 |
|
|
52 Wk Lows |
329 |
|
|
During market corrections it is especially important to reduce exposure, preserve your capital, and just be patient. Be safe! Historic studies have shown that the biggest up sessions have occurred during market corrections and bear markets.
Disciplined investors know to wait until a new confirmed rally marked by a solid follow-through day. The bold portion of the daily market commentary will note when that happens. For any clarification or additional help applying the fact-based investment system, we invite members to call, or contact us via the inquiry form.
|
 |
Bear Market Continues Inflicting Damage on Major Indices
Kenneth J. Gruneisen - Passed the CAN SLIM® Master's Exam
The Dow lost 913 points to 19,173, bringing its weekly decline to 17.3%, which marked the 30-stock index’s worst weekly performance since October 2008. The S&P 500 lost 4.3%, slumping 15% for the week and has now fallen 31.9% from its February 19th all-time high. The Nasdaq Composite fell 3.8%, notching a 12.6% weekly decline. Breadth was negative as decliners led advancers by almost a 4-3 margin on the NYSE and 3-2 on the Nasdaq exchange. The reported volume totals were higher than the prior session total on the NYSE and on the Nasdaq exchange, indicative of distributional pressure or institutional selling. Leadership was thin as only one high-ranked company from the Leaders List that hit a new 52-week high and was listed on the BreakOuts Page versus 9 on the prior session. New 52-week lows totals decisively outnumbered new 52-week highs totals which were in the single digits on both the NYSE and on the Nasdaq exchange. The major indices' (M criteria) have been in a noted "market correction" and investors have been prompted since February 25th to reduce market exposure. Disciplined investors know to watch for a follow-through day of gains on higher volume to confirm a new market uptrend before initiating any new buying efforts. The Featured Stocks Page provides the most timely analysis on high-ranked leaders. Charts used courtesy of www.stockcharts.com
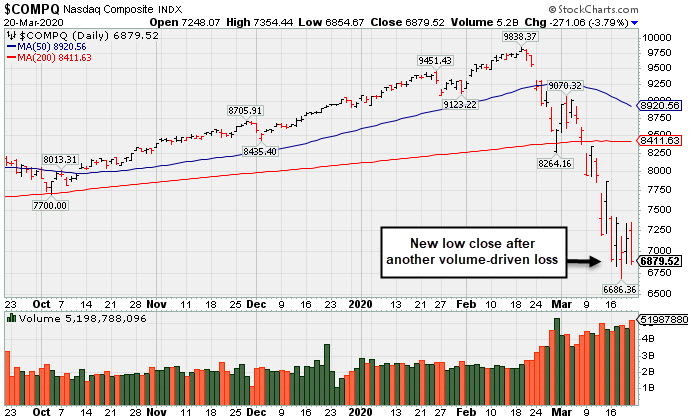
PICTURED: The Nasdaq Composite Index slumped to a new low close. It is -30% off the all-time high hit on 2/19/20. Stocks finished firmly lower on Friday, reversing early session gains as an increasing number of states ordered residents to stay home amid the COVID-19 outbreak. New York and Illinois joined California in issuing a lockdown, further dampening the U.S. economic outlook. The Trump administration moved to close non-essential travel to and from Mexico.
Adding to the volatility on Friday was the “quadruple witching” phenomena, a quarterly event during which options and futures on indexes and equities are slated to expire simultaneously. U.S. stock trading volume was roughly 60% above the average. Efforts to increase liquidity in markets from the Federal Reserve and other central banks around the world did little to offset declines in equity markets. Investors also awaited the approval on fiscal stimulus measures from Congress, which are expected to top $1 trillion in aid.
Ten of 11 S&P 500 sectors lost more than 2.5%, with the Utilities and Consumer Staples groups leading laggards. Energy shares bucked the downtrend, adding 1%, despite WTI crude slipping 11.1% to $22.43/barrel. Treasuries strengthened, with the yield on the 10-year note tumbling 30 basis points to 0.88%. On the data front, a report showed U.S. existing home sales spiked 6.5% in February to a 13-year high. |
 Kenneth J. Gruneisen started out as a licensed stockbroker in August 1987, a couple of months prior to the historic stock market crash that took the Dow Jones Industrial Average down -22.6% in a single day. He has published daily fact-based fundamental and technical analysis on high-ranked stocks online for two decades. Through FACTBASEDINVESTING.COM, Kenneth provides educational articles, news, market commentary, and other information regarding proven investment systems that work in good times and bad.
Comments contained in the body of this report are technical opinions only and are not necessarily those of Gruneisen Growth Corp. The material herein has been obtained from sources believed to be reliable and accurate, however, its accuracy and completeness cannot be guaranteed. Our firm, employees, and customers may effect transactions, including transactions contrary to any recommendation herein, or have positions in the securities mentioned herein or options with respect thereto. Any recommendation contained in this report may not be suitable for all investors and it is not to be deemed an offer or solicitation on our part with respect to the purchase or sale of any securities. |
|
 |
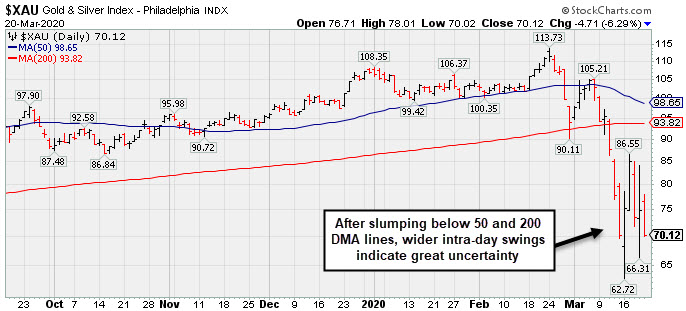
Gold & Silver Index Leads Tech, Financial, and Retail Indexes Lower
Kenneth J. Gruneisen - Passed the CAN SLIM® Master's Exam
Energy-linked groups bounced mildly as the Oil Services Index ($OSX +0.71%) and the Integrated Oil Index ($XOI +2.25%) posted gains, meanwhile the Gold & Silver Index ($XAU -6.29%) was a standout decliner. The Bank Index ($BKX -4.02%), Broker/Dealer Index ($XBD -2.75%), and the Retail Index ($RLX -3.23%) fell. The tech sector had a negative bias as the Semiconductor Index ($SOX -3.18%), Networking Index ($NWX -2.95%), and Biotech Index ($BTK -2.36%) fell.
PICTURED: The Gold & Silver Index ($XAU -6.29%) was a big decliner on Friday. After slumping below its 50-day and 200-day moving average (DMA) lines, wider intra-day swings indicate great uncertainty.
| Oil Services |
$OSX |
22.88 |
+0.16 |
+0.70% |
-70.78% |
| Integrated Oil |
$XOI |
511.63 |
+11.24 |
+2.25% |
-59.73% |
| Semiconductor |
$SOX |
1,298.54 |
-42.68 |
-3.18% |
-29.79% |
| Networking |
$NWX |
395.97 |
-12.04 |
-2.95% |
-32.13% |
| Broker/Dealer |
$XBD |
191.45 |
-5.42 |
-2.75% |
-34.07% |
| Retail |
$RLX |
1,979.48 |
-66.16 |
-3.23% |
-19.18% |
| Gold & Silver |
$XAU |
70.12 |
-4.70 |
-6.28% |
-34.42% |
| Bank |
$BKX |
60.56 |
-2.54 |
-4.03% |
-46.58% |
| Biotech |
$BTK |
3,972.15 |
-96.11 |
-2.36% |
-21.61% |
|
|
|
 |
No Featured Stocks
Kenneth J. Gruneisen - Passed the CAN SLIM® Master's Exam
During extremely bearish markets the number of stocks covered in this area has sometimes been reduced to zero. We suggest making no excuses for weak stocks in weak markets. Feel free to contact us if you have a need for any additional information. |
|
|
Color Codes Explained :
Y - Better candidates highlighted by our
staff of experts.
G - Previously featured
in past reports as yellow but may no longer be buyable under the
guidelines.
***Last / Change / Volume data in this table is the closing quote data***
|
|
|
THESE ARE NOT BUY RECOMMENDATIONS!
Comments contained in the body of this report are technical
opinions only. The material herein has been obtained
from sources believed to be reliable and accurate, however,
its accuracy and completeness cannot be guaranteed.
This site is not an investment advisor, hence it does
not endorse or recommend any securities or other investments.
Any recommendation contained in this report may not
be suitable for all investors and it is not to be deemed
an offer or solicitation on our part with respect to
the purchase or sale of any securities. All trademarks,
service marks and trade names appearing in this report
are the property of their respective owners, and are
likewise used for identification purposes only.
This report is a service available
only to active Paid Premium Members.
You may opt-out of receiving report notifications
at any time. Questions or comments may be submitted
by writing to Premium Membership Services 665 S.E. 10 Street, Suite 201 Deerfield Beach, FL 33441-5634 or by calling 1-800-965-8307
or 954-785-1121.
|
|
|