You are not logged in.
This means you
CAN ONLY VIEW reports that were published prior to Monday, April 14, 2025.
You
MUST UPGRADE YOUR MEMBERSHIP if you want to see any current reports.
AFTER MARKET UPDATE - WEDNESDAY, MARCH 20TH, 2013
Previous After Market Report Next After Market Report >>>
|
|
|
|
DOW |
+55.91 |
14,511.73 |
+0.39% |
|
Volume |
672,951,140 |
-8% |
|
Volume |
1,539,502,240 |
-6% |
|
NASDAQ |
+25.09 |
3,254.19 |
+0.78% |
|
Advancers |
2,263 |
72% |
|
Advancers |
1,731 |
68% |
|
S&P 500 |
+10.37 |
1,558.71 |
+0.67% |
|
Decliners |
755 |
24% |
|
Decliners |
722 |
28% |
|
Russell 2000 |
+9.10 |
951.95 |
+0.97% |
|
52 Wk Highs |
323 |
|
|
52 Wk Highs |
167 |
|
|
S&P 600 |
+4.48 |
531.64 |
+0.85% |
|
52 Wk Lows |
16 |
|
|
52 Wk Lows |
17 |
|
|
 |
Major Averages Rose With Less Volume Conviction
Kenneth J. Gruneisen - Passed the CAN SLIM® Master's Exam
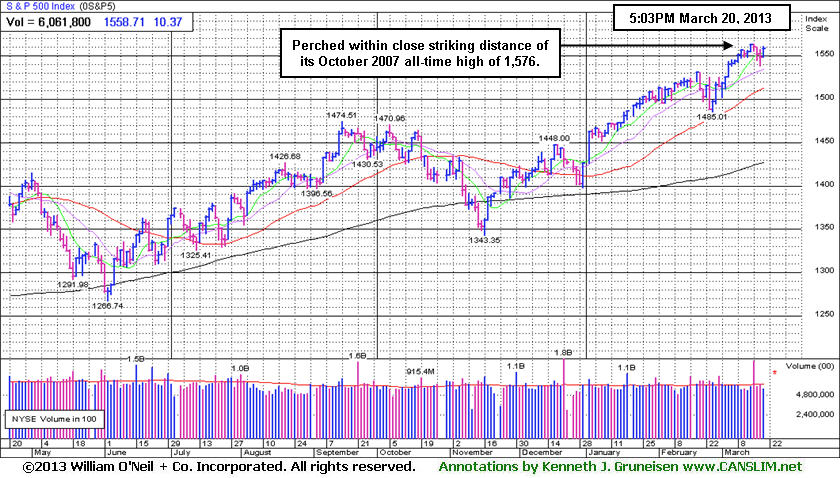
The major averages tallied gains on Wednesday and ended the session unanimously higher, albeit off of their best levels. The volume totals were reported slightly lower versus the prior session totals on the NYSE and on the Nasdaq exchange, however, which suggested that the institutional crowd was not aggressively accumulating shares. Breadth was positive as advancers led decliners by a 3-1 margin on the NYSE and by more than 2-1 on the Nasdaq exchange. The total number of stocks hitting new 52-week highs swelled and easily outnumbered new 52-week lows on the NYSE and on the Nasdaq exchange. There were 97 high-ranked companies from the CANSLIM.net Leaders List making new 52-week highs and appearing on the CANSLIM.net BreakOuts Page, up from the prior session's total of 54 stocks. There were gains for all of the 17 high-ranked companies currently included on the Featured Stocks Page.
The Dow Jones Industrial average advanced nearly 56 points to 14,511 after being up by as many as 91 points in early action. Investors shook off concerns over a bailout for Cyprus. The Fed's decision to hold rates at record lows and reaffirm its stance on bond purchases helped buoy stocks.
All 10 sectors on the S&P ended higher, led by gains in consumer stocks. Homebuilders rallied in the session with Lennar Corp (LEN +4.8%)rallying after posting a stronger than expected fourth-quarter profit tally. Also among earnings, Adobe Systems (ADBE +4.2%) rose following their better-than-expected fiscal first-quarter earnings. On the downside, FedEx Corp (FDX -6.9%) dove after falling short of estimates.
Turning to fixed income markets, Treasuries were lower along the curve. The benchmark 10-year note was down 9/16 to yield 1.96% and the 30-year bond was off over a full point to yield 3.19%.
New buying efforts are justified under the fact-based system since a follow-through day on 3/05/13 shifted the market's (M criteria) direction to a confirmed rally again after a brief correction. Any sustainable rally requires a healthy crop of companies hitting new 52-week highs, so it is always essential to see meaningful leadership (stocks hitting new 52-week highs).
Watch for an announcement via email concerning the next WEBCAST. The webcast will also be available via an updated link highlighted at the top of the Premium Member Homepage.
PICTURED: The S&P 500 Index snapped a 3-session losing streak and it is perched within close striking distance of its October 2007 all-time high of 1,576.
|
 Kenneth J. Gruneisen started out as a licensed stockbroker in August 1987, a couple of months prior to the historic stock market crash that took the Dow Jones Industrial Average down -22.6% in a single day. He has published daily fact-based fundamental and technical analysis on high-ranked stocks online for two decades. Through FACTBASEDINVESTING.COM, Kenneth provides educational articles, news, market commentary, and other information regarding proven investment systems that work in good times and bad.
Comments contained in the body of this report are technical opinions only and are not necessarily those of Gruneisen Growth Corp. The material herein has been obtained from sources believed to be reliable and accurate, however, its accuracy and completeness cannot be guaranteed. Our firm, employees, and customers may effect transactions, including transactions contrary to any recommendation herein, or have positions in the securities mentioned herein or options with respect thereto. Any recommendation contained in this report may not be suitable for all investors and it is not to be deemed an offer or solicitation on our part with respect to the purchase or sale of any securities. |
|
 |
Retail, Financial, Tech, and Energy-Related Groups Rose
Kenneth J. Gruneisen - Passed the CAN SLIM® Master's Exam
The Retail Index ($RLX +1.03%) and financial groups underpinned the major averages' rally as the Broker/Dealer Index ($XBD +1.59%) and Bank Index ($BKX +0.49%) rose on Wednesday. The tech sector saw unanimous gains from the Networking Index ($NWX +0.81%), Biotechnology Index ($BTK +1.15%), Semiconductor Index ($SOX +1.24%), and the Internet Index ($IIX +1.25%). Energy-related groups also had a positive bias as the Oil Services Index ($OSX +0.62%) and Integrated Oil Index ($XOI +0.84%) tallied gains. Meanwhile, defensive groups lagged as the Healthcare Index ($HMO -0.34%) and Gold & Silver Index ($XAU -0.18%) edged lower.
Charts courtesy www.stockcharts.com
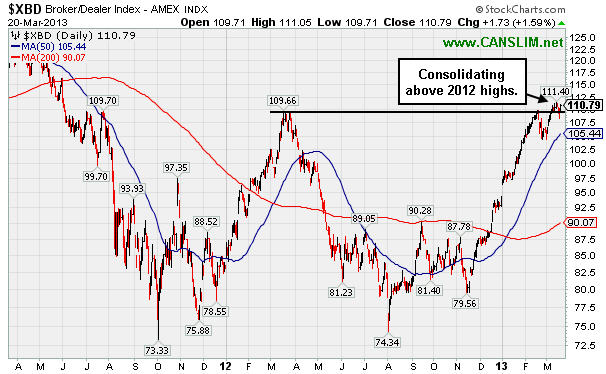
PICTURED: The Broker/Dealer Index ($XBD +1.59%) is consolidating above 2012 highs.
| Oil Services |
$OSX |
240.31 |
+1.48 |
+0.62% |
+9.15% |
| Healthcare |
$HMO |
2,776.51 |
-9.45 |
-0.34% |
+10.43% |
| Integrated Oil |
$XOI |
1,354.81 |
+11.34 |
+0.84% |
+9.10% |
| Semiconductor |
$SOX |
432.01 |
+5.28 |
+1.24% |
+12.49% |
| Networking |
$NWX |
239.08 |
+1.92 |
+0.81% |
+5.53% |
| Internet |
$IIX |
364.72 |
+4.51 |
+1.25% |
+11.54% |
| Broker/Dealer |
$XBD |
110.79 |
+1.73 |
+1.59% |
+17.45% |
| Retail |
$RLX |
718.25 |
+7.31 |
+1.03% |
+9.98% |
| Gold & Silver |
$XAU |
134.49 |
-0.24 |
-0.18% |
-18.79% |
| Bank |
$BKX |
57.12 |
+0.28 |
+0.49% |
+11.39% |
| Biotech |
$BTK |
1,795.93 |
+20.47 |
+1.15% |
+16.09% |
|
|
|
 |
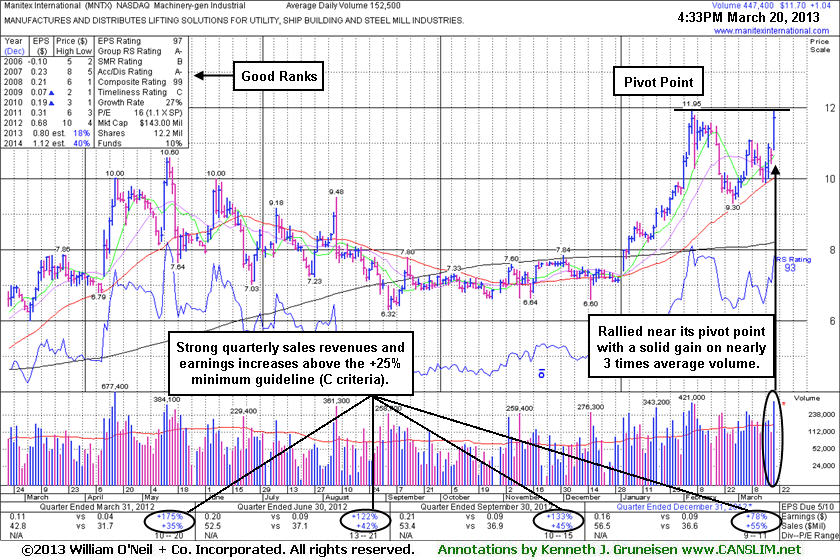
Finished Strong While Rallying Toward its Pivot Point
Kenneth J. Gruneisen - Passed the CAN SLIM® Master's Exam
Often, when a leading stock is setting up to breakout of a solid base it is highlighted in CANSLIM.net's Mid-Day Breakouts Report. The most relevant factors are noted in the report which alerts prudent CANSLIM oriented investors to place the issue in their watch list. After doing any necessary backup research, the investor is prepared to act after the stock triggers a technical buy signal (breaks above its pivot point on more than +50% average turnover) but before it gets too extended from a sound base. In the event the stock fails to trigger a technical buy signal and its price declines then it will simply be removed from the watch list. Disciplined investors know to buy as near as possible to the pivot point and avoid chasing stocks after they have rallied more than +5% above their pivot point. It is crucial to always limit losses whenever any stock heads the wrong direction, and disciplined investors sell if a struggling stock ever falls more than -7% from their purchase price.
Manitex International (MNTX +$1.04 or +9.76% to $11.70) finished strong after highlighted in yellow in the earlier mid-day report (read here) while building on a choppy 7-week base with pivot point cited based on its 2/06/13 high plus 10 cents. Subsequent volume-driven gains above the pivot point cited are still needed to trigger a technical buy signal before action may be justified under the fact-based system. This low-priced stock has rallied within striking distance of its 52-week high. It found support while consolidating above its 50-day moving average (DMA) line in recent weeks after a spurt of volume-driven gains. It reported earnings +78% on +55% sales revenues for the quarter ended December 31, 2012 versus the year ago period, marking its 4th consecutive quarter with earnings increasing by well above the +25% minimum earnings guideline (C criteria). Annual earnings (A criteria) growth has improved since a downturn in FY '08 and '09 earnings.
The number of top-rated funds owning its shares rose from 24 in Mar '12 to 34 in Dec '12, a reassuring sign concerning the I criteria. Its current Up/Down Volume Ratio of 1.7 also provides an unbiased indication that its shares have been under accumulation over the past 50 days. Its small supply (S criteria) of only 10.3 million shares in the public float can contribute to greater price volatility in the event of any institutional buying or selling. Low-priced stocks are discouraged from consideration unless all key criteria are solidly satisfied. Disciplined investors know there is no advantage to getting in "early" and will watch for a proper technical buy signal to confirm that odds are favorable for a meaningful and sustained advance.
|
|
|
Color Codes Explained :
Y - Better candidates highlighted by our
staff of experts.
G - Previously featured
in past reports as yellow but may no longer be buyable under the
guidelines.
***Last / Change / Volume data in this table is the closing quote data***
Symbol/Exchange
Company Name
Industry Group |
PRICE |
CHANGE
(%Change) |
Day High |
Volume
(% DAV)
(% 50 day avg vol) |
52 Wk Hi
% From Hi |
Featured
Date |
Price
Featured |
Pivot Featured |
|
Max Buy |
CELG
-
NASDAQ
Celgene Corp
DRUGS - Drug Manufacturers - Major
|
$112.32
|
+1.28
1.15% |
$112.71
|
2,379,557
59.42% of 50 DAV
50 DAV is 4,004,800
|
$115.44
-2.70%
|
12/11/2012
|
$82.24
|
PP = $81.34
|
|
MB = $85.41
|
Most Recent Note - 3/19/2013 5:34:37 PM
G - Hovering near its all-time high after 3 consecutive small losses. Very extended from any sound base. Its 50 DMA line defines important support to watch.
>>> The latest Featured Stock Update with an annotated graph appeared on 2/28/2013. Click here.
View all notes |
Alert me of new notes |
CANSLIM.net Company Profile |
SEC |
Zacks Reports |
StockTalk |
News |
Chart |
Request a new note
C
A N
S L
I M


|
CFNL
-
NASDAQ
Cardinal Financial Corp
BANKING - Regional - Southeast Banks
|
$17.74
|
+0.01
0.06% |
$17.89
|
172,587
78.95% of 50 DAV
50 DAV is 218,600
|
$18.19
-2.47%
|
3/7/2013
|
$17.27
|
PP = $16.77
|
|
MB = $17.61
|
Most Recent Note - 3/15/2013 5:05:49 PM
G - Color code is changed to green while holding its ground stubbornly. Perched near its 52-week high since volume-driven gains last week cleared a "double bottom" base and triggered a technical buy signal. Prior highs in the high $16 area define initial support to watch on pullbacks.
>>> The latest Featured Stock Update with an annotated graph appeared on 3/18/2013. Click here.
View all notes |
Alert me of new notes |
CANSLIM.net Company Profile |
SEC |
Zacks Reports |
StockTalk |
News |
Chart |
Request a new note
C
A N
S L
I M
|
CMCSA
-
NASDAQ
Comcast Corp Cl A
MEDIA - CATV Systems
|
$40.98
|
+0.85
2.12% |
$41.09
|
12,650,029
91.13% of 50 DAV
50 DAV is 13,881,300
|
$42.00
-2.43%
|
12/3/2012
|
$37.08
|
PP = $38.06
|
|
MB = $39.96
|
Most Recent Note - 3/19/2013 5:32:52 PM
G - Testing support at its 50 DMA line while enduring mild distributional pressure. Relative Strength Rating has slumped to 75, below the 80+ guideline. Fundamental concerns remain since it reported earnings +11% on +6% sales revenues for the Dec '12 quarter. See latest FSU analysis for more details and a new annotated graph.
>>> The latest Featured Stock Update with an annotated graph appeared on 3/19/2013. Click here.
View all notes |
Alert me of new notes |
CANSLIM.net Company Profile |
SEC |
Zacks Reports |
StockTalk |
News |
Chart |
Request a new note
C
A N
S L
I M
|
CVLT
-
NASDAQ
Commvault Systems Inc
COMPUTER SOFTWARE and SERVICES - Business Software and Services
|
$82.74
|
+1.41
1.73% |
$82.83
|
397,527
51.26% of 50 DAV
50 DAV is 775,500
|
$86.89
-4.78%
|
3/14/2013
|
$84.71
|
PP = $79.63
|
|
MB = $83.61
|
Most Recent Note - 3/14/2013 6:09:38 PM
Y - Finished the session with a solid gain backed by 4.5 times average volume while clearing the pivot point cited based on its 2/01/13 high plus 10 cents and hitting new 52-week highs. Found support at its 50 DMA line during its orderly consolidation. See the latest FSU analysis for more details and a new annotated graph.
>>> The latest Featured Stock Update with an annotated graph appeared on 3/14/2013. Click here.
View all notes |
Alert me of new notes |
CANSLIM.net Company Profile |
SEC |
Zacks Reports |
StockTalk |
News |
Chart |
Request a new note
C
A N
S L
I M
|
EVER
-
NYSE
Everbank Financial Corp
BANKING
|
$15.27
|
+0.16
1.06% |
$15.39
|
472,242
53.92% of 50 DAV
50 DAV is 875,800
|
$17.29
-11.68%
|
3/4/2013
|
$15.38
|
PP = $15.83
|
|
MB = $16.62
|
Most Recent Note - 3/18/2013 3:29:36 PM
G - Small gap down today trading near its 50 DMA line and its color code is changed to green. Damaging losses last week violated prior highs in the $16 area noted as initial chart support to watch, raising concerns and completely negating its prior technical breakout.
>>> The latest Featured Stock Update with an annotated graph appeared on 3/4/2013. Click here.
View all notes |
Alert me of new notes |
CANSLIM.net Company Profile |
SEC |
Zacks Reports |
StockTalk |
News |
Chart |
Request a new note
C
A N
S L
I M
|
Symbol/Exchange
Company Name
Industry Group |
PRICE |
CHANGE
(%Change) |
Day High |
Volume
(% DAV)
(% 50 day avg vol) |
52 Wk Hi
% From Hi |
Featured
Date |
Price
Featured |
Pivot Featured |
|
Max Buy |
JAZZ
-
NASDAQ
Jazz Pharmaceuticals Plc
DRUGS - Biotechnology
|
$58.21
|
+0.05
0.09% |
$59.11
|
762,098
141.79% of 50 DAV
50 DAV is 537,500
|
$60.79
-4.24%
|
3/5/2013
|
$59.10
|
PP = $60.10
|
|
MB = $63.11
|
Most Recent Note - 3/18/2013 5:52:46 PM
Y - Still holding its ground perched near its 52-week high since completing a Secondary Offering on 3/05/13. Disciplined investors may watch for a volume-driven gain above the pivot point to trigger a technical buy signal before new buying efforts may be justified under the fact-based investment system.
>>> The latest Featured Stock Update with an annotated graph appeared on 3/7/2013. Click here.
View all notes |
Alert me of new notes |
CANSLIM.net Company Profile |
SEC |
Zacks Reports |
StockTalk |
News |
Chart |
Request a new note
C
A N
S L
I M
|
KORS
-
NYSE
Michael Kors Hldgs Ltd
RETAIL - Apparel Stores
|
$56.38
|
+0.23
0.41% |
$56.93
|
3,920,271
64.92% of 50 DAV
50 DAV is 6,038,300
|
$65.10
-13.39%
|
1/23/2013
|
$54.98
|
PP = $58.72
|
|
MB = $61.66
|
Most Recent Note - 3/19/2013 5:35:59 PM
G - Color code is changed to green after slumping back below its 50 DMA line raising concerns. Completed another Secondary Offering 2/20/13 while perched near its all-time high.
>>> The latest Featured Stock Update with an annotated graph appeared on 3/8/2013. Click here.
View all notes |
Alert me of new notes |
CANSLIM.net Company Profile |
SEC |
Zacks Reports |
StockTalk |
News |
Chart |
Request a new note
C
A N
S L
I M
|
LNKD
-
NYSE
Linkedin Corp Class A
INTERNET - Internet Information Providers
|
$174.66
|
+1.60
0.92% |
$175.34
|
968,541
39.31% of 50 DAV
50 DAV is 2,463,900
|
$184.15
-5.15%
|
2/8/2013
|
$147.04
|
PP = $127.55
|
|
MB = $133.93
|
Most Recent Note - 3/14/2013 12:37:16 PM
G - Hit yet another new high with today's gain. Repeatedly noted - "Very extended from its prior base, but having rallied more than +20% in the first 2-3 weeks after its breakout, the investment system rules suggest holding such winners for a minimum of 8 weeks. See the latest FSU analysis for more details and a new annotated graph."
>>> The latest Featured Stock Update with an annotated graph appeared on 3/11/2013. Click here.
View all notes |
Alert me of new notes |
CANSLIM.net Company Profile |
SEC |
Zacks Reports |
StockTalk |
News |
Chart |
Request a new note
C
A N
S L
I M
|
LOPE
-
NASDAQ
Grand Canyon Education
DIVERSIFIED SERVICES - Education and; Training Services
|
$24.50
|
+0.52
2.17% |
$24.68
|
212,117
45.49% of 50 DAV
50 DAV is 466,300
|
$27.18
-9.86%
|
2/20/2013
|
$26.44
|
PP = $25.10
|
|
MB = $26.36
|
 Most Recent Note - 3/20/2013 5:20:00 PM
G - Rising from its 50 DMA line with light volume behind its recent gains. Volume totals have cooled in recent weeks after it quickly negated the prior technical breakout. It has not formed a sound new base.
>>> The latest Featured Stock Update with an annotated graph appeared on 3/13/2013. Click here.
View all notes |
Alert me of new notes |
CANSLIM.net Company Profile |
SEC |
Zacks Reports |
StockTalk |
News |
Chart |
Request a new note
C
A N
S L
I M
|
MIDD
-
NASDAQ
Middleby Corp
MANUFACTURING - Diversified Machinery
|
$151.79
|
+3.29
2.22% |
$151.79
|
137,279
149.22% of 50 DAV
50 DAV is 92,000
|
$154.74
-1.91%
|
10/8/2012
|
$118.46
|
PP = $122.67
|
|
MB = $128.80
|
Most Recent Note - 3/20/2013 5:21:19 PM
G - Tallied a gain today with above average volume for a best-ever close. Recently staying in tight trading range near all-time highs, stubbornly holding its ground. Fundamental concerns were recently noted. Its 50 DMA line defines important near-term chart support.
>>> The latest Featured Stock Update with an annotated graph appeared on 2/25/2013. Click here.
View all notes |
Alert me of new notes |
CANSLIM.net Company Profile |
SEC |
Zacks Reports |
StockTalk |
News |
Chart |
Request a new note
C
A N
S L
I M
|
Symbol/Exchange
Company Name
Industry Group |
PRICE |
CHANGE
(%Change) |
Day High |
Volume
(% DAV)
(% 50 day avg vol) |
52 Wk Hi
% From Hi |
Featured
Date |
Price
Featured |
Pivot Featured |
|
Max Buy |
MNTX
-
NASDAQ
Manitex International
MANUFACTURING - Diversified Machinery
|
$11.70
|
+1.04
9.76% |
$11.92
|
447,441
293.40% of 50 DAV
50 DAV is 152,500
|
$11.95
-2.09%
|
3/20/2013
|
$11.29
|
PP = $12.05
|
|
MB = $12.65
|
Most Recent Note - 3/20/2013 5:15:06 PM
Y - Finished strong after highlighted in yellow in the earlier mid-day report (read here) while building on a choppy 7-week base with pivot point cited based on its 2/06/13 high plus 10 cents. Subsequent volume-driven gains above the pivot point cited are needed to trigger a technical buy signal before action may be justified under the fact-based system. See the latest FSU analysis for more details and a new annotated graph.
>>> The latest Featured Stock Update with an annotated graph appeared on 3/20/2013. Click here.
View all notes |
Alert me of new notes |
CANSLIM.net Company Profile |
SEC |
Zacks Reports |
StockTalk |
News |
Chart |
Request a new note
C
A N
S L
I M
|
MRLN
-
NASDAQ
Marlin Business Services
DIVERSIFIED SERVICES - Rental and Leasing Services
|
$21.25
|
+0.22
1.05% |
$21.43
|
17,931
79.34% of 50 DAV
50 DAV is 22,600
|
$23.08
-7.93%
|
3/15/2013
|
$22.29
|
PP = $23.18
|
|
MB = $24.34
|
Most Recent Note - 3/18/2013 5:51:50 PM
Y - Held its ground today following Friday's "negative reversal" and worrisome loss on above average volume. It was highlighted in yellow with pivot point cited based on its 9/21/12 high plus 10 cents in the 3/15/13 mid-day report (read here) and noted - "Disciplined investors may watch for subsequent volume-driven gains above the pivot point to trigger a technical buy signal before action may be justified under the fact-based investment system. Found support near its 200 DMA line in recent months and now rallying within close striking distance of its 52-week high. Recent quarterly comparisons through Dec '12 show strong earnings increases satisfying the C criteria. Annual earnings (A criteria) growth has improved following the downturn in FY '08 and '09." See the latest FSU analysis for more details and a new annotated graph.
>>> The latest Featured Stock Update with an annotated graph appeared on 3/15/2013. Click here.
View all notes |
Alert me of new notes |
CANSLIM.net Company Profile |
SEC |
Zacks Reports |
StockTalk |
News |
Chart |
Request a new note
C
A N
S L
I M
|
MWIV
-
NASDAQ
M W I Veterinary Supply
HEALTH SERVICES - Medical Instruments and; Supplies
|
$132.44
|
+0.14
0.11% |
$133.44
|
28,609
49.50% of 50 DAV
50 DAV is 57,800
|
$137.18
-3.46%
|
3/4/2013
|
$130.90
|
PP = $129.45
|
|
MB = $135.92
|
Most Recent Note - 3/18/2013 3:26:52 PM
Y - Tallying a gain today after dipping below its pivot point late last week. Disciplined investors limit loses by selling if ever any stock fall more than -7% from their purchase price.
>>> The latest Featured Stock Update with an annotated graph appeared on 3/6/2013. Click here.
View all notes |
Alert me of new notes |
CANSLIM.net Company Profile |
SEC |
Zacks Reports |
StockTalk |
News |
Chart |
Request a new note
C
A N
S L
I M
|
N
-
NYSE
Netsuite Inc
DIVERSIFIED SERVICES - Business/Management Services
|
$76.40
|
+1.22
1.62% |
$77.09
|
331,992
93.55% of 50 DAV
50 DAV is 354,900
|
$77.60
-1.55%
|
12/12/2012
|
$64.75
|
PP = $67.12
|
|
MB = $70.48
|
Most Recent Note - 3/15/2013 5:08:15 PM
G - Rose with above average volume today for another new 52-week and all-time high. Its 50 DMA line acted as support during the recent consolidation.
>>> The latest Featured Stock Update with an annotated graph appeared on 3/1/2013. Click here.
View all notes |
Alert me of new notes |
CANSLIM.net Company Profile |
SEC |
Zacks Reports |
StockTalk |
News |
Chart |
Request a new note
C
A N
S L
I M
|
NSR
-
NYSE
Neustar Inc
TELECOMMUNICATIONS - Diversified Communication Serv
|
$45.40
|
+0.65
1.45% |
$45.47
|
406,787
92.12% of 50 DAV
50 DAV is 441,600
|
$47.24
-3.90%
|
3/8/2013
|
$44.99
|
PP = $47.34
|
|
MB = $49.71
|
Most Recent Note - 3/15/2013 3:52:25 PM
Y - Erased the prior session's gain today, retreating near its 50 DMA line. Volume-driven gains above the pivot point may trigger a new (or add-on) technical buy signal. The 2/21/13 low ($42.40) defines important near-term support where any subsequent deterioration would raise greater concerns and trigger a worrisome technical sell signal.
>>> The latest Featured Stock Update with an annotated graph appeared on 2/27/2013. Click here.
View all notes |
Alert me of new notes |
CANSLIM.net Company Profile |
SEC |
Zacks Reports |
StockTalk |
News |
Chart |
Request a new note
C
A N
S L
I M
|
Symbol/Exchange
Company Name
Industry Group |
PRICE |
CHANGE
(%Change) |
Day High |
Volume
(% DAV)
(% 50 day avg vol) |
52 Wk Hi
% From Hi |
Featured
Date |
Price
Featured |
Pivot Featured |
|
Max Buy |
SLCA
-
NYSE
U S Silica Holdings Inc
CHEMICALS - Specialty Chemicals
|
$23.87
|
+1.17
5.15% |
$24.23
|
2,027,936
216.22% of 50 DAV
50 DAV is 937,900
|
$28.50
-16.25%
|
2/26/2013
|
$22.23
|
PP = $21.50
|
|
MB = $22.58
|
Most Recent Note - 3/20/2013 5:18:07 PM
G - Tallied another considerable volume-driven gain today, rebounding from damaging losses since completing a Secondary Offering on 3/14/13. Previously noted - "Very extended from its prior base, but having rallied more than +20% in the first 2-3 weeks after its breakout, the investment system rules suggest holding such winners for a minimum of 8 weeks."
>>> The latest Featured Stock Update with an annotated graph appeared on 2/26/2013. Click here.
View all notes |
Alert me of new notes |
CANSLIM.net Company Profile |
SEC |
Zacks Reports |
StockTalk |
News |
Chart |
Request a new note
C
A N
S L
I M
|
VRX
-
NYSE
Valeant Pharmaceuticals
DRUGS - Drug Manufacturers - Other
|
$73.33
|
+1.89
2.65% |
$74.67
|
2,207,276
178.61% of 50 DAV
50 DAV is 1,235,800
|
$72.04
1.79%
|
12/20/2012
|
$60.24
|
PP = $61.21
|
|
MB = $64.27
|
Most Recent Note - 3/20/2013 12:52:11 PM
G - Hitting yet another new high with today's 3rd consecutive gain, getting very extended from the secondary buy point noted earlier. The 50 DMA line and recent low ($64.05 on 2/21/13) define important support areas to watch on pullbacks.
>>> The latest Featured Stock Update with an annotated graph appeared on 3/12/2013. Click here.
View all notes |
Alert me of new notes |
CANSLIM.net Company Profile |
SEC |
Zacks Reports |
StockTalk |
News |
Chart |
Request a new note
C
A N
S L
I M
|
|
|
|
THESE ARE NOT BUY RECOMMENDATIONS!
Comments contained in the body of this report are technical
opinions only. The material herein has been obtained
from sources believed to be reliable and accurate, however,
its accuracy and completeness cannot be guaranteed.
This site is not an investment advisor, hence it does
not endorse or recommend any securities or other investments.
Any recommendation contained in this report may not
be suitable for all investors and it is not to be deemed
an offer or solicitation on our part with respect to
the purchase or sale of any securities. All trademarks,
service marks and trade names appearing in this report
are the property of their respective owners, and are
likewise used for identification purposes only.
This report is a service available
only to active Paid Premium Members.
You may opt-out of receiving report notifications
at any time. Questions or comments may be submitted
by writing to Premium Membership Services 665 S.E. 10 Street, Suite 201 Deerfield Beach, FL 33441-5634 or by calling 1-800-965-8307
or 954-785-1121.
|
|
|

