You are not logged in.
This means you
CAN ONLY VIEW reports that were published prior to Monday, February 26, 2024.
You
MUST UPGRADE YOUR MEMBERSHIP if you want to see any current reports.
AFTER MARKET UPDATE - THURSDAY, MARCH 19TH, 2020
Previous After Market Report Next After Market Report >>>
|
|
|
|
DOW |
+188.27 |
20,087.19 |
+0.95% |
|
Volume |
1,712,804,120 |
-11% |
|
Volume |
4,702,570,800 |
-3% |
|
NASDAQ |
+160.74 |
7,150.58 |
+2.30% |
|
Advancers |
2,251 |
77% |
|
Advancers |
2,519 |
76% |
|
S&P 500 |
+11.29 |
2,409.39 |
+0.47% |
|
Decliners |
681 |
23% |
|
Decliners |
795 |
24% |
|
Russell 2000 |
+67.55 |
1,058.72 |
+6.82% |
|
52 Wk Highs |
5 |
|
|
52 Wk Highs |
13 |
|
|
S&P 600 |
+34.37 |
635.19 |
+5.72% |
|
52 Wk Lows |
1,051 |
|
|
52 Wk Lows |
811 |
|
|
During market corrections it is especially important to reduce exposure, preserve your capital, and just be patient. Be safe! Historic studies have shown that the biggest up sessions have occurred during market corrections and bear markets.
Disciplined investors know to wait until a new confirmed rally marked by a solid follow-through day. The bold portion of the daily market commentary will note when that happens. For any clarification or additional help applying the fact-based investment system, we invite members to call, or contact us via the inquiry form.
|
 |
Major Indices Posted Small Gains Backed by Lighter Volume
Kenneth J. Gruneisen - Passed the CAN SLIM® Master's Exam
The Dow added 188 points to 20,087, a day after closing under the 20,000 mark for the first time since 2017. The S&P 500 was up 0.5%, snapping a record eight-day streak of volatility during which the benchmark index notched daily moves of 4% or more. The Nasdaq Composite advanced 2.3% on Tech-related stock strength. Small caps outperformed, with the Russell 2000 jumping more than 6%. Breadth was positive as advancers led decliners by a 3-1 margin on the NYSE and on the Nasdaq exchange. The reported volume totals were lighter than the prior session total on the NYSE and on the Nasdaq exchange. Leadership improved slightly as there were 9 high-ranked companies from the Leaders List that hit a new 52-week high and were listed on the BreakOuts Page versus 4 on the prior session. New 52-week lows totals still decisively outnumbered new 52-week highs totals on both the NYSE and on the Nasdaq exchange. The major indices' (M criteria) have been in a noted "market correction" and investors have been prompted since February 25th to reduce market exposure. Disciplined investors know to watch for a follow-through day of gains on higher volume to confirm a new market uptrend before initiating any new buying efforts. The Featured Stocks Page provides the most timely analysis on high-ranked leaders. Charts used courtesy of www.stockcharts.com
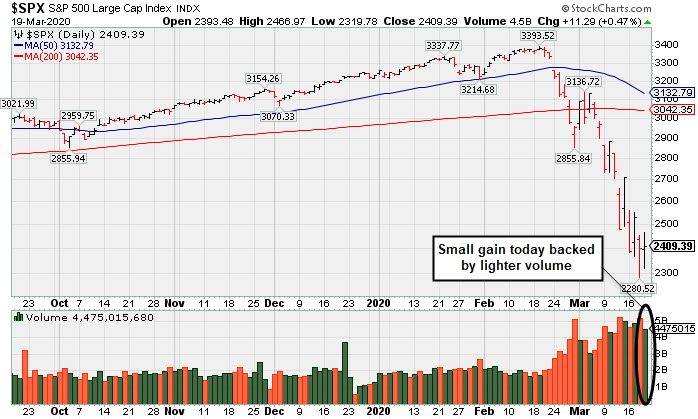
PICTURED: The S&P 500 Index posted a small gain with lighter volume. It is -29% off the all-time high hit on 2/19/20. Stocks finished higher on Thursday, reversing early session declines as investors weighed stimulus measures from around the globe. The European Central bank announced a more than $800 billion bond buying program, while the Federal Reserve launched a lending facility for money market mutual funds. The dollar continued its recent ascent, while Treasuries strengthened, with the yield on the 10-year note down three basis points to 1.18%.
Seven of 11 S&P 500 sectors closed in positive territory, with the more traditionally defensive sectors lagging. Energy shares paced gains, with WTI crude rallying 23.6% to $25.18/barrel, rebounding from an 18-year low with its best session on record. Chipmakers also caught a tailwind, with Broadcom (AVGO +15.83%) rose on reports that Chinese demand had returned to normal. In other corporate news, Ford (F -0.67%) suspended its dividend and tapped into lines of credit in order to help bolster its cash reserves amid coronavirus uncertainty.
On the data front, initial jobless claims spiked to 281,000 in the most recent week, well above forecasts of 220,000 and the highest since 2017. Separately, the Philadelphia Fed’s business outlook posted its largest decline on record, falling to -12.7 in March from 36.7 in February. |
 Kenneth J. Gruneisen started out as a licensed stockbroker in August 1987, a couple of months prior to the historic stock market crash that took the Dow Jones Industrial Average down -22.6% in a single day. He has published daily fact-based fundamental and technical analysis on high-ranked stocks online for two decades. Through FACTBASEDINVESTING.COM, Kenneth provides educational articles, news, market commentary, and other information regarding proven investment systems that work in good times and bad.
Comments contained in the body of this report are technical opinions only and are not necessarily those of Gruneisen Growth Corp. The material herein has been obtained from sources believed to be reliable and accurate, however, its accuracy and completeness cannot be guaranteed. Our firm, employees, and customers may effect transactions, including transactions contrary to any recommendation herein, or have positions in the securities mentioned herein or options with respect thereto. Any recommendation contained in this report may not be suitable for all investors and it is not to be deemed an offer or solicitation on our part with respect to the purchase or sale of any securities. |
|
 |
Tech, Financial, Retail, and Commodity-Linked Groups Bounced
Kenneth J. Gruneisen - Passed the CAN SLIM® Master's Exam
Commodity-linked groups bounced as the Oil Services Index ($OSX +5.78%) and the Integrated Oil Index ($XOI +6.54%) posted gains and the Gold & Silver Index ($XAU +1.87%) rose. The Bank Index ($BKX +3.92%) and Broker/Dealer Index ($XBD +5.17%) also rose, both outpacing the Retail Index ($RLX +2.49%). The tech sector had a positive bias as the Semiconductor Index ($SOX +4.23%) and Networking Index ($NWX +7.53%).
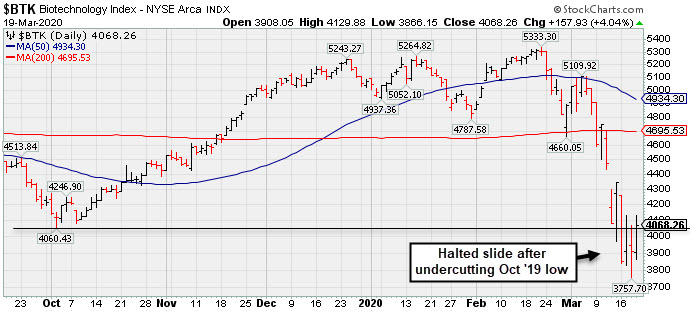
PICTURED: The Biotech Index ($BTK +4.04%) halted its slide after undercutting the October 2019 low.
| Oil Services |
$OSX |
22.72 |
+1.25 |
+5.82% |
-70.98% |
| Integrated Oil |
$XOI |
500.39 |
+30.72 |
+6.54% |
-60.62% |
| Semiconductor |
$SOX |
1,341.22 |
+54.38 |
+4.23% |
-27.49% |
| Networking |
$NWX |
408.01 |
+28.57 |
+7.53% |
-30.07% |
| Broker/Dealer |
$XBD |
196.87 |
+9.67 |
+5.17% |
-32.20% |
| Retail |
$RLX |
2,045.64 |
+49.73 |
+2.49% |
-16.48% |
| Gold & Silver |
$XAU |
74.82 |
+1.37 |
+1.87% |
-30.02% |
| Bank |
$BKX |
63.10 |
+2.38 |
+3.92% |
-44.34% |
| Biotech |
$BTK |
4,068.26 |
+157.93 |
+4.04% |
-19.72% |
|
|
|
 |
No Featured Stocks
Kenneth J. Gruneisen - Passed the CAN SLIM® Master's Exam
During extremely bearish markets the number of stocks covered in this area has sometimes been reduced to zero. We suggest making no excuses for weak stocks in weak markets. Feel free to contact us if you have a need for any additional information. |
|
|
Color Codes Explained :
Y - Better candidates highlighted by our
staff of experts.
G - Previously featured
in past reports as yellow but may no longer be buyable under the
guidelines.
***Last / Change / Volume data in this table is the closing quote data***
|
|
|
THESE ARE NOT BUY RECOMMENDATIONS!
Comments contained in the body of this report are technical
opinions only. The material herein has been obtained
from sources believed to be reliable and accurate, however,
its accuracy and completeness cannot be guaranteed.
This site is not an investment advisor, hence it does
not endorse or recommend any securities or other investments.
Any recommendation contained in this report may not
be suitable for all investors and it is not to be deemed
an offer or solicitation on our part with respect to
the purchase or sale of any securities. All trademarks,
service marks and trade names appearing in this report
are the property of their respective owners, and are
likewise used for identification purposes only.
This report is a service available
only to active Paid Premium Members.
You may opt-out of receiving report notifications
at any time. Questions or comments may be submitted
by writing to Premium Membership Services 665 S.E. 10 Street, Suite 201 Deerfield Beach, FL 33441-5634 or by calling 1-800-965-8307
or 954-785-1121.
|
|
|