You are not logged in.
This means you
CAN ONLY VIEW reports that were published prior to Monday, April 14, 2025.
You
MUST UPGRADE YOUR MEMBERSHIP if you want to see any current reports.
AFTER MARKET UPDATE - MONDAY, MARCH 18TH, 2013
Previous After Market Report Next After Market Report >>>
|
|
|
|
DOW |
-62.05 |
14,452.06 |
-0.43% |
|
Volume |
676,207,050 |
-63% |
|
Volume |
1,482,727,510 |
-30% |
|
NASDAQ |
-11.48 |
3,237.59 |
-0.35% |
|
Advancers |
1,170 |
37% |
|
Advancers |
865 |
34% |
|
S&P 500 |
-8.60 |
1,552.10 |
-0.55% |
|
Decliners |
1,868 |
59% |
|
Decliners |
1,617 |
63% |
|
Russell 2000 |
-5.28 |
947.20 |
-0.55% |
|
52 Wk Highs |
166 |
|
|
52 Wk Highs |
105 |
|
|
S&P 600 |
-3.15 |
528.58 |
-0.59% |
|
52 Wk Lows |
19 |
|
|
52 Wk Lows |
15 |
|
|
 |
Breadth Negative as Indices Fall on Lighter Volume
Kenneth J. Gruneisen - Passed the CAN SLIM® Master's Exam
The equity markets ended Monday's session lower, albeit off their worst levels. The session had much lower volume totals reported versus the prior session totals on the NYSE and on the Nasdaq exchange, as Friday's totals were inflated by options expirations. Breadth was negative as decliners led advancers by a 3-2 margin on the NYSE and by nearly a 2-1 ratio on the Nasdaq exchange. The total number of stocks hitting new 52-week highs contracted but still easily outnumbered new 52-week lows on the NYSE and on the Nasdaq exchange. There were 45 high-ranked companies from the CANSLIM.net Leaders List making new 52-week highs and appearing on the CANSLIM.net BreakOuts Page, down from the prior session's total of 89 stocks. There were gains for 5 of the 16 high-ranked companies currently included on the Featured Stocks Page
Stocks were lower from the opening bell as investors digested discouraging news out of Europe. In an unexpected move, European finance ministers, the IMF and the Cypriot government placed a tax on Cypriot bank deposits, in return for bailout funding. The unprecedented move heightened concerns throughout the European Union that seizing deposits could potentially be part of future bailouts.
On our shores, housing data was disappointing. The NAHB housing market index unexpectedly fell for the third straight month in March to a five month low of 44. Nine of the 10 sectors on the S&P ended lower, led by declines in financials. Shares of Citigroup Inc (C -2.16%), JP Morgan Chase & Co (JPM -1.02%), and The Goldman Sachs Group Inc (GS -1.87%) fell. Material stocks also retreated after copper prices touched a four-month low which pushed Cliffs Natural Resources (CLF -1.45) shares lower. Gains in telecommunications helped limit losses as Verizon Communications Inc (VZ +1.52%) posted a gain. Hewlett-Packard Co (HPQ +2.93%) rose following an analyst's upgrade.
Turning to fixed income markets, Treasuries ended higher along the curve. The benchmark 10-year note was up 5/16 of a point to yield 1.96% and the 30-year bond gained 17/32 to yield 3.19%.
New buying efforts are justified under the fact-based system since a follow-through day on 3/05/13 shifted the market's (M criteria) direction to a confirmed rally again after a brief correction. Any sustainable rally requires a healthy crop of companies hitting new 52-week highs, so it is always essential to see meaningful leadership (stocks hitting new 52-week highs).
Watch for an announcement via email concerning the next WEBCAST. The webcast will also be available via an updated link highlighted at the top of the Premium Member Homepage.
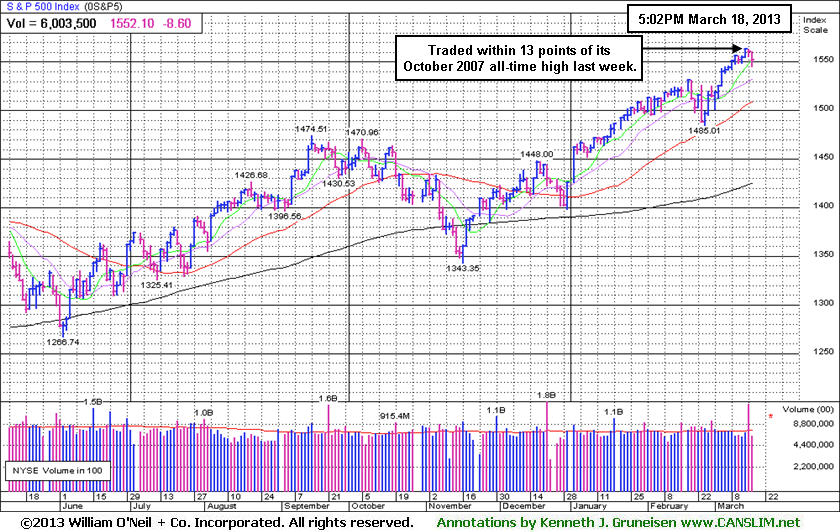
PICTURED: The S&P 500 Index traded within 13 points of its October 2007 all-time high last week.
|
 Kenneth J. Gruneisen started out as a licensed stockbroker in August 1987, a couple of months prior to the historic stock market crash that took the Dow Jones Industrial Average down -22.6% in a single day. He has published daily fact-based fundamental and technical analysis on high-ranked stocks online for two decades. Through FACTBASEDINVESTING.COM, Kenneth provides educational articles, news, market commentary, and other information regarding proven investment systems that work in good times and bad.
Comments contained in the body of this report are technical opinions only and are not necessarily those of Gruneisen Growth Corp. The material herein has been obtained from sources believed to be reliable and accurate, however, its accuracy and completeness cannot be guaranteed. Our firm, employees, and customers may effect transactions, including transactions contrary to any recommendation herein, or have positions in the securities mentioned herein or options with respect thereto. Any recommendation contained in this report may not be suitable for all investors and it is not to be deemed an offer or solicitation on our part with respect to the purchase or sale of any securities. |
|
 |
Financial, Tech, and Energy-Related Shares Led Decliners
Kenneth J. Gruneisen - Passed the CAN SLIM® Master's Exam
Weakness in financial shares weighed on the market as the Broker/Dealer Index ($XBD -1.05%) and Bank Index ($BKX -0.94%) pulled back. The tech sector also faced pressure as the Semiconductor Index ($SOX -1.33%), Networking Index ($NWX -0.96%), Biotechnology Index ($BTK -0.73%), and Internet Index ($IIX -0.53%) ended unanimously lower. Energy-related shares retreated as the Oil Services Index ($OSX -2.38%) outpaced the Integrated Oil Index ($XOI -0.51%) to the downside. The Retail Index ($RLX -0.36%) and Healthcare Index ($HMO -0.19%) also edged lower while the Gold & Silver Index ($XAU +0.23%) posted a small gain.
Charts courtesy www.stockcharts.com
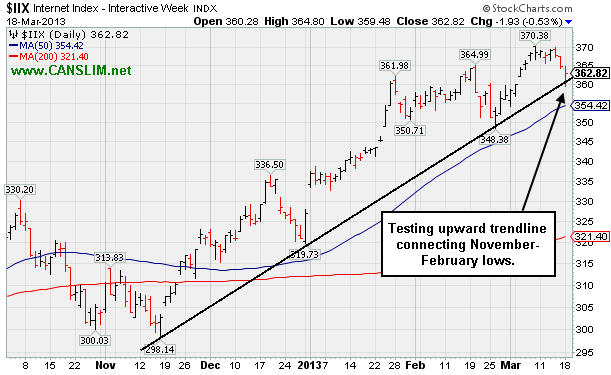
PICTURED: The Internet Index ($IIX -0.53%) is testing an upward trendline connecting its November-February lows defining near-term support above its 50-day moving average (DMA) line.
| Oil Services |
$OSX |
243.73 |
-5.93 |
-2.38% |
+10.71% |
| Healthcare |
$HMO |
2,784.00 |
-5.39 |
-0.19% |
+10.73% |
| Integrated Oil |
$XOI |
1,353.95 |
-6.96 |
-0.51% |
+9.03% |
| Semiconductor |
$SOX |
428.39 |
-5.79 |
-1.33% |
+11.54% |
| Networking |
$NWX |
239.29 |
-2.33 |
-0.96% |
+5.62% |
| Internet |
$IIX |
362.82 |
-1.93 |
-0.53% |
+10.95% |
| Broker/Dealer |
$XBD |
109.84 |
-1.16 |
-1.05% |
+16.44% |
| Retail |
$RLX |
717.28 |
-2.60 |
-0.36% |
+9.83% |
| Gold & Silver |
$XAU |
134.77 |
+0.31 |
+0.23% |
-18.62% |
| Bank |
$BKX |
56.98 |
-0.54 |
-0.94% |
+11.12% |
| Biotech |
$BTK |
1,785.09 |
-13.04 |
-0.73% |
+15.39% |
|
|
|
 |
Holding Ground in Tight Range Following Technical Breakout
Kenneth J. Gruneisen - Passed the CAN SLIM® Master's Exam
Cardinal Financial Corp (CFNL -$0.02 or -0.11% to $17.77) has been holding its ground stubbornly in a tight range perched near its 52-week high since volume-driven gains recently cleared a "double bottom" base and triggered a technical buy signal. It is slightly extended from its prior base. Prior highs in the high $16 area define initial support to watch on pullbacks. It was last shown in this FSU section on 2/21/13 with an annotated graph under the headline, "Violation of 50-Day Moving Average on Light Volume", as it violated its 50-day moving average (DMA) line and finished the session at its low with a loss on below average volume. The deterioration raised concerns and triggered technical sell signal as it was then noted - "Only a prompt rebound above its 50 DMA line would help its outlook improve. It has been trading in a tight range in recent weeks without making meaningful progress above its latest pivot point. Meanwhile, more damaging losses leading to a slump below the recent low ($15.74 on 1/18/13) would raise more serious concerns and trigger an additional technical sell signal. Disciplined investors always limit losses if any stock ever falls more than -7% from their purchase price."
It stayed above the prior low noted and soon repaired its 50 DMA violation. Its rally on 3/07/13 was backed by volume +169% above average as it rose above the new pivot point cited based upon its 2/15/13 high, clearing a "double bottom" base and triggering a proper technical buy signal under the fact-based system. The high-ranked leader hailing from the Banks - Southeast industry group reported earnings +54% on +28% sales revenues for the quarter ended December 31, 2012 versus the year ago period, continuing its track record of strong quarterly earnings comparisons underpinned by encouraging sales revenues increases. It has earned the highest possible 99 Earnings Per Share (EPS) rank, and its high ranks and long term earnings history help it match favorably with the C and A criteria. The number of top-rated funds owning its shares rose from 172 in Sep '11 to 209 in Dec '12, a reassuring trend concerning the I criteria. Its small supply (S criteria) of only 29.3 millions shares outstanding is a favorable characteristic, yet it can contribute to greater price volatility in the event of institutional accumulation or distributional pressure.

|
|
|
Color Codes Explained :
Y - Better candidates highlighted by our
staff of experts.
G - Previously featured
in past reports as yellow but may no longer be buyable under the
guidelines.
***Last / Change / Volume data in this table is the closing quote data***
Symbol/Exchange
Company Name
Industry Group |
PRICE |
CHANGE
(%Change) |
Day High |
Volume
(% DAV)
(% 50 day avg vol) |
52 Wk Hi
% From Hi |
Featured
Date |
Price
Featured |
Pivot Featured |
|
Max Buy |
CELG
-
NASDAQ
Celgene Corp
DRUGS - Drug Manufacturers - Major
|
$111.90
|
-0.50
-0.44% |
$113.49
|
3,226,933
80.70% of 50 DAV
50 DAV is 3,998,800
|
$115.44
-3.07%
|
12/11/2012
|
$82.24
|
PP = $81.34
|
|
MB = $85.41
|
Most Recent Note - 3/12/2013 1:09:23 PM
G - Wedging further into new all-time high territory with today's 6th consecutive gain, getting very extended from any sound base. Its 50 DMA line defines important support to watch.
>>> The latest Featured Stock Update with an annotated graph appeared on 2/28/2013. Click here.
View all notes |
Alert me of new notes |
CANSLIM.net Company Profile |
SEC |
Zacks Reports |
StockTalk |
News |
Chart |
Request a new note
C
A N
S L
I M


|
CFNL
-
NASDAQ
Cardinal Financial Corp
BANKING - Regional - Southeast Banks
|
$17.77
|
-0.02
-0.11% |
$17.79
|
247,463
114.41% of 50 DAV
50 DAV is 216,300
|
$18.19
-2.31%
|
3/7/2013
|
$17.27
|
PP = $16.77
|
|
MB = $17.61
|
Most Recent Note - 3/15/2013 5:05:49 PM
G - Color code is changed to green while holding its ground stubbornly. Perched near its 52-week high since volume-driven gains last week cleared a "double bottom" base and triggered a technical buy signal. Prior highs in the high $16 area define initial support to watch on pullbacks.
>>> The latest Featured Stock Update with an annotated graph appeared on 3/18/2013. Click here.
View all notes |
Alert me of new notes |
CANSLIM.net Company Profile |
SEC |
Zacks Reports |
StockTalk |
News |
Chart |
Request a new note
C
A N
S L
I M
|
CMCSA
-
NASDAQ
Comcast Corp Cl A
MEDIA - CATV Systems
|
$40.37
|
-0.34
-0.84% |
$40.50
|
13,026,840
94.99% of 50 DAV
50 DAV is 13,714,400
|
$42.00
-3.88%
|
12/3/2012
|
$37.08
|
PP = $38.06
|
|
MB = $39.96
|
Most Recent Note - 3/15/2013 11:48:12 AM
G - Still consolidating above support at its 50 DMA line and perched very near its 52-week high. Fundamental concerns remain since it reported earnings +11% on +6% sales revenues for the Dec '12 quarter, below the +25% minimum earnings guideline (C criteria).
>>> The latest Featured Stock Update with an annotated graph appeared on 2/19/2013. Click here.
View all notes |
Alert me of new notes |
CANSLIM.net Company Profile |
SEC |
Zacks Reports |
StockTalk |
News |
Chart |
Request a new note
C
A N
S L
I M
|
CVLT
-
NASDAQ
Commvault Systems Inc
COMPUTER SOFTWARE and SERVICES - Business Software and Services
|
$82.45
|
-1.31
-1.56% |
$85.00
|
606,644
78.74% of 50 DAV
50 DAV is 770,400
|
$86.89
-5.11%
|
3/14/2013
|
$84.71
|
PP = $79.63
|
|
MB = $83.61
|
Most Recent Note - 3/14/2013 6:09:38 PM
Y - Finished the session with a solid gain backed by 4.5 times average volume while clearing the pivot point cited based on its 2/01/13 high plus 10 cents and hitting new 52-week highs. Found support at its 50 DMA line during its orderly consolidation. See the latest FSU analysis for more details and a new annotated graph.
>>> The latest Featured Stock Update with an annotated graph appeared on 3/14/2013. Click here.
View all notes |
Alert me of new notes |
CANSLIM.net Company Profile |
SEC |
Zacks Reports |
StockTalk |
News |
Chart |
Request a new note
C
A N
S L
I M
|
EVER
-
NYSE
Everbank Financial Corp
BANKING
|
$15.09
|
-0.40
-2.58% |
$15.32
|
930,513
108.53% of 50 DAV
50 DAV is 857,400
|
$17.29
-12.72%
|
3/4/2013
|
$15.38
|
PP = $15.83
|
|
MB = $16.62
|
 Most Recent Note - 3/18/2013 3:29:36 PM
G - Small gap down today trading near its 50 DMA line and its color code is changed to green. Damaging losses last week violated prior highs in the $16 area noted as initial chart support to watch, raising concerns and completely negating its prior technical breakout.
>>> The latest Featured Stock Update with an annotated graph appeared on 3/4/2013. Click here.
View all notes |
Alert me of new notes |
CANSLIM.net Company Profile |
SEC |
Zacks Reports |
StockTalk |
News |
Chart |
Request a new note
C
A N
S L
I M
|
Symbol/Exchange
Company Name
Industry Group |
PRICE |
CHANGE
(%Change) |
Day High |
Volume
(% DAV)
(% 50 day avg vol) |
52 Wk Hi
% From Hi |
Featured
Date |
Price
Featured |
Pivot Featured |
|
Max Buy |
JAZZ
-
NASDAQ
Jazz Pharmaceuticals Plc
DRUGS - Biotechnology
|
$58.75
|
-0.50
-0.84% |
$59.59
|
511,474
96.60% of 50 DAV
50 DAV is 529,500
|
$60.79
-3.36%
|
3/5/2013
|
$59.10
|
PP = $60.10
|
|
MB = $63.11
|
Most Recent Note - 3/18/2013 5:52:46 PM
Y - Still holding its ground perched near its 52-week high since completing a Secondary Offering on 3/05/13. Disciplined investors may watch for a volume-driven gain above the pivot point to trigger a technical buy signal before new buying efforts may be justified under the fact-based investment system.
>>> The latest Featured Stock Update with an annotated graph appeared on 3/7/2013. Click here.
View all notes |
Alert me of new notes |
CANSLIM.net Company Profile |
SEC |
Zacks Reports |
StockTalk |
News |
Chart |
Request a new note
C
A N
S L
I M
|
KORS
-
NYSE
Michael Kors Hldgs Ltd
RETAIL - Apparel Stores
|
$58.10
|
+0.72
1.25% |
$58.58
|
5,250,854
87.88% of 50 DAV
50 DAV is 5,975,100
|
$65.10
-10.75%
|
1/23/2013
|
$54.98
|
PP = $58.72
|
|
MB = $61.66
|
Most Recent Note - 3/13/2013 7:52:22 PM
Y - Color code is changed to yellow after rebounding above its 50 DMA line with today's volume-driven gain, improving its technical stance. Completed another Secondary Offering 2/20/13 while perched near its all-time high.
>>> The latest Featured Stock Update with an annotated graph appeared on 3/8/2013. Click here.
View all notes |
Alert me of new notes |
CANSLIM.net Company Profile |
SEC |
Zacks Reports |
StockTalk |
News |
Chart |
Request a new note
C
A N
S L
I M
|
LNKD
-
NYSE
Linkedin Corp Class A
INTERNET - Internet Information Providers
|
$174.28
|
-3.22
-1.81% |
$175.17
|
2,091,480
85.73% of 50 DAV
50 DAV is 2,439,500
|
$184.15
-5.36%
|
2/8/2013
|
$147.04
|
PP = $127.55
|
|
MB = $133.93
|
Most Recent Note - 3/14/2013 12:37:16 PM
G - Hit yet another new high with today's gain. Repeatedly noted - "Very extended from its prior base, but having rallied more than +20% in the first 2-3 weeks after its breakout, the investment system rules suggest holding such winners for a minimum of 8 weeks. See the latest FSU analysis for more details and a new annotated graph."
>>> The latest Featured Stock Update with an annotated graph appeared on 3/11/2013. Click here.
View all notes |
Alert me of new notes |
CANSLIM.net Company Profile |
SEC |
Zacks Reports |
StockTalk |
News |
Chart |
Request a new note
C
A N
S L
I M
|
LOPE
-
NASDAQ
Grand Canyon Education
DIVERSIFIED SERVICES - Education and; Training Services
|
$23.80
|
-0.23
-0.96% |
$24.04
|
247,988
53.06% of 50 DAV
50 DAV is 467,400
|
$27.18
-12.44%
|
2/20/2013
|
$26.44
|
PP = $25.10
|
|
MB = $26.36
|
Most Recent Note - 3/13/2013 7:49:45 PM
G - Consolidating near its 50 DMA line with volume totals cooling in recent weeks after it quickly negated the prior technical breakout. It has not formed a sound new base. See the latest FSU analysis for more details and a new annotated graph.
>>> The latest Featured Stock Update with an annotated graph appeared on 3/13/2013. Click here.
View all notes |
Alert me of new notes |
CANSLIM.net Company Profile |
SEC |
Zacks Reports |
StockTalk |
News |
Chart |
Request a new note
C
A N
S L
I M
|
MIDD
-
NASDAQ
Middleby Corp
MANUFACTURING - Diversified Machinery
|
$148.81
|
-1.18
-0.79% |
$149.99
|
88,427
95.91% of 50 DAV
50 DAV is 92,200
|
$154.74
-3.83%
|
10/8/2012
|
$118.46
|
PP = $122.67
|
|
MB = $128.80
|
Most Recent Note - 3/12/2013 1:52:24 PM
G - Still hovering near all-time highs today with volume totals cooling. Fundamental concerns were recently noted. Its 50 DMA line defines important near-term chart support.
>>> The latest Featured Stock Update with an annotated graph appeared on 2/25/2013. Click here.
View all notes |
Alert me of new notes |
CANSLIM.net Company Profile |
SEC |
Zacks Reports |
StockTalk |
News |
Chart |
Request a new note
C
A N
S L
I M
|
Symbol/Exchange
Company Name
Industry Group |
PRICE |
CHANGE
(%Change) |
Day High |
Volume
(% DAV)
(% 50 day avg vol) |
52 Wk Hi
% From Hi |
Featured
Date |
Price
Featured |
Pivot Featured |
|
Max Buy |
MRLN
-
NASDAQ
Marlin Business Services
DIVERSIFIED SERVICES - Rental and Leasing Services
|
$20.97
|
+0.01
0.05% |
$21.10
|
11,574
50.32% of 50 DAV
50 DAV is 23,000
|
$23.08
-9.14%
|
3/15/2013
|
$22.29
|
PP = $23.18
|
|
MB = $24.34
|
Most Recent Note - 3/18/2013 5:51:50 PM
Y - Held its ground today following Friday's "negative reversal" and worrisome loss on above average volume. It was highlighted in yellow with pivot point cited based on its 9/21/12 high plus 10 cents in the 3/15/13 mid-day report (read here) and noted - "Disciplined investors may watch for subsequent volume-driven gains above the pivot point to trigger a technical buy signal before action may be justified under the fact-based investment system. Found support near its 200 DMA line in recent months and now rallying within close striking distance of its 52-week high. Recent quarterly comparisons through Dec '12 show strong earnings increases satisfying the C criteria. Annual earnings (A criteria) growth has improved following the downturn in FY '08 and '09." See the latest FSU analysis for more details and a new annotated graph.
>>> The latest Featured Stock Update with an annotated graph appeared on 3/15/2013. Click here.
View all notes |
Alert me of new notes |
CANSLIM.net Company Profile |
SEC |
Zacks Reports |
StockTalk |
News |
Chart |
Request a new note
C
A N
S L
I M
|
MWIV
-
NASDAQ
M W I Veterinary Supply
HEALTH SERVICES - Medical Instruments and; Supplies
|
$131.31
|
+2.07
1.60% |
$135.14
|
83,823
144.52% of 50 DAV
50 DAV is 58,000
|
$137.18
-4.28%
|
3/4/2013
|
$130.90
|
PP = $129.45
|
|
MB = $135.92
|
Most Recent Note - 3/18/2013 3:26:52 PM
Y - Tallying a gain today after dipping below its pivot point late last week. Disciplined investors limit loses by selling if ever any stock fall more than -7% from their purchase price.
>>> The latest Featured Stock Update with an annotated graph appeared on 3/6/2013. Click here.
View all notes |
Alert me of new notes |
CANSLIM.net Company Profile |
SEC |
Zacks Reports |
StockTalk |
News |
Chart |
Request a new note
C
A N
S L
I M
|
N
-
NYSE
Netsuite Inc
DIVERSIFIED SERVICES - Business/Management Services
|
$75.81
|
-1.26
-1.63% |
$76.92
|
306,855
87.42% of 50 DAV
50 DAV is 351,000
|
$77.60
-2.31%
|
12/12/2012
|
$64.75
|
PP = $67.12
|
|
MB = $70.48
|
Most Recent Note - 3/15/2013 5:08:15 PM
G - Rose with above average volume today for another new 52-week and all-time high. Its 50 DMA line acted as support during the recent consolidation.
>>> The latest Featured Stock Update with an annotated graph appeared on 3/1/2013. Click here.
View all notes |
Alert me of new notes |
CANSLIM.net Company Profile |
SEC |
Zacks Reports |
StockTalk |
News |
Chart |
Request a new note
C
A N
S L
I M
|
NSR
-
NYSE
Neustar Inc
TELECOMMUNICATIONS - Diversified Communication Serv
|
$45.00
|
-0.09
-0.20% |
$45.37
|
309,006
70.12% of 50 DAV
50 DAV is 440,700
|
$47.24
-4.74%
|
3/8/2013
|
$44.99
|
PP = $47.34
|
|
MB = $49.71
|
Most Recent Note - 3/15/2013 3:52:25 PM
Y - Erased the prior session's gain today, retreating near its 50 DMA line. Volume-driven gains above the pivot point may trigger a new (or add-on) technical buy signal. The 2/21/13 low ($42.40) defines important near-term support where any subsequent deterioration would raise greater concerns and trigger a worrisome technical sell signal.
>>> The latest Featured Stock Update with an annotated graph appeared on 2/27/2013. Click here.
View all notes |
Alert me of new notes |
CANSLIM.net Company Profile |
SEC |
Zacks Reports |
StockTalk |
News |
Chart |
Request a new note
C
A N
S L
I M
|
SLCA
-
NYSE
U S Silica Holdings Inc
CHEMICALS - Specialty Chemicals
|
$22.76
|
+1.06
4.88% |
$23.25
|
4,628,485
560.69% of 50 DAV
50 DAV is 825,500
|
$28.50
-20.14%
|
2/26/2013
|
$22.23
|
PP = $21.50
|
|
MB = $22.58
|
Most Recent Note - 3/18/2013 3:25:01 PM
G - Tallying a volume-driven gain today. Halted its slide following a gap down on 3/14/13 after pricing a Secondary Offering while retreating on heavy volume after a spurt of volume-driven gains into new 52-week high territory. Previously noted - "Very extended from its prior base, but having rallied more than +20% in the first 2-3 weeks after its breakout, the investment system rules suggest holding such winners for a minimum of 8 weeks."
>>> The latest Featured Stock Update with an annotated graph appeared on 2/26/2013. Click here.
View all notes |
Alert me of new notes |
CANSLIM.net Company Profile |
SEC |
Zacks Reports |
StockTalk |
News |
Chart |
Request a new note
C
A N
S L
I M
|
Symbol/Exchange
Company Name
Industry Group |
PRICE |
CHANGE
(%Change) |
Day High |
Volume
(% DAV)
(% 50 day avg vol) |
52 Wk Hi
% From Hi |
Featured
Date |
Price
Featured |
Pivot Featured |
|
Max Buy |
VRX
-
NYSE
Valeant Pharmaceuticals
DRUGS - Drug Manufacturers - Other
|
$70.54
|
+0.68
0.97% |
$70.74
|
1,113,798
87.68% of 50 DAV
50 DAV is 1,270,300
|
$71.49
-1.33%
|
12/20/2012
|
$60.24
|
PP = $61.21
|
|
MB = $64.27
|
Most Recent Note - 3/12/2013 2:00:03 PM
Y - Wedged higher with recent gains lacking great volume conviction, and holding its ground stubbornly. A valid secondary buy point exists following the successful test of support at its 10-week moving average up to as high as +5% above the recent high ($67.98 plus 5% or $71.38). Color code was changed to yellow however no new pivot point was cited since a new base was not formed. The 50 DMA line and recent low ($64.05 on 2/21/13) define important support areas to watch.
>>> The latest Featured Stock Update with an annotated graph appeared on 3/12/2013. Click here.
View all notes |
Alert me of new notes |
CANSLIM.net Company Profile |
SEC |
Zacks Reports |
StockTalk |
News |
Chart |
Request a new note
C
A N
S L
I M
|
|
|
|
THESE ARE NOT BUY RECOMMENDATIONS!
Comments contained in the body of this report are technical
opinions only. The material herein has been obtained
from sources believed to be reliable and accurate, however,
its accuracy and completeness cannot be guaranteed.
This site is not an investment advisor, hence it does
not endorse or recommend any securities or other investments.
Any recommendation contained in this report may not
be suitable for all investors and it is not to be deemed
an offer or solicitation on our part with respect to
the purchase or sale of any securities. All trademarks,
service marks and trade names appearing in this report
are the property of their respective owners, and are
likewise used for identification purposes only.
This report is a service available
only to active Paid Premium Members.
You may opt-out of receiving report notifications
at any time. Questions or comments may be submitted
by writing to Premium Membership Services 665 S.E. 10 Street, Suite 201 Deerfield Beach, FL 33441-5634 or by calling 1-800-965-8307
or 954-785-1121.
|
|
|

