You are not logged in.
This means you
CAN ONLY VIEW reports that were published prior to Monday, February 26, 2024.
You
MUST UPGRADE YOUR MEMBERSHIP if you want to see any current reports.
AFTER MARKET UPDATE - TUESDAY, MARCH 17TH, 2020
Previous After Market Report Next After Market Report >>>
|
|
|
|
DOW |
+1,048.86 |
21,237.38 |
+5.20% |
|
Volume |
1,960,935,860 |
+4% |
|
Volume |
4,850,568,600 |
+6% |
|
NASDAQ |
+430.19 |
7,334.78 |
+6.23% |
|
Advancers |
1,695 |
59% |
|
Advancers |
2,215 |
67% |
|
S&P 500 |
+143.06 |
2,529.19 |
+6.00% |
|
Decliners |
1,174 |
41% |
|
Decliners |
1,102 |
33% |
|
Russell 2000 |
+69.27 |
1,106.68 |
+6.68% |
|
52 Wk Highs |
8 |
|
|
52 Wk Highs |
12 |
|
|
S&P 600 |
+40.70 |
670.06 |
+6.47% |
|
52 Wk Lows |
1,324 |
|
|
52 Wk Lows |
1,106 |
|
|
During market corrections it is especially important to reduce exposure, preserve your capital, and just be patient. Be safe! Historic studies have shown that the biggest up sessions have occurred during market corrections and bear markets.
Disciplined investors know to wait until a new confirmed rally marked by a solid follow-through day. The bold portion of the daily market commentary will note when that happens. For any clarification or additional help applying the fact-based investment system, we invite members to call, or contact us via the inquiry form.
|
 |
Major Indices Bounced Back Sharply Yet Again
Kenneth J. Gruneisen - Passed the CAN SLIM® Master's Exam
The Dow gained 1,048 points to 21,237, after briefly dipping below the 20,000 mark in early trading for the first time since 2017. The S&P 500 advanced 6.0%, while the Nasdaq Composite rallied 6.2%. Breadth was positive as advancers led decliners by a 4-3 margin on the NYSE and by 2-1 on the Nasdaq exchange. The reported volume totals were higher than the prior session totals on the NYSE and on the Nasdaq exchange. Leadership remained thin however there were 5 high-ranked companies from the Leaders List that hit a new 52-week high and were listed on the BreakOuts Page. New 52-week lows totals decisively outnumbered new 52-week highs totals on both the NYSE and on the Nasdaq exchange. The major indices' (M criteria) have been in a noted "market correction" and investors have been prompted since February 25th to reduce market exposure. Disciplined investors know to watch for a follow-through day of gains on higher volume to confirm a new market uptrend before initiating any new buying efforts. The Featured Stocks Page provides the most timely analysis on high-ranked leaders. Charts used courtesy of www.stockcharts.com
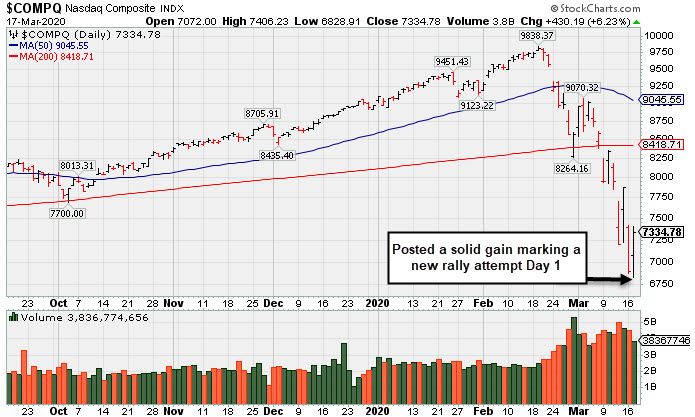
PICTURED: The Nasdaq Composite Index posted a solid gain Tuesday to finish -25.4% off the all-time high hit on 2/19/20. It precipitously fell, violating its 50 and 200-day moving average lines and sinking below the October 2019 low. U.S. equities finished the session broadly higher Tuesday, propelled by monetary and fiscal policy. The Federal Reserve announced that it would provide a commercial paper funding facility, which will extend credit to households and businesses facing distress. The late time the Fed implemented this action was during the 2008 financial crisis. Additionally, the Trump Administration is weighing a fiscal stimulus plan of more than $1 trillion that would provide direct payments to Americans in as little as two weeks.
All 11 S&P 500 sectors finished the session in positive territory, with traditionally defensive sectors pacing gains. The Utility sector jumped 13.1% to record its best day since 2008, while Consumer Staples also outperformed, with Clorox (CLX +13.27%) and Walmart (WMT +11.71%) posting big gains. Energy was the lone sector to gain less than 1% as WTI crude declined 5.9% to $27.02/barrel. Elsewhere, Regeneron Pharmaceuticals (REGN +11.54%) rose following the announcement that it has identified antibodies to treat COVID-19. Amazon (AMZN +7.03%) rose after announcing it will prioritize essential household and medical supplies with products coming into fulfillment centers for shipment.
On the data front, retail sales for February dipped 0.5%, disappointing consensus expectations for a 0.2% uptick. The declines were broad, with 9 out of the 13 categories posting a pullback. Meanwhile, treasuries sold off, with the yield on the 10-year note spiking 35 basis point to 1.09%.
|
 Kenneth J. Gruneisen started out as a licensed stockbroker in August 1987, a couple of months prior to the historic stock market crash that took the Dow Jones Industrial Average down -22.6% in a single day. He has published daily fact-based fundamental and technical analysis on high-ranked stocks online for two decades. Through FACTBASEDINVESTING.COM, Kenneth provides educational articles, news, market commentary, and other information regarding proven investment systems that work in good times and bad.
Comments contained in the body of this report are technical opinions only and are not necessarily those of Gruneisen Growth Corp. The material herein has been obtained from sources believed to be reliable and accurate, however, its accuracy and completeness cannot be guaranteed. Our firm, employees, and customers may effect transactions, including transactions contrary to any recommendation herein, or have positions in the securities mentioned herein or options with respect thereto. Any recommendation contained in this report may not be suitable for all investors and it is not to be deemed an offer or solicitation on our part with respect to the purchase or sale of any securities. |
|
 |
Gold & Silver Index Led Financial, Retail, and Tech Higher
Kenneth J. Gruneisen - Passed the CAN SLIM® Master's Exam
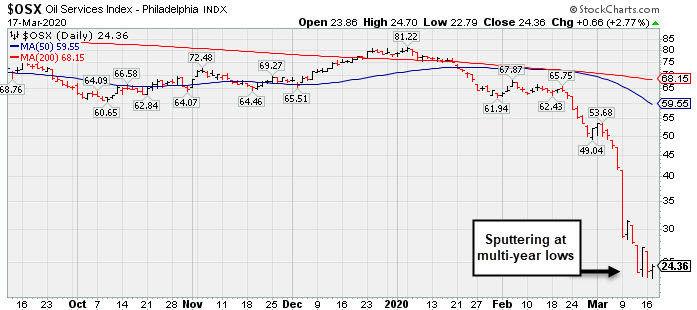
Energy-linked groups were mixed as the Oil Services Index ($OSX +2.77%) rose and the Integrated Oil Index ($XOI -1.07%) fell. The Gold & Silver Index ($XAU +13.06%) posted a standout gain. The Bank Index ($BKX +5.93%) and Broker/Dealer Index ($XBD +5.56%) posted solid gains along with the Retail Index ($RLX +6.05%). The tech sector was led by the Semiconductor Index ($SOX +9.84%) as the Networking Index ($NWX +4.15%) and the Biotech Index ($BTK +5.02%) also posted solid gains.
PICTURED: The Oil Services Index ($OSX +2.77%) is sputtering at multi-year lows.
| Oil Services |
$OSX |
24.36 |
+0.65 |
+2.74% |
-68.88% |
| Integrated Oil |
$XOI |
536.94 |
-5.81 |
-1.07% |
-57.74% |
| Semiconductor |
$SOX |
1,426.52 |
+127.74 |
+9.84% |
-22.87% |
| Networking |
$NWX |
404.89 |
+16.13 |
+4.15% |
-30.60% |
| Broker/Dealer |
$XBD |
208.52 |
+10.98 |
+5.56% |
-28.19% |
| Retail |
$RLX |
2,067.06 |
+117.91 |
+6.05% |
-15.61% |
| Gold & Silver |
$XAU |
85.00 |
+9.82 |
+13.06% |
-20.50% |
| Bank |
$BKX |
66.18 |
+3.71 |
+5.94% |
-41.62% |
| Biotech |
$BTK |
4,049.08 |
+193.41 |
+5.02% |
-20.10% |
|
|
|
 |
No Featured Stocks
Kenneth J. Gruneisen - Passed the CAN SLIM® Master's Exam
During extremely bearish markets the number of stocks covered in this area has sometimes been reduced to zero. We suggest making no excuses for weak stocks in weak markets. Feel free to contact us if you have a need for any additional information. |
|
|
Color Codes Explained :
Y - Better candidates highlighted by our
staff of experts.
G - Previously featured
in past reports as yellow but may no longer be buyable under the
guidelines.
***Last / Change / Volume data in this table is the closing quote data***
|
|
|
THESE ARE NOT BUY RECOMMENDATIONS!
Comments contained in the body of this report are technical
opinions only. The material herein has been obtained
from sources believed to be reliable and accurate, however,
its accuracy and completeness cannot be guaranteed.
This site is not an investment advisor, hence it does
not endorse or recommend any securities or other investments.
Any recommendation contained in this report may not
be suitable for all investors and it is not to be deemed
an offer or solicitation on our part with respect to
the purchase or sale of any securities. All trademarks,
service marks and trade names appearing in this report
are the property of their respective owners, and are
likewise used for identification purposes only.
This report is a service available
only to active Paid Premium Members.
You may opt-out of receiving report notifications
at any time. Questions or comments may be submitted
by writing to Premium Membership Services 665 S.E. 10 Street, Suite 201 Deerfield Beach, FL 33441-5634 or by calling 1-800-965-8307
or 954-785-1121.
|
|
|