You are not logged in.
This means you
CAN ONLY VIEW reports that were published prior to Monday, April 21, 2025.
You
MUST UPGRADE YOUR MEMBERSHIP if you want to see any current reports.
AFTER MARKET UPDATE - TUESDAY, MARCH 16TH, 2010
Previous After Market Report Next After Market Report >>>
|
|
|
|
DOW |
+43.83 |
10,685.98 |
+0.41% |
|
Volume |
1,017,922,580 |
+10% |
|
Volume |
2,164,684,180 |
+13% |
|
NASDAQ |
+15.80 |
2,378.01 |
+0.67% |
|
Advancers |
2,204 |
70% |
|
Advancers |
1,714 |
60% |
|
S&P 500 |
+8.95 |
1,159.46 |
+0.78% |
|
Decliners |
807 |
26% |
|
Decliners |
1,024 |
36% |
|
Russell 2000 |
+5.17 |
679.58 |
+0.77% |
|
52 Wk Highs |
404 |
|
|
52 Wk Highs |
197 |
|
|
S&P 600 |
+2.73 |
360.89 |
+0.76% |
|
52 Wk Lows |
2 |
|
|
52 Wk Lows |
8 |
|
|
 |
Indices Rise After Fed Holds Rates Steady
Kenneth J. Gruneisen - Passed the CAN SLIM® Master's Exam
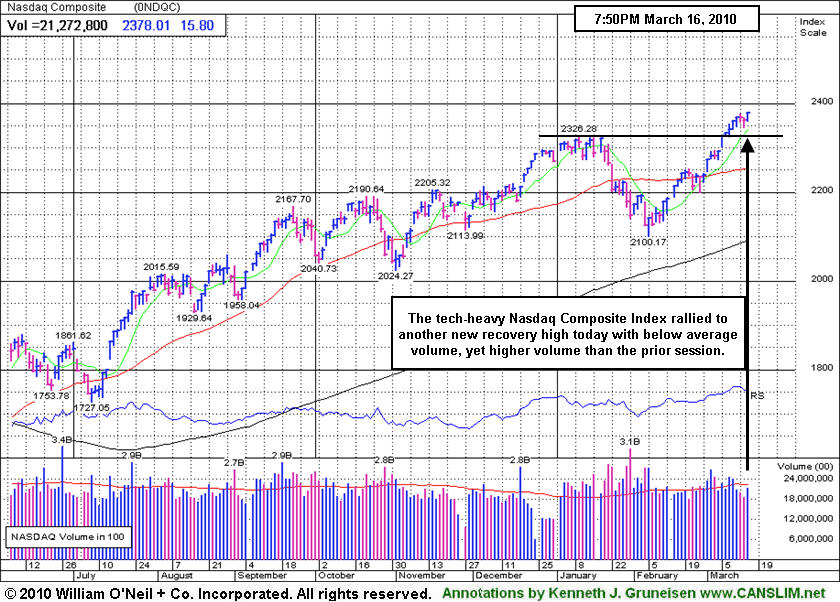
The major averages ended unanimously higher on Tuesday after the Federal Reserve held rates steady, as expected, and largely reiterate its comments from its last meeting about the state of the economy. Volume totals were below average but rose compared to the prior session on the NYSE and Nasdaq exchange, suggesting that institutional investors were timidly accumulating stocks. Advancers led decliners by more than a 2-to-1 ratio on the NYSE and more than 3-to-2 ratio on the Nasdaq exchange. There were 54 high-ranked companies from the CANSLIM.net Leaders List that made a new 52-week high and appeared on the CANSLIM.net BreakOuts Page, up from the 43 issues that appeared on the prior session. New 52-week highs again overwhelmingly trumped new lows on both exchanges.
The February housing starts were reported slightly better than expected, even though starts declined 5.9% from January. Prices of goods imported into the U.S. in February fell more than forecast, signaling there is mild inflationary pressure coming from abroad. Health care stocks overcame modest pressure after House Speaker Nancy Pelosi said there will be enough votes in the House to pass health care reform. Meanwhile, European markets advanced as European leaders worked out a plan for emergency aid to Greece if needed. Meanwhile, oil prices climbed +2.4% to $81.70 per barrel. Weekly oil inventory data is due Wednesday morning.
Looking at the market, since the March 1, follow-through-day (FTD) the market and a batch of leading stocks steadily rallied. The fact that we have not seen any serious distribution days since the FTD bodes well for this nascent rally. It is also a welcome sign to see the market continue to improve as investors digest the latest round of stronger than expected economic and earnings data.Remember that now that a new rally has been confirmed, the window is open to start buying high quality breakouts. Trade accordingly.
PICTURED: The Nasdaq Composite Index rallied to yet another recovery high as volume increased from the prior session total yet remained below average.
|
 Kenneth J. Gruneisen started out as a licensed stockbroker in August 1987, a couple of months prior to the historic stock market crash that took the Dow Jones Industrial Average down -22.6% in a single day. He has published daily fact-based fundamental and technical analysis on high-ranked stocks online for two decades. Through FACTBASEDINVESTING.COM, Kenneth provides educational articles, news, market commentary, and other information regarding proven investment systems that work in good times and bad.
Comments contained in the body of this report are technical opinions only and are not necessarily those of Gruneisen Growth Corp. The material herein has been obtained from sources believed to be reliable and accurate, however, its accuracy and completeness cannot be guaranteed. Our firm, employees, and customers may effect transactions, including transactions contrary to any recommendation herein, or have positions in the securities mentioned herein or options with respect thereto. Any recommendation contained in this report may not be suitable for all investors and it is not to be deemed an offer or solicitation on our part with respect to the purchase or sale of any securities. |
|
 |
Financial, Retail, Tech, and Defensive Groups Post Widespread Gains
Kenneth J. Gruneisen - Passed the CAN SLIM® Master's Exam
While the Fed key interest rates unchanged near historic lows on Wednesday the Bank Index ($BKX +1.68%) and Broker/Dealer Index ($XBD +1.08%) were among the important and very influential industry indexes underpinning the major averages' gains. The Retail Index ($RLX +0.43%) continued its winning streak for new recovery highs with its 5th consecutive gain. The Semiconductor Index ($SOX +2.69%) was a standout gainer in the tech sector while the Internet Index ($IIX +0.54%) and Networking Index ($NWX +0.86%) posted smaller gains and the Biotechnology Index ($BTK -1.39%) was the lone decliner. Defensive groups also were on the rise as the Healthcare Index ($HMO +1.63%) posted a gain, and strength in energy-related shares boosted the Oil Services Index ($OSX +1.69%) and Integrated Oil Index ($XOI +1.19%).
Charts courtesy www.stockcharts.com
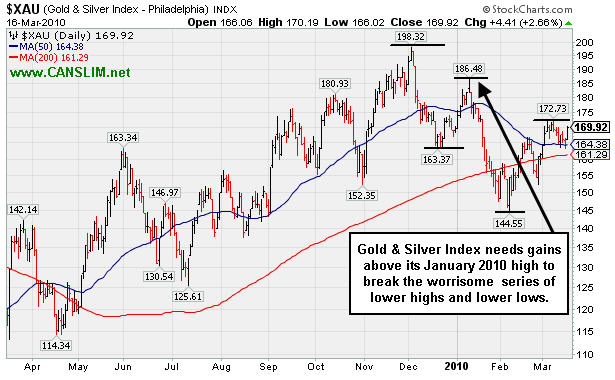
PICTURED: The Gold & Silver Index ($XAU +2.66%) posted a big gain, yet it needs gains above its January 2010 highs to break the worrisome series of lower highs and lower lows. The XAU held its ground at its 50-day moving average (DMA) line and well above its 200 DMA line during its current consolidation off its $172.73 March peak.
| Oil Services |
$OSX |
213.74 |
+3.55 |
+1.69% |
+9.66% |
| Healthcare |
$HMO |
1,497.36 |
+23.95 |
+1.63% |
+1.66% |
| Integrated Oil |
$XOI |
1,079.31 |
+12.66 |
+1.19% |
+1.04% |
| Semiconductor |
$SOX |
359.87 |
+9.44 |
+2.69% |
-0.01% |
| Networking |
$NWX |
258.62 |
+2.21 |
+0.86% |
+11.93% |
| Internet |
$IIX |
246.97 |
+1.32 |
+0.54% |
+5.61% |
| Broker/Dealer |
$XBD |
119.53 |
+1.28 |
+1.08% |
+3.89% |
| Retail |
$RLX |
446.04 |
+1.92 |
+0.43% |
+8.49% |
| Gold & Silver |
$XAU |
169.92 |
+4.41 |
+2.66% |
+0.99% |
| Bank |
$BKX |
51.41 |
+0.85 |
+1.68% |
+20.37% |
| Biotech |
$BTK |
1,222.17 |
-17.29 |
-1.39% |
+29.72% |
|
|
|
 |
Quiet Consolidation After Wedging To New All-Time Highs
Kenneth J. Gruneisen - Passed the CAN SLIM® Master's Exam
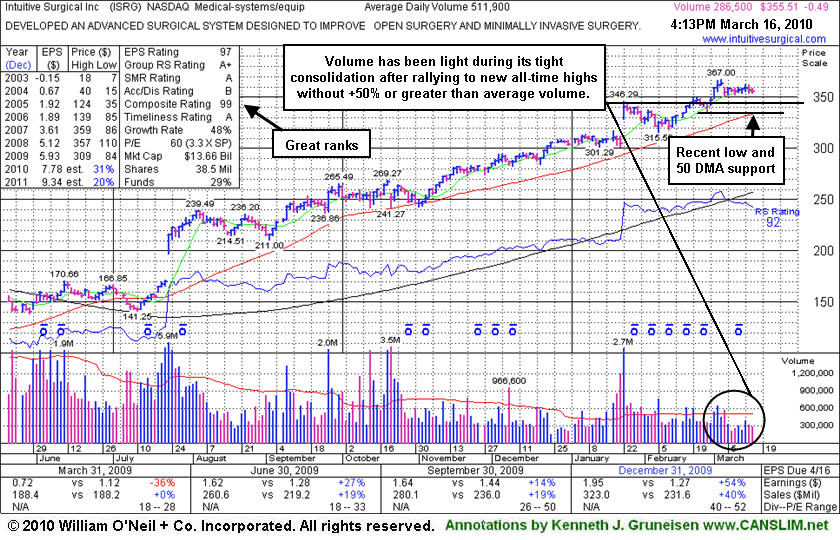
Intuitive Surgical Inc. (ISRG -$0.49 or -0.14% to $355.51) ended with a small loss today on light volume, quietly hovering near its all-time high. The stock has barely encountered any distributional pressure, and its current Up/Down Volume Ratio of 1.5 provides an unbiased bullish statistic concerning its recent price/volume pattern. However, as the daily graph below shows, volume has been light during its tight consolidation after recently rallying to new all-time highs without greater than +50% above average volume. When a weekly chart was shown in its last FSU section appearance on 2/24/10 under the headline "Down Weeks On Volume Have Been Rare In This Strong Example" it was then observed, "ISRG may be on course for its all-time high ($359 in 2007)." It made it there without triggering any technical buy signal, however. In the event of a pullback, its prior chart highs in the $346 area are an initial support level to watch, while its 50-day moving average ($333.77) line and its 2/25/10 low ($335.27) help define the next very important support level. Subsequent gains into new high territory would have more serious bullish implications if volume swells substantially.
The number of top-rated funds owning its shares has risen from 283 in Mar '09 to 311 in Dec '09, which is reassuring concerning the investment system's I criteria. ISRG was featured again most recently in the 1/22/10 mid-day report (read here), returning after some time off the Featured Stocks list. Its annual earnings history (the A criteria) has been very impressive. Quarterly comparisons have not shown perfectly steady increases above the +25% guideline, yet the latest period ended December 31, 2009 showed a very impressive acceleration in sales revenues and earnings growth. It is due to report its next quarterly results on April 15th after the close.
Earlier notes had outlined technical deterioration before and when it was last dropped from the Featured Stocks list on 6/10/08. ISRG traded up more than 13-fold since first featured in yellow in CANSLIM.net reports in the summer of 2004.
|
|
|
Color Codes Explained :
Y - Better candidates highlighted by our
staff of experts.
G - Previously featured
in past reports as yellow but may no longer be buyable under the
guidelines.
***Last / Change / Volume quote data in this table corresponds with the timestamp on the note***
Symbol/Exchange
Company Name
Industry Group |
Last |
Chg. |
Vol
% DAV |
Date Featured |
Price Featured |
Latest Pivot Point
Featured |
Status |
| Latest Max Buy Price |
ARUN
- NASDAQ
Aruba Networks Inc
COMPUTER HARDWARE - Networking & Communication Dev
|
$13.02
|
+0.06
|
1,194,580
81% DAV
1,476,600
|
2/19/2010
(Date
Featured) |
$12.71
(Price
Featured) |
PP = $11.94 |
G |
| MB = $12.54 |
Most Recent Note - 3/16/2010 4:45:54 PM
G - Small gain today on light volume, consolidating after recent gains on high volume. It is extended from its prior base, and support to watch is now defined by prior chart highs and its 50 DMA line.
>>> The latest Featured Stock Update with an annotated graph appeared on 3/11/2010. click here.
|
|
C
A
S
I |
News |
Chart |
SEC
View all notes Alert
me of new notes
Company
Profile
|
BIDU
- NASDAQ
Baidu Inc Ads
INTERNET - Internet Information Providers
|
$573.16
|
-3.68
|
2,431,150
118% DAV
2,059,600
|
1/13/2010
(Date
Featured) |
$431.25
(Price
Featured) |
PP = $426.75 |
G |
| MB = $448.09 |
Most Recent Note - 3/16/2010 4:53:23 PM
G - Held its ground admirably today after a close in the lower half of its intra-day range on 3/15/10 following a considerable gap up gain with heavy volume. It is very extended from any sound base.
>>> The latest Featured Stock Update with an annotated graph appeared on 3/4/2010. click here.
|
|
C
A
S
I |
News |
Chart |
SEC
View all notes Alert
me of new notes
Company
Profile
|
BRLI
- NASDAQ
Bio Reference Labs Inc
HEALTH SERVICES - Medical Laboratories & Researc
|
$44.07
|
-0.30
|
59,080
60% DAV
98,400
|
2/12/2010
(Date
Featured) |
$39.02
(Price
Featured) |
PP = $40.97 |
G |
| MB = $43.02 |
Most Recent Note - 3/16/2010 5:00:57 PM
G - Down today for a third consecutive loss on even lighter volume following a negative reversal on 3/12/10. It is extended from its prior base, and prior chart highs and its 50 DMA line now coincide in the $40 area defining important support to watch.
>>> The latest Featured Stock Update with an annotated graph appeared on 3/1/2010. click here.
|
|
C
A
S
I |
News |
Chart |
SEC
View all notes Alert
me of new notes
Company
Profile
|
CACC
- NASDAQ
Credit Acceptance Corp
FINANCIAL SERVICES - Credit Services
|
$43.05
|
+0.05
|
27,622
N/A
|
9/29/2009
(Date
Featured) |
$33.48
(Price
Featured) |
PP = $37.10 |
|
| MB = $38.96 |
Most Recent Note - 3/16/2010
Small gain on light volume today, remaining below its 50 DMA line which has recently acted as resistance. It needs gains above that important short-term average for its outlook to improve. Based on weak action it will be dropped from the Featured Stocks list tonight. Recent lows in the $38 area are a nearby chart support level to watch.
>>> The latest Featured Stock Update with an annotated graph appeared on 3/2/2010. click here.
|
|
C
A
S
I |
News |
Chart |
SEC
View all notes Alert
me of new notes
Company
Profile
|
CISG
- NASDAQ
Cninsure Inc Ads
INSURANCE - Insurance Brokers
|
$25.07
|
-0.33
|
289,210
135% DAV
215,000
|
3/3/2010
(Date
Featured) |
$24.38
(Price
Featured) |
PP = $23.10 |
G |
| MB = $24.26 |
Most Recent Note - 3/16/2010 5:13:49 PM
G - Small loss today on above average volume, yet it is still stubbornly holding its ground while perched near its 52-week high. No overhead supply remains to act as resistance. It rose from a 20-week double bottom base with 8 times average volume as it was featured in the 3/03/10 mid-day report (read here).
>>> The latest Featured Stock Update with an annotated graph appeared on 3/3/2010. click here.
|
|
C
A
S
I |
News |
Chart |
SEC
View all notes Alert
me of new notes
Company
Profile
|
CRM
- NYSE
Salesforce.com Inc
INTERNET - Internet Software & Services
|
$76.69
|
+1.09
|
1,972,239
98% DAV
2,019,400
|
3/5/2010
(Date
Featured) |
$72.28
(Price
Featured) |
PP = $75.53 |
Y |
| MB = $79.31 |
Most Recent Note - 3/16/2010 5:32:24 PM
Y - Gain today with average volume, rallying above its pivot point to a new all-time high. Wedging higher, rising from a 9-week base without the required volume to trigger a proper technical buy signal. Its 50 DMA line and recent chart low ($64.77 on 2/25/10) define important support.
>>> The latest Featured Stock Update with an annotated graph appeared on 3/5/2010. click here.
|
|
C
A
S
I |
News |
Chart |
SEC
View all notes Alert
me of new notes
Company
Profile
|
CTRP
- NASDAQ
Ctrip.com Intl Ltd Adr
LEISURE - Resorts & Casinos
|
$37.21
|
-0.76
|
1,618,780
75% DAV
2,159,900
|
3/1/2010
(Date
Featured) |
$38.23
(Price
Featured) |
PP = $38.50 |
Y |
| MB = $40.43 |
Most Recent Note - 3/16/2010 5:33:27 PM
Y - Down today for a 4th consecutive loss on lighter than average volume, slumping below its pivot point. Completed an offering of additional shares on 3/03/10, shortly after featured in the March 2010 issue of CANSLIM.net News (read here). A gain above its pivot point or its most recent chart highs is still needed to confirm a fresh technical buy signal with +50% above average volume or more.
>>> The latest Featured Stock Update with an annotated graph appeared on 2/28/2010. click here.
|
|
C
A
S
I |
News |
Chart |
SEC
View all notes Alert
me of new notes
Company
Profile
|
EZPW
- NASDAQ
Ezcorp Inc Cl A
SPECIALTY RETAIL - Specialty Retail, Other
|
$20.49
|
+0.09
|
862,011
164% DAV
525,100
|
2/19/2010
(Date
Featured) |
$19.03
(Price
Featured) |
PP = $18.80 |
G |
| MB = $19.74 |
Most Recent Note - 3/16/2010 5:36:21 PM
G - Positively reversal today after a gap down was an encouraging sign of support following its considerable loss on 3/15/10 with volume nearly 4 times average. Distributional pressure came after getting very extended from any sound base of support. Prior chart highs in the $18 area and its 50 DMA line define an important support level to watch.
>>> The latest Featured Stock Update with an annotated graph appeared on 3/8/2010. click here.
|
|
C
A
S
I |
News |
Chart |
SEC
View all notes Alert
me of new notes
Company
Profile
|
GMCR
- NASDAQ
Green Mtn Coffee Roastrs
FOOD & BEVERAGE - Processed & Packaged Goods
|
$93.93
|
+0.84
|
739,920
55% DAV
1,333,300
|
2/26/2010
(Date
Featured) |
$84.39
(Price
Featured) |
PP = $88.75 |
G |
| MB = $93.19 |
Most Recent Note - 3/16/2010 5:41:14 PM
G - Posted a 5th consecutive gain with lighter than average volume today, edging above its max buy level. Color code is changed to green. It has been wedging up to new all-time highs with light volume gains since its high volume gain on 3/08/10 triggered a new technical buy signal. Initial support to watch now would be prior chart highs in the $86-88 area.
>>> The latest Featured Stock Update with an annotated graph appeared on 3/12/2010. click here.
|
|
C
A
S
I |
News |
Chart |
SEC
View all notes Alert
me of new notes
Company
Profile
|
ISRG
- NASDAQ
Intuitive Surgical Inc
HEALTH SERVICES - Medical Appliances & Equipment
|
$355.51
|
-0.49
|
288,749
56% DAV
511,900
|
1/22/2010
(Date
Featured) |
$340.40
(Price
Featured) |
PP = $314.00 |
G |
| MB = $329.70 |
Most Recent Note - 3/16/2010 5:59:40 PM
G - Second consecutive small loss today, continuing its consolidation in a tight range on very light volume near all-time highs. It has not triggered a sound technical buy signal in recent weeks, meanwhile prior chart highs near $346 are an initial support level to watch.
>>> The latest Featured Stock Update with an annotated graph appeared on 3/16/2010. click here.
|
|
C
A
S
I |
News |
Chart |
SEC
View all notes Alert
me of new notes
Company
Profile
|
PCLN
- NASDAQ
Priceline.com Inc
INTERNET - Internet Software & Services
|
$399.55
|
-4.72
|
584,812
N/A
|
11/1/2002
(Date
Featured) |
$399.55
(Price
Featured) |
PP = $428.20 |
Y |
| MB = $449.61 |
Most Recent Note - 1/2/2011
Y - Returns to Featured Stocks list with its appearance in the January 2011 CANSLIM.net News including detailed analysis and annotated daily and weekly graphs.
>>> The latest Featured Stock Update with an annotated graph appeared on 3/10/2010. click here.
|
|
C
A
S
I |
News |
Chart |
SEC
View all notes Alert
me of new notes
Company
Profile
|
PEGA
- NASDAQ
Pegasystems Inc
COMPUTER SOFTWARE & SERVICES - Business Software & Services
|
$39.20
|
-0.10
|
276,052
128% DAV
216,500
|
2/26/2010
(Date
Featured) |
$36.00
(Price
Featured) |
PP = $38.55 |
Y |
| MB = $40.48 |
Most Recent Note - 3/16/2010 6:13:57 PM
Y - Held its ground today after a gap up and considerable gain on 3/15/10 triggered a technical buy signal as it rallied with more than 3 times average volume to a new 52-week high above its pivot point. The bullish action came after announcing plans to buy Chordiant Software Inc (CHRD), a firm with sub par fundamentals under the investment system guidelines. Recently found support at its 50 DMA line, while prior chart lows in the $32 area are the next support level.
>>> The latest Featured Stock Update with an annotated graph appeared on 3/15/2010. click here.
|
|
C
A
S
I |
News |
Chart |
SEC
View all notes Alert
me of new notes
Company
Profile
|
ROVI
- NASDAQ
Rovi Corp
COMPUTER SOFTWARE & SERVICES - Security Software & Services
|
$37.55
|
-0.28
|
1,327,579
99% DAV
1,340,800
|
2/25/2010
(Date
Featured) |
$33.54
(Price
Featured) |
PP = $34.87 |
G |
| MB = $36.61 |
Most Recent Note - 3/16/2010 6:15:03 PM
G - Small loss today on average volume capped a streak of 8 consecutive gains. Prior chart highs in the $34 area define an important support level to watch on pullbacks.
>>> The latest Featured Stock Update with an annotated graph appeared on 2/25/2010. click here.
|
|
C
A
S
I |
News |
Chart |
SEC
View all notes Alert
me of new notes
Company
Profile
|
SIRO
- NASDAQ
Sirona Dental Systems
HEALTH SERVICES - Medical Instruments & Supplies
|
$37.34
|
-0.11
|
336,605
58% DAV
576,600
|
2/16/2010
(Date
Featured) |
$36.43
(Price
Featured) |
PP = $36.15 |
Y |
| MB = $37.96 |
Most Recent Note - 3/16/2010 6:16:16 PM
Y - Small loss today on light volume, hovering below its max buy level. Prior chart highs and its 50 DMA line in the $35-36 area define important support to watch.
>>> The latest Featured Stock Update with an annotated graph appeared on 3/9/2010. click here.
|
|
C
A
S
I |
News |
Chart |
SEC
View all notes Alert
me of new notes
Company
Profile
|
ULTA
- NASDAQ
Ulta Salon Cosm & Frag
SPECIALTY RETAIL - Specialty Retail, Other
|
$22.86
|
+0.75
|
528,637
133% DAV
397,100
|
3/12/2010
(Date
Featured) |
$22.81
(Price
Featured) |
PP = $21.72 |
Y |
| MB = $22.81 |
Most Recent Note - 3/16/2010 6:18:24 PM
Y - Gain today for its second best close of 2010. Found prompt support following a loss on 3/15/10 after an analyst downgrade. Prior chart highs in the $21 area now define a very important technical support level. A detailed Stock Bulletin with annotated graph was published soon after it was featured in the 3/12/10 mid-day report.
>>> The latest Featured Stock Update with an annotated graph appeared on 3/12/2010. click here.
|
|
C
A
S
I |
News |
Chart |
SEC
View all notes Alert
me of new notes
Company
Profile
|
VPRT
- NASDAQ
Vistaprint Nv
DIVERSIFIED SERVICES - Business/Management Services
|
$59.94
|
-0.06
|
314,838
63% DAV
497,800
|
3/1/2010
(Date
Featured) |
$57.72
(Price
Featured) |
PP = $59.70 |
Y |
| MB = $62.69 |
Most Recent Note - 3/16/2010 6:19:48 PM
Y - Today was its 5th consecutive small loss with light or average volume. Consolidating only -4.5% from its 3/09/10 all-time high now, it did not yet trigger a technical buy signal since featured in the March 2010 CANSLIM.net News monthly newsletter (read here). As previously noted, "Its gain on 3/02/10 was below the volume guidelines for buyable breakouts under the investment system."
>>> The latest Featured Stock Update with an annotated graph appeared on 2/28/2010. click here.
|
|
C
A
S
I |
News |
Chart |
SEC
View all notes Alert
me of new notes
Company
Profile
|
|
|
|
THESE ARE NOT BUY RECOMMENDATIONS!
Comments contained in the body of this report are technical
opinions only. The material herein has been obtained
from sources believed to be reliable and accurate, however,
its accuracy and completeness cannot be guaranteed.
This site is not an investment advisor, hence it does
not endorse or recommend any securities or other investments.
Any recommendation contained in this report may not
be suitable for all investors and it is not to be deemed
an offer or solicitation on our part with respect to
the purchase or sale of any securities. All trademarks,
service marks and trade names appearing in this report
are the property of their respective owners, and are
likewise used for identification purposes only.
This report is a service available
only to active Paid Premium Members.
You may opt-out of receiving report notifications
at any time. Questions or comments may be submitted
by writing to Premium Membership Services 665 S.E. 10 Street, Suite 201 Deerfield Beach, FL 33441-5634 or by calling 1-800-965-8307
or 954-785-1121.
|
|
|

