You are not logged in.
This means you
CAN ONLY VIEW reports that were published prior to Monday, April 14, 2025.
You
MUST UPGRADE YOUR MEMBERSHIP if you want to see any current reports.
AFTER MARKET UPDATE - FRIDAY, MARCH 15TH, 2013
Previous After Market Report Next After Market Report >>>
|
|
|
|
DOW |
-25.03 |
14,514.11 |
-0.17% |
|
Volume |
1,825,144,520 |
+170% |
|
Volume |
2,128,094,420 |
+33% |
|
NASDAQ |
-9.86 |
3,249.07 |
-0.30% |
|
Advancers |
1,408 |
45% |
|
Advancers |
1,093 |
43% |
|
S&P 500 |
-2.53 |
1,560.70 |
-0.16% |
|
Decliners |
1,611 |
52% |
|
Decliners |
1,371 |
54% |
|
Russell 2000 |
-0.59 |
952.48 |
-0.06% |
|
52 Wk Highs |
347 |
|
|
52 Wk Highs |
224 |
|
|
S&P 600 |
+0.06 |
531.73 |
+0.01% |
|
52 Wk Lows |
32 |
|
|
52 Wk Lows |
14 |
|
|
 |
Indices Fell and Dow's Winning Streak Ended After 10 Days
Kenneth J. Gruneisen - Passed the CAN SLIM® Master's Exam
For the week, the Nasdaq Composite Index advanced +0.1% as the S&P 500 Index rose +0.6% and the Dow Jones Industrial Average posted a gain of +0.8%. Friday's slightly negative session had much higher volume totals reported versus the prior session totals on the NYSE and on the Nasdaq exchange, inflated by options expirations. Breadth was slanted to the negative side as decliners led advancers by an 8-7 margin on the NYSE and by a 6-5 margin on the Nasdaq exchange. The total number of stocks hitting new 52-week highs still easily outnumbered new 52-week lows on the NYSE and on the Nasdaq exchange. There were 89 high-ranked companies from the CANSLIM.net Leaders List making new 52-week highs and appearing on the CANSLIM.net BreakOuts Page, down from the prior session's total of 100 stocks. There were gains for only 3 of the 16 high-ranked companies currently included on the Featured Stocks Page.

The major averages ended lower, albeit off of their worst levels Friday. Stocks were lower from the opening bell as investors took a breath from the recent strong gains in equities. A batch of mixed economic reports had little impact in the session.
Six of the 10 sectors on the S&P ended lower, led by declines in consumer stocks including Wal-Mart Stores Inc (WMT +0.98%) and Target Corp (TGT -0.80%). On the earnings front, teen retailer Aeropostale Inc (ARO -5.24%) following the company's fourth-quarter profit tally.
Turning to fixed income markets, Treasuries were higher along the curve with the benchmark 10-year note up 11/32 to yield 1.99%.
New buying efforts are justified under the fact-based system since a follow-through day on 3/05/13 shifted the market's (M criteria) direction to a confirmed rally again after a brief correction. Any sustainable rally requires a healthy crop of companies hitting new 52-week highs, so it is always essential to see meaningful leadership (stocks hitting new 52-week highs).
Watch for an announcement via email concerning the next WEBCAST. The webcast will also be available via an updated link highlighted at the top of the Premium Member Homepage.
PICTURED: The Dow Jones Industrial Average's loss on heavy volume broke a streak of 10 consecutive gains into new all-time high territory, its longest winning streak since 1996.
|
 Kenneth J. Gruneisen started out as a licensed stockbroker in August 1987, a couple of months prior to the historic stock market crash that took the Dow Jones Industrial Average down -22.6% in a single day. He has published daily fact-based fundamental and technical analysis on high-ranked stocks online for two decades. Through FACTBASEDINVESTING.COM, Kenneth provides educational articles, news, market commentary, and other information regarding proven investment systems that work in good times and bad.
Comments contained in the body of this report are technical opinions only and are not necessarily those of Gruneisen Growth Corp. The material herein has been obtained from sources believed to be reliable and accurate, however, its accuracy and completeness cannot be guaranteed. Our firm, employees, and customers may effect transactions, including transactions contrary to any recommendation herein, or have positions in the securities mentioned herein or options with respect thereto. Any recommendation contained in this report may not be suitable for all investors and it is not to be deemed an offer or solicitation on our part with respect to the purchase or sale of any securities. |
|
 |
Gains for Retail and Bank Index Partially Offset Other Weak Groups
Kenneth J. Gruneisen - Passed the CAN SLIM® Master's Exam
The Retail Index ($RLX +0.82%) was among Friday's best gainers helping the major averages offset other weakness. The Bank Index ($BKX +0.44%) also posted a small gain while the Broker/Dealer Index ($XBD -0.17%) edged lower. The tech sector had a negative bias as the Semiconductor Index ($SOX -1.66%) led the declines followed by losses for the Internet Index ($IIX -0.82%), Biotechnology Index ($BTK -0.73%), and the Networking Index ($NWX -0.24%). The Oil Services Index ($OSX +0.76%) and the Gold & Silver Index ($XAU +0.37%) posted small gains while the Integrated Oil Index ($XOI -0.15%) and the Healthcare Index ($HMO +0.09%) finished flat.
Charts courtesy www.stockcharts.com
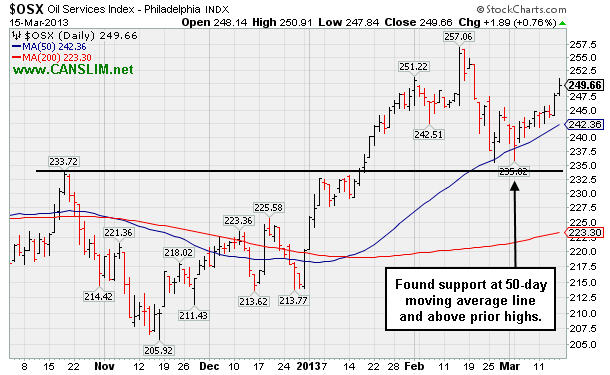
PICTURED: The Oil Services Index ($OSX +0.76%) found support above its 50-day moving average (DMA) line and above prior highs during its recent consolidation.
| Oil Services |
$OSX |
249.66 |
+1.89 |
+0.76% |
+13.40% |
| Healthcare |
$HMO |
2,789.39 |
+2.44 |
+0.09% |
+10.95% |
| Integrated Oil |
$XOI |
1,360.92 |
-2.02 |
-0.15% |
+9.59% |
| Semiconductor |
$SOX |
434.18 |
-7.35 |
-1.66% |
+13.05% |
| Networking |
$NWX |
241.61 |
-0.58 |
-0.24% |
+6.65% |
| Internet |
$IIX |
364.75 |
-3.02 |
-0.82% |
+11.54% |
| Broker/Dealer |
$XBD |
111.00 |
-0.18 |
-0.17% |
+17.67% |
| Retail |
$RLX |
719.88 |
+5.83 |
+0.82% |
+10.23% |
| Gold & Silver |
$XAU |
134.46 |
+0.50 |
+0.37% |
-18.80% |
| Bank |
$BKX |
57.52 |
+0.25 |
+0.44% |
+12.17% |
| Biotech |
$BTK |
1,798.12 |
-13.27 |
-0.73% |
+16.23% |
|
|
|
 |
Worrisome Negative Reversal After Strong Start Challenging Highs
Kenneth J. Gruneisen - Passed the CAN SLIM® Master's Exam
Often, when a leading stock is setting up to breakout of a solid base it is highlighted in CANSLIM.net's Mid-Day Breakouts Report. The most relevant factors are noted in the report which alerts prudent CANSLIM oriented investors to place the issue in their watch list. After doing any necessary backup research, the investor is prepared to act after the stock triggers a technical buy signal (breaks above its pivot point on more than +50% average turnover) but before it gets too extended from a sound base. In the event the stock fails to trigger a technical buy signal and its price declines then it will simply be removed from the watch list. Disciplined investors know to buy as near as possible to the pivot point and avoid chasing stocks after they have rallied more than +5% above their pivot point. It is crucial to always limit losses whenever any stock heads the wrong direction, and disciplined investors sell if a struggling stock ever falls more than -7% from their purchase price.
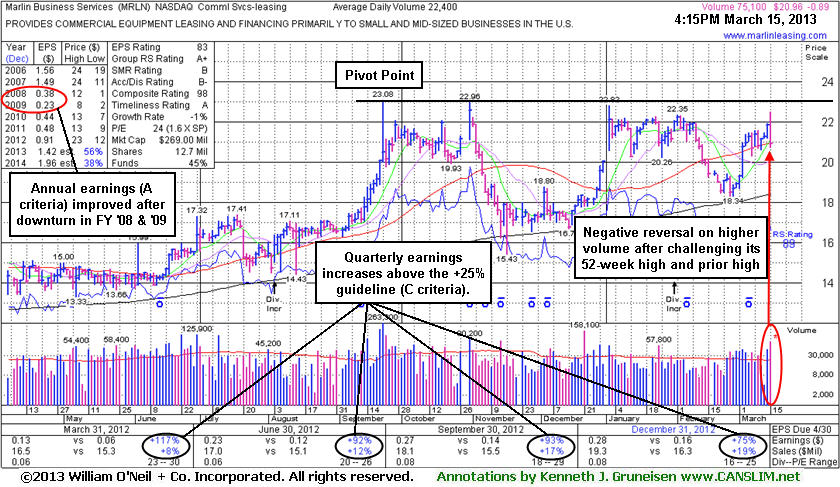
Marlin Business Services (MRLN -$0.89 or -4.07% to $20.96) was highlighted in yellow with pivot point cited based on its 9/21/12 high plus 10 cents in the earlier mid-day report (read here). It erased early gains for a "negative reversal" and worrisome loss on above average volume. Disciplined investors know that there is no advantage to getting in "early" before a technical breakout proves that fresh institutional buying demand is lurking. Watch for for it to make a stand and produce subsequent volume-driven gains for new high (N criteria) above the pivot point to trigger a technical buy signal before action may be justified under the fact-based investment system. It found support near its 200-day moving average (DMA) line in recent months and has rallied within close striking distance of its 52-week high. Recent quarterly comparisons through Dec '12 show strong earnings increases above the +25% minimum guideline satisfying the C criteria. Annual earnings (A criteria) growth has improved following the downturn in FY '08 and '09 (see red circle). The Commercial Services - Leasing group has a high 97 Group Relative Strength Rating, a good sign concerning the L criteria. With only 9.17 million shares (S criteria) in the publicly traded float it may be particularly volatile in the event of any institutional buying or selling. The number of top-rated funds owning its shares rose from 111 in Mar '12 to 136 in Dec '12, a reassuring sign concerning the I criteria. Its current Up/Down Volume Ratio of 1.6 is also an unbiased bullish indication that its shares have been under accumulation over the past 50 days.
|
|
|
Color Codes Explained :
Y - Better candidates highlighted by our
staff of experts.
G - Previously featured
in past reports as yellow but may no longer be buyable under the
guidelines.
***Last / Change / Volume data in this table is the closing quote data***
Symbol/Exchange
Company Name
Industry Group |
PRICE |
CHANGE
(%Change) |
Day High |
Volume
(% DAV)
(% 50 day avg vol) |
52 Wk Hi
% From Hi |
Featured
Date |
Price
Featured |
Pivot Featured |
|
Max Buy |
CELG
-
NASDAQ
Celgene Corp
DRUGS - Drug Manufacturers - Major
|
$112.40
|
-1.88
-1.65% |
$114.29
|
4,792,377
120.42% of 50 DAV
50 DAV is 3,979,600
|
$115.44
-2.63%
|
12/11/2012
|
$82.24
|
PP = $81.34
|
|
MB = $85.41
|
Most Recent Note - 3/12/2013 1:09:23 PM
G - Wedging further into new all-time high territory with today's 6th consecutive gain, getting very extended from any sound base. Its 50 DMA line defines important support to watch.
>>> The latest Featured Stock Update with an annotated graph appeared on 2/28/2013. Click here.
View all notes |
Alert me of new notes |
CANSLIM.net Company Profile |
SEC |
Zacks Reports |
StockTalk |
News |
Chart |
Request a new note
C
A N
S L
I M


|
CFNL
-
NASDAQ
Cardinal Financial Corp
BANKING - Regional - Southeast Banks
|
$17.79
|
-0.06
-0.34% |
$17.94
|
325,212
149.80% of 50 DAV
50 DAV is 217,100
|
$18.19
-2.20%
|
3/7/2013
|
$17.27
|
PP = $16.77
|
|
MB = $17.61
|
 Most Recent Note - 3/15/2013 5:05:49 PM
G - Color code is changed to green while holding its ground stubbornly. Perched near its 52-week high since volume-driven gains last week cleared a "double bottom" base and triggered a technical buy signal. Prior highs in the high $16 area define initial support to watch on pullbacks.
>>> The latest Featured Stock Update with an annotated graph appeared on 2/21/2013. Click here.
View all notes |
Alert me of new notes |
CANSLIM.net Company Profile |
SEC |
Zacks Reports |
StockTalk |
News |
Chart |
Request a new note
C
A N
S L
I M
|
CMCSA
-
NASDAQ
Comcast Corp Cl A
MEDIA - CATV Systems
|
$40.71
|
-0.45
-1.09% |
$41.24
|
17,416,909
127.00% of 50 DAV
50 DAV is 13,713,900
|
$42.00
-3.07%
|
12/3/2012
|
$37.08
|
PP = $38.06
|
|
MB = $39.96
|
Most Recent Note - 3/15/2013 11:48:12 AM
G - Still consolidating above support at its 50 DMA line and perched very near its 52-week high. Fundamental concerns remain since it reported earnings +11% on +6% sales revenues for the Dec '12 quarter, below the +25% minimum earnings guideline (C criteria).
>>> The latest Featured Stock Update with an annotated graph appeared on 2/19/2013. Click here.
View all notes |
Alert me of new notes |
CANSLIM.net Company Profile |
SEC |
Zacks Reports |
StockTalk |
News |
Chart |
Request a new note
C
A N
S L
I M
|
CVLT
-
NASDAQ
Commvault Systems Inc
COMPUTER SOFTWARE and SERVICES - Business Software and Services
|
$83.76
|
-0.44
-0.52% |
$85.09
|
864,730
112.99% of 50 DAV
50 DAV is 765,300
|
$86.89
-3.60%
|
3/14/2013
|
$84.71
|
PP = $79.63
|
|
MB = $83.61
|
Most Recent Note - 3/14/2013 6:09:38 PM
Y - Finished the session with a solid gain backed by 4.5 times average volume while clearing the pivot point cited based on its 2/01/13 high plus 10 cents and hitting new 52-week highs. Found support at its 50 DMA line during its orderly consolidation. See the latest FSU analysis for more details and a new annotated graph.
>>> The latest Featured Stock Update with an annotated graph appeared on 3/14/2013. Click here.
View all notes |
Alert me of new notes |
CANSLIM.net Company Profile |
SEC |
Zacks Reports |
StockTalk |
News |
Chart |
Request a new note
C
A N
S L
I M
|
EVER
-
NYSE
Everbank Financial Corp
BANKING
|
$15.49
|
-0.15
-0.96% |
$15.76
|
1,027,919
121.94% of 50 DAV
50 DAV is 843,000
|
$17.29
-10.41%
|
3/4/2013
|
$15.38
|
PP = $15.83
|
|
MB = $16.62
|
Most Recent Note - 3/12/2013 1:47:11 PM
Y - Violated prior highs in the $16 area noted as initial chart support to watch, raising concerns. Slumped below its pivot point and briefly undercut its 50 DMA line before rebounding from the morning's lows.
>>> The latest Featured Stock Update with an annotated graph appeared on 3/4/2013. Click here.
View all notes |
Alert me of new notes |
CANSLIM.net Company Profile |
SEC |
Zacks Reports |
StockTalk |
News |
Chart |
Request a new note
C
A N
S L
I M
|
Symbol/Exchange
Company Name
Industry Group |
PRICE |
CHANGE
(%Change) |
Day High |
Volume
(% DAV)
(% 50 day avg vol) |
52 Wk Hi
% From Hi |
Featured
Date |
Price
Featured |
Pivot Featured |
|
Max Buy |
JAZZ
-
NASDAQ
Jazz Pharmaceuticals Plc
DRUGS - Biotechnology
|
$59.25
|
+0.14
0.23% |
$59.52
|
891,669
170.52% of 50 DAV
50 DAV is 522,900
|
$60.79
-2.53%
|
3/5/2013
|
$59.10
|
PP = $60.10
|
|
MB = $63.11
|
Most Recent Note - 3/15/2013 5:09:22 PM
Y - Small gain today with above average volume. Holding its ground since completing a Secondary Offering on 3/05/13. Disciplined investors may watch for a volume-driven gain above the pivot point to trigger a technical buy signal before new buying efforts may be justified under the fact-based investment system.
>>> The latest Featured Stock Update with an annotated graph appeared on 3/7/2013. Click here.
View all notes |
Alert me of new notes |
CANSLIM.net Company Profile |
SEC |
Zacks Reports |
StockTalk |
News |
Chart |
Request a new note
C
A N
S L
I M
|
KORS
-
NYSE
Michael Kors Hldgs Ltd
RETAIL - Apparel Stores
|
$57.38
|
-0.67
-1.15% |
$58.55
|
5,120,358
85.46% of 50 DAV
50 DAV is 5,991,800
|
$65.10
-11.86%
|
1/23/2013
|
$54.98
|
PP = $58.72
|
|
MB = $61.66
|
Most Recent Note - 3/13/2013 7:52:22 PM
Y - Color code is changed to yellow after rebounding above its 50 DMA line with today's volume-driven gain, improving its technical stance. Completed another Secondary Offering 2/20/13 while perched near its all-time high.
>>> The latest Featured Stock Update with an annotated graph appeared on 3/8/2013. Click here.
View all notes |
Alert me of new notes |
CANSLIM.net Company Profile |
SEC |
Zacks Reports |
StockTalk |
News |
Chart |
Request a new note
C
A N
S L
I M
|
LNKD
-
NYSE
Linkedin Corp Class A
INTERNET - Internet Information Providers
|
$177.50
|
-2.35
-1.31% |
$180.66
|
2,227,538
91.08% of 50 DAV
50 DAV is 2,445,600
|
$184.15
-3.61%
|
2/8/2013
|
$147.04
|
PP = $127.55
|
|
MB = $133.93
|
Most Recent Note - 3/14/2013 12:37:16 PM
G - Hit yet another new high with today's gain. Repeatedly noted - "Very extended from its prior base, but having rallied more than +20% in the first 2-3 weeks after its breakout, the investment system rules suggest holding such winners for a minimum of 8 weeks. See the latest FSU analysis for more details and a new annotated graph."
>>> The latest Featured Stock Update with an annotated graph appeared on 3/11/2013. Click here.
View all notes |
Alert me of new notes |
CANSLIM.net Company Profile |
SEC |
Zacks Reports |
StockTalk |
News |
Chart |
Request a new note
C
A N
S L
I M
|
LOPE
-
NASDAQ
Grand Canyon Education
DIVERSIFIED SERVICES - Education and; Training Services
|
$24.03
|
-0.31
-1.27% |
$24.51
|
487,642
105.07% of 50 DAV
50 DAV is 464,100
|
$27.18
-11.59%
|
2/20/2013
|
$26.44
|
PP = $25.10
|
|
MB = $26.36
|
Most Recent Note - 3/13/2013 7:49:45 PM
G - Consolidating near its 50 DMA line with volume totals cooling in recent weeks after it quickly negated the prior technical breakout. It has not formed a sound new base. See the latest FSU analysis for more details and a new annotated graph.
>>> The latest Featured Stock Update with an annotated graph appeared on 3/13/2013. Click here.
View all notes |
Alert me of new notes |
CANSLIM.net Company Profile |
SEC |
Zacks Reports |
StockTalk |
News |
Chart |
Request a new note
C
A N
S L
I M
|
MIDD
-
NASDAQ
Middleby Corp
MANUFACTURING - Diversified Machinery
|
$149.99
|
+0.12
0.08% |
$150.86
|
119,068
128.86% of 50 DAV
50 DAV is 92,400
|
$154.74
-3.07%
|
10/8/2012
|
$118.46
|
PP = $122.67
|
|
MB = $128.80
|
Most Recent Note - 3/12/2013 1:52:24 PM
G - Still hovering near all-time highs today with volume totals cooling. Fundamental concerns were recently noted. Its 50 DMA line defines important near-term chart support.
>>> The latest Featured Stock Update with an annotated graph appeared on 2/25/2013. Click here.
View all notes |
Alert me of new notes |
CANSLIM.net Company Profile |
SEC |
Zacks Reports |
StockTalk |
News |
Chart |
Request a new note
C
A N
S L
I M
|
Symbol/Exchange
Company Name
Industry Group |
PRICE |
CHANGE
(%Change) |
Day High |
Volume
(% DAV)
(% 50 day avg vol) |
52 Wk Hi
% From Hi |
Featured
Date |
Price
Featured |
Pivot Featured |
|
Max Buy |
MRLN
-
NASDAQ
Marlin Business Services
DIVERSIFIED SERVICES - Rental and Leasing Services
|
$20.96
|
-0.89
-4.07% |
$22.50
|
88,235
393.91% of 50 DAV
50 DAV is 22,400
|
$23.08
-9.19%
|
3/15/2013
|
$22.29
|
PP = $23.18
|
|
MB = $24.34
|
Most Recent Note - 3/15/2013 5:01:22 PM
Y - Erased early gains for a "negative reversal" and worrisome loss on above average volume. It was highlighted in yellow with pivot point cited based on its 9/21/12 high plus 10 cents in the earlier mid-day report (read here) and noted - "Disciplined investors may watch for subsequent volume-driven gains above the pivot point to trigger a technical buy signal before action may be justified under the fact-based investment system. Found support near its 200 DMA line in recent months and now rallying within close striking distance of its 52-week high. Recent quarterly comparisons through Dec '12 show strong earnings increases satisfying the C criteria. Annual earnings (A criteria) growth has improved following the downturn in FY '08 and '09." See the latest FSU analysis for more details and a new annotated graph.
>>> The latest Featured Stock Update with an annotated graph appeared on 3/15/2013. Click here.
View all notes |
Alert me of new notes |
CANSLIM.net Company Profile |
SEC |
Zacks Reports |
StockTalk |
News |
Chart |
Request a new note
C
A N
S L
I M
|
MWIV
-
NASDAQ
M W I Veterinary Supply
HEALTH SERVICES - Medical Instruments and; Supplies
|
$129.24
|
-0.74
-0.57% |
$130.75
|
172,633
307.18% of 50 DAV
50 DAV is 56,200
|
$137.18
-5.79%
|
3/4/2013
|
$130.90
|
PP = $129.45
|
|
MB = $135.92
|
Most Recent Note - 3/15/2013 5:13:27 PM
Y - Down today with above average volume, closing below its pivot point and raising concerns while enduring another distribution day. Disciplined investors limit loses by selling if ever any stock fall more than -7% from their purchase price.
>>> The latest Featured Stock Update with an annotated graph appeared on 3/6/2013. Click here.
View all notes |
Alert me of new notes |
CANSLIM.net Company Profile |
SEC |
Zacks Reports |
StockTalk |
News |
Chart |
Request a new note
C
A N
S L
I M
|
N
-
NYSE
Netsuite Inc
DIVERSIFIED SERVICES - Business/Management Services
|
$77.07
|
+0.46
0.60% |
$77.60
|
427,476
122.35% of 50 DAV
50 DAV is 349,400
|
$76.93
0.18%
|
12/12/2012
|
$64.75
|
PP = $67.12
|
|
MB = $70.48
|
Most Recent Note - 3/15/2013 5:08:15 PM
G - Rose with above average volume today for another new 52-week and all-time high. Its 50 DMA line acted as support during the recent consolidation.
>>> The latest Featured Stock Update with an annotated graph appeared on 3/1/2013. Click here.
View all notes |
Alert me of new notes |
CANSLIM.net Company Profile |
SEC |
Zacks Reports |
StockTalk |
News |
Chart |
Request a new note
C
A N
S L
I M
|
NSR
-
NYSE
Neustar Inc
TELECOMMUNICATIONS - Diversified Communication Serv
|
$45.09
|
-1.49
-3.20% |
$46.56
|
759,474
172.37% of 50 DAV
50 DAV is 440,600
|
$47.24
-4.55%
|
3/8/2013
|
$44.99
|
PP = $47.34
|
|
MB = $49.71
|
Most Recent Note - 3/15/2013 3:52:25 PM
Y - Erased the prior session's gain today, retreating near its 50 DMA line. Volume-driven gains above the pivot point may trigger a new (or add-on) technical buy signal. The 2/21/13 low ($42.40) defines important near-term support where any subsequent deterioration would raise greater concerns and trigger a worrisome technical sell signal.
>>> The latest Featured Stock Update with an annotated graph appeared on 2/27/2013. Click here.
View all notes |
Alert me of new notes |
CANSLIM.net Company Profile |
SEC |
Zacks Reports |
StockTalk |
News |
Chart |
Request a new note
C
A N
S L
I M
|
SLCA
-
NYSE
U S Silica Holdings Inc
CHEMICALS - Specialty Chemicals
|
$21.70
|
+0.00
0.00% |
$21.99
|
2,457,354
312.44% of 50 DAV
50 DAV is 786,500
|
$28.50
-23.86%
|
2/26/2013
|
$22.23
|
PP = $21.50
|
|
MB = $22.58
|
Most Recent Note - 3/15/2013 3:54:31 PM
G - Held its ground today. Gapped down on 3/14/13 after pricing a Secondary Offering while retreating on heavy volume after a spurt of volume-driven gains into new 52-week high territory. Previously noted - "Very extended from its prior base, but having rallied more than +20% in the first 2-3 weeks after its breakout, the investment system rules suggest holding such winners for a minimum of 8 weeks."
>>> The latest Featured Stock Update with an annotated graph appeared on 2/26/2013. Click here.
View all notes |
Alert me of new notes |
CANSLIM.net Company Profile |
SEC |
Zacks Reports |
StockTalk |
News |
Chart |
Request a new note
C
A N
S L
I M
|
Symbol/Exchange
Company Name
Industry Group |
PRICE |
CHANGE
(%Change) |
Day High |
Volume
(% DAV)
(% 50 day avg vol) |
52 Wk Hi
% From Hi |
Featured
Date |
Price
Featured |
Pivot Featured |
|
Max Buy |
VRX
-
NYSE
Valeant Pharmaceuticals
DRUGS - Drug Manufacturers - Other
|
$69.86
|
-0.21
-0.30% |
$70.18
|
1,652,425
128.59% of 50 DAV
50 DAV is 1,285,000
|
$71.49
-2.28%
|
12/20/2012
|
$60.24
|
PP = $61.21
|
|
MB = $64.27
|
Most Recent Note - 3/12/2013 2:00:03 PM
Y - Wedged higher with recent gains lacking great volume conviction, and holding its ground stubbornly. A valid secondary buy point exists following the successful test of support at its 10-week moving average up to as high as +5% above the recent high ($67.98 plus 5% or $71.38). Color code was changed to yellow however no new pivot point was cited since a new base was not formed. The 50 DMA line and recent low ($64.05 on 2/21/13) define important support areas to watch.
>>> The latest Featured Stock Update with an annotated graph appeared on 3/12/2013. Click here.
View all notes |
Alert me of new notes |
CANSLIM.net Company Profile |
SEC |
Zacks Reports |
StockTalk |
News |
Chart |
Request a new note
C
A N
S L
I M
|
|
|
|
THESE ARE NOT BUY RECOMMENDATIONS!
Comments contained in the body of this report are technical
opinions only. The material herein has been obtained
from sources believed to be reliable and accurate, however,
its accuracy and completeness cannot be guaranteed.
This site is not an investment advisor, hence it does
not endorse or recommend any securities or other investments.
Any recommendation contained in this report may not
be suitable for all investors and it is not to be deemed
an offer or solicitation on our part with respect to
the purchase or sale of any securities. All trademarks,
service marks and trade names appearing in this report
are the property of their respective owners, and are
likewise used for identification purposes only.
This report is a service available
only to active Paid Premium Members.
You may opt-out of receiving report notifications
at any time. Questions or comments may be submitted
by writing to Premium Membership Services 665 S.E. 10 Street, Suite 201 Deerfield Beach, FL 33441-5634 or by calling 1-800-965-8307
or 954-785-1121.
|
|
|

