***Last / Change / Volume data in this table is the closing quote data***
Symbol/Exchange
Company Name
Industry Group |
PRICE |
CHANGE
(%Change) |
Day High |
Volume
(% DAV)
(% 50 day avg vol) |
52 Wk Hi
% From Hi |
Featured
Date |
Price
Featured |
Pivot Featured |
|
Max Buy |
ADS
-
NYSE
Alliance Data Sys Corp
COMPUTER SOFTWARE and SERVICES - Information and Delivery Service
|
$126.30
|
+2.36
1.90% |
$126.30
|
754,440
104.89% of 50 DAV
50 DAV is 719,300
|
$124.60
1.36%
|
1/17/2012
|
$108.24
|
PP = $107.43
|
|
MB = $112.80
|
 Most Recent Note - 3/15/2012 9:36:08 PM
G - Up today with average volume for another new all-time high. Fundamental concerns were raised by earnings reported +9%, well below the +25% minimum guideline in the latest quarter ended December 31, 2011.
>>> The latest Featured Stock Update with an annotated graph appeared on 2/29/2012. Click here.
View all notes |
Alert me of new notes |
CANSLIM.net Company Profile |
SEC |
Zacks Reports |
StockTalk |
News |
Chart |
Request a new note
C
A N
S L
I M


|
ALLT
-
NASDAQ
Allot Communications Ltd
COMPUTER SOFTWARE andamp; SERVICES - Technical andamp; System Software
|
$21.11
|
+0.33
1.59% |
$21.21
|
393,128
115.97% of 50 DAV
50 DAV is 339,000
|
$21.15
-0.19%
|
3/13/2012
|
$19.72
|
PP = $18.91
|
|
MB = $19.86
|
Most Recent Note - 3/15/2012 9:37:21 PM
G - Hit another new 52-week high today with a 3rd consecutive gain, getting more extended from its prior base. A considerable gain on more than 7 times average volume cleared an orderly 13-week base and triggered a technical buy signal as it was featured in yellow in the 3/13/12 mid-day report (read here) with pivot point cited based on its 2/23/12 high plus 10 cents.Completed a new Public Offering on 11/09/11. It has attracted increasing interest from top-rated funds (I criteria). Quarterly comparisons have shown strong sales revenues and earnings increases satisfying the C criteria. This Israeli Computer - Networking firm showed good annual earnings increases in FY '10 & '11 after losses in prior years. No overhead supply remains to act as resistance.

There are no Featured Stock Updates™ available for this stock at this time. You may request one by clicking the Request a New Note link below
View all notes |
Alert me of new notes |
CANSLIM.net Company Profile |
SEC |
Zacks Reports |
StockTalk |
News |
Chart |
Request a new note
C
A N
S L
I M
|
ALXN
-
NASDAQ
Alexion Pharmaceuticals
DRUGS - Drug Manufacturers - Other
|
$89.52
|
+0.35
0.39% |
$89.77
|
1,133,431
90.67% of 50 DAV
50 DAV is 1,250,000
|
$89.85
-0.37%
|
3/12/2012
|
$87.87
|
PP = $87.73
|
|
MB = $92.12
|
Most Recent Note - 3/12/2012 4:43:50 PM
Y - Hit a new all-time high with today's volume-driven gain. Color code is changed to yellow with new pivot point cited based on its 2/23/12 high. Its gain cleared an advanced "3-weeks tight" base, albeit a risker late-stage breakout, technically triggering a new (or add-on) buy signal. Support to watch on pullbacks is its 50 DMA line.
>>> The latest Featured Stock Update with an annotated graph appeared on 2/24/2012. Click here.
View all notes |
Alert me of new notes |
CANSLIM.net Company Profile |
SEC |
Zacks Reports |
StockTalk |
News |
Chart |
Request a new note
C
A N
S L
I M
|
BODY
-
NASDAQ
Body Central Corp
RETAIL - Catalog andamp; Mail Order Houses
|
$27.03
|
-0.27
-0.99% |
$27.45
|
128,380
60.44% of 50 DAV
50 DAV is 212,400
|
$29.49
-8.34%
|
1/27/2012
|
$26.69
|
PP = $25.46
|
|
MB = $26.73
|
Most Recent Note - 3/12/2012 4:53:55 PM
G - Reported earnings +52% on +20% sales revenues for the quarter ended December 31, 2011 versus the year ago period. Posted a gain today with below average volume. Found prompt support near its 50 DMA line and prior highs in the $26 area after a damaging 3/09/11 gap down and considerable volume-driven loss violated the previously noted upward trendline connecting its Nov-Feb lows.
>>> The latest Featured Stock Update with an annotated graph appeared on 3/13/2012. Click here.
View all notes |
Alert me of new notes |
CANSLIM.net Company Profile |
SEC |
Zacks Reports |
StockTalk |
News |
Chart |
Request a new note
C
A N
S L
I M
|
CATM
-
NASDAQ
Cardtronics Inc
DIVERSIFIED SERVICES - Business/Management Services
|
$27.02
|
+0.03
0.11% |
$27.19
|
452,174
112.96% of 50 DAV
50 DAV is 400,300
|
$28.74
-5.98%
|
2/24/2012
|
$27.94
|
PP = $28.30
|
|
MB = $29.72
|
Most Recent Note - 3/12/2012 4:54:40 PM
Y - Pulled back today for a 5th consecutive small loss on below average volume while staying perched near its pivot point cited, not yet triggering a technical buy signal. Disciplined investors resist the urge to get in early while confirming gains are still needed.
>>> The latest Featured Stock Update with an annotated graph appeared on 1/30/2012. Click here.
View all notes |
Alert me of new notes |
CANSLIM.net Company Profile |
SEC |
Zacks Reports |
StockTalk |
News |
Chart |
Request a new note
C
A N
S L
I M
|
Symbol/Exchange
Company Name
Industry Group |
PRICE |
CHANGE
(%Change) |
Day High |
Volume
(% DAV)
(% 50 day avg vol) |
52 Wk Hi
% From Hi |
Featured
Date |
Price
Featured |
Pivot Featured |
|
Max Buy |
CDNS
-
NASDAQ
Cadence Design Systems
COMPUTER SOFTWARE and SERVICES - Technical and System Software
|
$12.40
|
+0.25
2.06% |
$12.41
|
5,707,261
172.57% of 50 DAV
50 DAV is 3,307,300
|
$12.29
0.90%
|
2/3/2012
|
$11.66
|
PP = $11.15
|
|
MB = $11.71
|
Most Recent Note - 3/15/2012 9:30:39 PM
G - Hit a new 52-week high today with a solid gain on above average volume. Color code is changed to green as it is getting extended from the most ideal range for accumulating shares under the fact based system following an earlier technical breakout.
>>> The latest Featured Stock Update with an annotated graph appeared on 2/3/2012. Click here.
View all notes |
Alert me of new notes |
CANSLIM.net Company Profile |
SEC |
Zacks Reports |
StockTalk |
News |
Chart |
Request a new note
C
A N
S L
I M
|
CELG
-
NASDAQ
Celgene Corp
DRUGS - Drug Manufacturers - Major
|
$76.13
|
+0.12
0.16% |
$76.40
|
2,078,565
65.01% of 50 DAV
50 DAV is 3,197,500
|
$77.43
-1.68%
|
2/2/2012
|
$74.16
|
PP = $75.21
|
|
MB = $78.97
|
Most Recent Note - 3/13/2012 10:42:53 PM
Y - Rose back above its pivot point today for a new 52-week high with a gain on near average volume, not meeting the +40% above average volume threshold for a new confirming technical buy signal. Currently perched within striking distance of its all-time high ($77.39 in Aug '08). Any subsequent volume-driven gains would be a reassuring sign of fresh institutional demand
>>> The latest Featured Stock Update with an annotated graph appeared on 2/2/2012. Click here.
View all notes |
Alert me of new notes |
CANSLIM.net Company Profile |
SEC |
Zacks Reports |
StockTalk |
News |
Chart |
Request a new note
C
A N
S L
I M
|
COO
-
NYSE
Cooper Companies Inc
HEALTH SERVICES - Medical Instruments and Supplies
|
$80.83
|
-0.33
-0.41% |
$81.14
|
279,673
68.26% of 50 DAV
50 DAV is 409,700
|
$84.20
-4.00%
|
3/9/2012
|
$83.05
|
PP = $81.02
|
|
MB = $85.07
|
Most Recent Note - 3/13/2012 10:48:38 PM
Y - Gain on average volume today, remaining under the pivot point. The 3/09/12 gain with 4 times average volume triggered a technical buy signal as it rose from a near 6-month cup-with-handle base pattern.
>>> The latest Featured Stock Update with an annotated graph appeared on 3/9/2012. Click here.
View all notes |
Alert me of new notes |
CANSLIM.net Company Profile |
SEC |
Zacks Reports |
StockTalk |
News |
Chart |
Request a new note
C
A N
S L
I M
|
DISH
-
NASDAQ
Dish Network Corp Cl A
CONSUMER DURABLES - Electronic Equipment
|
$31.83
|
+0.45
1.43% |
$31.87
|
1,824,858
69.07% of 50 DAV
50 DAV is 2,642,000
|
$32.57
-2.26%
|
3/7/2012
|
$30.83
|
PP = $30.10
|
|
MB = $31.61
|
Most Recent Note - 3/14/2012 10:20:21 PM
Y - Light volume loss today. It remains within 5% of its pivot point, not too extended from its latest base. Prior highs in the $30 area define initial support to watch on pullbacks. See the latest FSU analysis for more details and a new annotated weekly graph.
>>> The latest Featured Stock Update with an annotated graph appeared on 3/14/2012. Click here.
View all notes |
Alert me of new notes |
CANSLIM.net Company Profile |
SEC |
Zacks Reports |
StockTalk |
News |
Chart |
Request a new note
C
A N
S L
I M
|
ECHO
-
NASDAQ
Echo Global Logistics
DIVERSIFIED SERVICES - Business/Management Services
|
$18.41
|
+0.62
3.49% |
$18.50
|
103,998
131.64% of 50 DAV
50 DAV is 79,000
|
$19.38
-5.01%
|
2/22/2012
|
$18.50
|
PP = $18.63
|
|
MB = $19.56
|
Most Recent Note - 3/15/2012 9:25:25 PM
Y - Rallied from support at its 50 DMA line with a solid gain today on higher volume, finishing near the session high yet still below its previously cited pivot point.
>>> The latest Featured Stock Update with an annotated graph appeared on 2/23/2012. Click here.
View all notes |
Alert me of new notes |
CANSLIM.net Company Profile |
SEC |
Zacks Reports |
StockTalk |
News |
Chart |
Request a new note
C
A N
S L
I M
|
Symbol/Exchange
Company Name
Industry Group |
PRICE |
CHANGE
(%Change) |
Day High |
Volume
(% DAV)
(% 50 day avg vol) |
52 Wk Hi
% From Hi |
Featured
Date |
Price
Featured |
Pivot Featured |
|
Max Buy |
FEIC
-
NASDAQ
F E I Co
ELECTRONICS - Diversified Electronics
|
$46.31
|
+1.00
2.21% |
$46.86
|
295,519
91.29% of 50 DAV
50 DAV is 323,700
|
$48.31
-4.14%
|
12/7/2011
|
$41.41
|
PP = $42.35
|
|
MB = $44.47
|
Most Recent Note - 3/15/2012 12:51:21 PM
G - Gain today has it poised for its best-ever close. No resistance remains due to overhead supply, however the latest quarterly report showed +21% earnings for the Dec '11 quarter, below the +25% minimum guideline for earnings growth.
>>> The latest Featured Stock Update with an annotated graph appeared on 3/12/2012. Click here.
View all notes |
Alert me of new notes |
CANSLIM.net Company Profile |
SEC |
Zacks Reports |
StockTalk |
News |
Chart |
Request a new note
C
A N
S L
I M
|
GNC
-
NYSE
G N C Holdings Inc
RETAIL - Drug Stores
|
$33.29
|
+0.04
0.12% |
$33.52
|
1,935,257
142.70% of 50 DAV
50 DAV is 1,356,200
|
$34.71
-4.09%
|
1/19/2012
|
$28.99
|
PP = $29.60
|
|
MB = $31.08
|
Most Recent Note - 3/14/2012 11:46:47 AM
G - Pulling back today following a considerable gap up gain on the prior session after raising guidance based on stronger same store sales than previously expected. Hit a new all-time high following a brief consolidation above prior highs in the $29.50 area and its 50 DMA line defining near-term support to watch.
>>> The latest Featured Stock Update with an annotated graph appeared on 3/5/2012. Click here.
View all notes |
Alert me of new notes |
CANSLIM.net Company Profile |
SEC |
Zacks Reports |
StockTalk |
News |
Chart |
Request a new note
C
A N
S L
I M
|
HLF
-
NYSE
Herbalife Ltd
DRUGS - Nutrition and Weight Management
|
$70.75
|
+0.85
1.22% |
$71.41
|
1,660,459
125.20% of 50 DAV
50 DAV is 1,326,200
|
$70.35
0.57%
|
2/22/2012
|
$65.90
|
PP = $63.50
|
|
MB = $66.68
|
Most Recent Note - 3/12/2012 5:40:23 PM
G - Holding its ground after rallying above its "max buy" level and getting extended from its prior base pattern. Prior highs in the $63 area define support to watch on pullbacks.
>>> The latest Featured Stock Update with an annotated graph appeared on 2/22/2012. Click here.
View all notes |
Alert me of new notes |
CANSLIM.net Company Profile |
SEC |
Zacks Reports |
StockTalk |
News |
Chart |
Request a new note
C
A N
S L
I M
|
ISRG
-
NASDAQ
Intuitive Surgical Inc
HEALTH SERVICES - Medical Appliances and Equipment
|
$528.20
|
+0.00
0.00% |
$528.68
|
215,444
58.86% of 50 DAV
50 DAV is 366,000
|
$533.00
-0.90%
|
12/20/2011
|
$442.43
|
PP = $449.16
|
|
MB = $471.62
|
Most Recent Note - 3/12/2012 5:42:22 PM
G - Today's gain helped it wedge up to another new all-time high without great volume conviction. Stubbornly held its ground while consolidating in a very tight trading range near its highs in recent weeks. December '11 quarterly earnings increased by just below the borderline +25% minimum guideline for ideal buy candidates.
>>> The latest Featured Stock Update with an annotated graph appeared on 3/1/2012. Click here.
View all notes |
Alert me of new notes |
CANSLIM.net Company Profile |
SEC |
Zacks Reports |
StockTalk |
News |
Chart |
Request a new note
C
A N
S L
I M
|
LULU
-
NASDAQ
Lululemon Athletica
MANUFACTURING - Textile Manufacturing
|
$74.24
|
+1.81
2.50% |
$74.36
|
2,161,445
89.57% of 50 DAV
50 DAV is 2,413,100
|
$73.73
0.69%
|
1/10/2012
|
$60.97
|
PP = $59.46
|
|
MB = $62.43
|
Most Recent Note - 3/15/2012 9:27:03 PM
G - Finished near the session high today with another gain for a new all-time high. It is extended from any sound base. Prior highs in the $61-64 area and its 50 DMA line define chart support to watch on pullbacks.
>>> The latest Featured Stock Update with an annotated graph appeared on 2/21/2012. Click here.
View all notes |
Alert me of new notes |
CANSLIM.net Company Profile |
SEC |
Zacks Reports |
StockTalk |
News |
Chart |
Request a new note
C
A N
S L
I M
|
Symbol/Exchange
Company Name
Industry Group |
PRICE |
CHANGE
(%Change) |
Day High |
Volume
(% DAV)
(% 50 day avg vol) |
52 Wk Hi
% From Hi |
Featured
Date |
Price
Featured |
Pivot Featured |
|
Max Buy |
MA
-
NYSE
Mastercard Inc Cl A
DIVERSIFIED SERVICES - Business/Management Services
|
$419.55
|
-1.87
-0.44% |
$422.99
|
588,850
52.73% of 50 DAV
50 DAV is 1,116,700
|
$428.57
-2.10%
|
3/12/2012
|
$419.86
|
PP = $428.67
|
|
MB = $450.10
|
Most Recent Note - 3/12/2012 5:50:08 PM
Y - Quietly hovering near its all-time high, it has formed an advanced "3-weeks tight" base and a new pivot point is cited based on its 2/29/12 high plus 10 cents while its color code is changed to yellow. Volume-driven gains may trigger a new (or add-on) technical buy signal, meanwhile its prior highs in the $381-384 area define support to watch on pullbacks along with its 50 DMA line.
>>> The latest Featured Stock Update with an annotated graph appeared on 2/17/2012. Click here.
View all notes |
Alert me of new notes |
CANSLIM.net Company Profile |
SEC |
Zacks Reports |
StockTalk |
News |
Chart |
Request a new note
C
A N
S L
I M
|
MELI
-
NASDAQ
Mercadolibre Inc
INTERNET - Internet Software and; Services
|
$97.62
|
+1.56
1.62% |
$98.50
|
152,575
28.60% of 50 DAV
50 DAV is 533,500
|
$104.50
-6.58%
|
2/6/2012
|
$97.09
|
PP = $95.58
|
|
MB = $100.36
|
Most Recent Note - 3/15/2012 9:39:36 PM
Y - Quietly consolidating, staying above its 50 DMA line and above the recent low ($91.38 on 3/06/12) defining important support areas to watch.
>>> The latest Featured Stock Update with an annotated graph appeared on 2/6/2012. Click here.
View all notes |
Alert me of new notes |
CANSLIM.net Company Profile |
SEC |
Zacks Reports |
StockTalk |
News |
Chart |
Request a new note
C
A N
S L
I M
|
MKTX
-
NASDAQ
Marketaxess Holdings Inc
FINANCIAL SERVICES - Investment Brokerage - Nationa
|
$35.20
|
-0.45
-1.26% |
$35.86
|
338,931
136.17% of 50 DAV
50 DAV is 248,900
|
$37.06
-5.02%
|
3/8/2012
|
$35.80
|
PP = $35.52
|
|
MB = $37.30
|
Most Recent Note - 3/14/2012 10:29:02 PM
Y - Loss today broke a streak of 9 consecutive gains. Color code was changed to yellow with new pivot point cited based on its 2/03/12 high plus 10 cents. It has not produced a recent gain above the new pivot point backed at least +40% above average volume to trigger a proper technical buy signal.
>>> The latest Featured Stock Update with an annotated graph appeared on 3/8/2012. Click here.
View all notes |
Alert me of new notes |
CANSLIM.net Company Profile |
SEC |
Zacks Reports |
StockTalk |
News |
Chart |
Request a new note
C
A N
S L
I M
|
RAX
-
NYSE
Rackspace Hosting Inc
INTERNET - Internet Software and; Services
|
$56.55
|
+1.28
2.32% |
$56.75
|
2,417,499
117.53% of 50 DAV
50 DAV is 2,056,900
|
$56.94
-0.68%
|
2/2/2012
|
$46.69
|
PP = $45.55
|
|
MB = $47.83
|
Most Recent Note - 3/15/2012 12:57:20 PM
G - Challenging its 52-week high with today's gain and no resistance remains due to overhead supply. Its recent consolidation is a little short of the 5-week minimum length for it to be considered a new flat base pattern. Recently found support well above its 50 DMA line and prior highs in the $46 area that define important near-term support to watch.
>>> The latest Featured Stock Update with an annotated graph appeared on 2/16/2012. Click here.
View all notes |
Alert me of new notes |
CANSLIM.net Company Profile |
SEC |
Zacks Reports |
StockTalk |
News |
Chart |
Request a new note
C
A N
S L
I M
|
RRTS
-
NYSE
Roadrunner Trans Systems
TRANSPORTATION - Air Delivery and Freight Service
|
$18.28
|
+0.34
1.90% |
$18.28
|
191,393
136.81% of 50 DAV
50 DAV is 139,900
|
$18.44
-0.87%
|
2/10/2012
|
$17.40
|
PP = $17.50
|
|
MB = $18.38
|
Most Recent Note - 3/15/2012 9:41:31 PM
Y - Finished at the session high with a solid gain today on above average volume, approaching its "max buy" level. Prior highs in the $17 area define initial support to watch on pullbacks.
>>> The latest Featured Stock Update with an annotated graph appeared on 2/13/2012. Click here.
View all notes |
Alert me of new notes |
CANSLIM.net Company Profile |
SEC |
Zacks Reports |
StockTalk |
News |
Chart |
Request a new note
C
A N
S L
I M
|
Symbol/Exchange
Company Name
Industry Group |
PRICE |
CHANGE
(%Change) |
Day High |
Volume
(% DAV)
(% 50 day avg vol) |
52 Wk Hi
% From Hi |
Featured
Date |
Price
Featured |
Pivot Featured |
|
Max Buy |
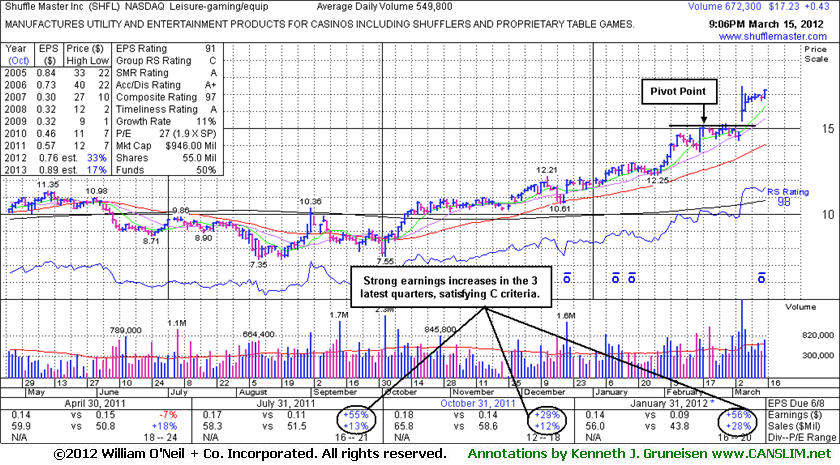
SHFL
-
NASDAQ
Shuffle Master Inc
MANUFACTURING - Diversified Machinery
|
$17.23
|
+0.43
2.56% |
$17.28
|
677,951
123.31% of 50 DAV
50 DAV is 549,800
|
$17.49
-1.49%
|
3/6/2012
|
$17.07
|
PP = $15.25
|
|
MB = $16.01
|
Most Recent Note - 3/15/2012 9:21:15 PM
G - Up today with slightly above average volume for its highest close of the year. It is extended from any sound base pattern. See the latest FSU analysis for more details and a new annotated daily graph.
>>> The latest Featured Stock Update with an annotated graph appeared on 3/15/2012. Click here.
View all notes |
Alert me of new notes |
CANSLIM.net Company Profile |
SEC |
Zacks Reports |
StockTalk |
News |
Chart |
Request a new note
C
A N
S L
I M
|
SWI
-
NYSE
Solarwinds Inc
COMPUTER SOFTWARE and SERVICES - Application Software
|
$38.85
|
+0.78
2.05% |
$38.86
|
504,973
43.16% of 50 DAV
50 DAV is 1,170,100
|
$39.75
-2.26%
|
1/26/2012
|
$32.36
|
PP = $33.78
|
|
MB = $35.47
|
Most Recent Note - 3/15/2012 9:34:44 PM
G - Posted a gain today with very light volume. Earnings below the +25% guideline for the Dec '11 quarter raised fundamental concerns.
>>> The latest Featured Stock Update with an annotated graph appeared on 1/26/2012. Click here.
View all notes |
Alert me of new notes |
CANSLIM.net Company Profile |
SEC |
Zacks Reports |
StockTalk |
News |
Chart |
Request a new note
C
A N
S L
I M
|
SXCI
-
NASDAQ
S X C Health Solutions
COMPUTER SOFTWARE and SERVICES - Healthcare Information Service
|
$73.14
|
+0.06
0.08% |
$74.49
|
373,393
91.32% of 50 DAV
50 DAV is 408,900
|
$76.42
-4.29%
|
2/23/2012
|
$68.24
|
PP = $66.05
|
|
MB = $69.35
|
Most Recent Note - 3/12/2012 6:16:09 PM
G - Held its ground today near its all-time high hit on the prior session. Prior highs in the $66 area define support to watch on pullbacks.
>>> The latest Featured Stock Update with an annotated graph appeared on 3/6/2012. Click here.
View all notes |
Alert me of new notes |
CANSLIM.net Company Profile |
SEC |
Zacks Reports |
StockTalk |
News |
Chart |
Request a new note
C
A N
S L
I M
|
TDG
-
NYSE
Transdigm Group Inc
AEROSPACE/DEFENSE - Aerospace/Defense Products and; Services
|
$115.30
|
+0.27
0.23% |
$115.76
|
500,340
124.84% of 50 DAV
50 DAV is 400,800
|
$121.48
-5.09%
|
2/29/2012
|
$120.10
|
PP = $118.93
|
|
MB = $124.88
|
Most Recent Note - 3/12/2012 6:18:17 PM
Y - Holding its ground since its 3/06/12 gap down, sputtering below its latest pivot point after encountering distributional pressure. Its 50 DMA line defines important chart support to watch above prior highs in the $102 area.
>>> The latest Featured Stock Update with an annotated graph appeared on 2/10/2012. Click here.
View all notes |
Alert me of new notes |
CANSLIM.net Company Profile |
SEC |
Zacks Reports |
StockTalk |
News |
Chart |
Request a new note
C
A N
S L
I M
|
TNGO
-
NASDAQ
Tangoe Inc
COMPUTER SOFTWARE and SERVICES - Technical and System Software
|
$17.88
|
+0.01
0.06% |
$18.04
|
212,831
62.09% of 50 DAV
50 DAV is 342,800
|
$19.90
-10.15%
|
2/13/2012
|
$15.39
|
PP = $16.51
|
|
MB = $17.34
|
Most Recent Note - 3/13/2012 9:51:55 AM
G - Gapped down today, slumping near its "max buy" level. Prior highs in the $16 area and its 50 DMA line coincide and define important chart support to watch while consolidating.
>>> The latest Featured Stock Update with an annotated graph appeared on 2/14/2012. Click here.
View all notes |
Alert me of new notes |
CANSLIM.net Company Profile |
SEC |
Zacks Reports |
StockTalk |
News |
Chart |
Request a new note
C
A N
S L
I M
|
Symbol/Exchange
Company Name
Industry Group |
PRICE |
CHANGE
(%Change) |
Day High |
Volume
(% DAV)
(% 50 day avg vol) |
52 Wk Hi
% From Hi |
Featured
Date |
Price
Featured |
Pivot Featured |
|
Max Buy |
TSCO
-
NASDAQ
Tractor Supply Co
SPECIALTY RETAIL - Specialty Retail, Other
|
$87.28
|
-0.35
-0.40% |
$87.96
|
331,558
45.07% of 50 DAV
50 DAV is 735,600
|
$88.65
-1.55%
|
1/12/2012
|
$79.12
|
PP = $75.58
|
|
MB = $79.36
|
Most Recent Note - 3/12/2012 6:20:38 PM
G - It is extended from a sound base after tallying 6 weekly gains in the span of 7 weeks. Its 50 DMA line defines support to watch on pullbacks.
>>> The latest Featured Stock Update with an annotated graph appeared on 2/27/2012. Click here.
View all notes |
Alert me of new notes |
CANSLIM.net Company Profile |
SEC |
Zacks Reports |
StockTalk |
News |
Chart |
Request a new note
C
A N
S L
I M
|
UA
-
NYSE
Under Armour Inc Cl A
CONSUMER NON-DURABLES - Textile - Apparel Clothing
|
$96.03
|
-1.54
-1.58% |
$97.99
|
1,010,072
77.38% of 50 DAV
50 DAV is 1,305,300
|
$99.10
-3.10%
|
2/15/2012
|
$85.77
|
PP = $84.86
|
|
MB = $89.10
|
Most Recent Note - 3/12/2012 6:22:21 PM
G - Posted a 4th consecutive gain today. Recent gains above its pivot point did not have volume sufficient to trigger a proper technical buy signal. Pyramiding into a position can help investors avoid chasing stocks too far above their pivot point.
>>> The latest Featured Stock Update with an annotated graph appeared on 2/15/2012. Click here.
View all notes |
Alert me of new notes |
CANSLIM.net Company Profile |
SEC |
Zacks Reports |
StockTalk |
News |
Chart |
Request a new note
C
A N
S L
I M
|
UBNT
-
NASDAQ
Ubiquiti Networks Inc
TELECOMMUNICATIONS - Diversified Communication Serv
|
$27.17
|
+0.17
0.63% |
$27.33
|
118,485
37.46% of 50 DAV
50 DAV is 316,300
|
$28.97
-6.21%
|
1/27/2012
|
$22.25
|
PP = $23.14
|
|
MB = $24.30
|
Most Recent Note - 3/12/2012 6:24:28 PM
Y - Up today below above average for a 4th consecutive gain, closing further above its previously noted "max buy" level. No new pivot point was cited and it remained color coded yellow, as they teach in the Certification that a stock may be bought from its 10-week moving average (WMA) up to +5% above the latest high ($28.97 on 2/28/12 plus another 5%) following an earlier technical breakout.
>>> The latest Featured Stock Update with an annotated graph appeared on 2/1/2012. Click here.
View all notes |
Alert me of new notes |
CANSLIM.net Company Profile |
SEC |
Zacks Reports |
StockTalk |
News |
Chart |
Request a new note
C
A N
S L
I M
|
ULTA
-
NASDAQ
Ulta Salon Cosm & Frag
SPECIALTY RETAIL - Specialty Retail, Other
|
$90.37
|
+0.91
1.02% |
$90.90
|
767,897
98.31% of 50 DAV
50 DAV is 781,100
|
$92.00
-1.77%
|
1/11/2012
|
$71.97
|
PP = $75.80
|
|
MB = $79.59
|
Most Recent Note - 3/12/2012 6:26:00 PM
G - Pulled back today on average volume from the all-time high hit on the prior session. It is extended from any sound base pattern, meanwhile its prior highs near $75 and its 50 DMA line define important chart support.
>>> The latest Featured Stock Update with an annotated graph appeared on 2/28/2012. Click here.
View all notes |
Alert me of new notes |
CANSLIM.net Company Profile |
SEC |
Zacks Reports |
StockTalk |
News |
Chart |
Request a new note
C
A N
S L
I M
|
V
-
NYSE
Visa Inc Cl A
DIVERSIFIED SERVICES - Business/Management Services
|
$117.00
|
+0.25
0.21% |
$117.47
|
3,323,425
85.64% of 50 DAV
50 DAV is 3,880,700
|
$119.36
-1.98%
|
3/12/2012
|
$116.53
|
PP = $119.46
|
|
MB = $125.43
|
Most Recent Note - 3/12/2012 6:30:53 PM
Y - Consolidating near its all-time high with volume totals cooling while forming an advanced "3-weeks tight" pattern. Color code is changed to yellow with new pivot point based on its 2/29/12 high plus 10 cents. Volume-driven gains may trigger a new (or add-on) technical buy signal, meanwhile prior highs in the $103-104 area define support to watch along with its 50 DMA line.
>>> The latest Featured Stock Update with an annotated graph appeared on 3/7/2012. Click here.
View all notes |
Alert me of new notes |
CANSLIM.net Company Profile |
SEC |
Zacks Reports |
StockTalk |
News |
Chart |
Request a new note
C
A N
S L
I M
|
Symbol/Exchange
Company Name
Industry Group |
PRICE |
CHANGE
(%Change) |
Day High |
Volume
(% DAV)
(% 50 day avg vol) |
52 Wk Hi
% From Hi |
Featured
Date |
Price
Featured |
Pivot Featured |
|
Max Buy |