You are not logged in.
This means you
CAN ONLY VIEW reports that were published prior to Monday, April 14, 2025.
You
MUST UPGRADE YOUR MEMBERSHIP if you want to see any current reports.
AFTER MARKET UPDATE - THURSDAY, MARCH 14TH, 2013
Previous After Market Report Next After Market Report >>>
|
|
|
|
DOW |
+83.86 |
14,539.14 |
+0.58% |
|
Volume |
676,511,930 |
+16% |
|
Volume |
1,606,040,340 |
+6% |
|
NASDAQ |
+13.81 |
3,258.93 |
+0.43% |
|
Advancers |
2,006 |
64% |
|
Advancers |
1,639 |
64% |
|
S&P 500 |
+8.71 |
1,563.23 |
+0.56% |
|
Decliners |
986 |
32% |
|
Decliners |
802 |
32% |
|
Russell 2000 |
+9.17 |
953.07 |
+0.97% |
|
52 Wk Highs |
383 |
|
|
52 Wk Highs |
231 |
|
|
S&P 600 |
+5.59 |
531.67 |
+1.06% |
|
52 Wk Lows |
24 |
|
|
52 Wk Lows |
12 |
|
|
 |
Major Averages Extend Rally With Higher Volume and Positive Breadth
Kenneth J. Gruneisen - Passed the CAN SLIM® Master's Exam
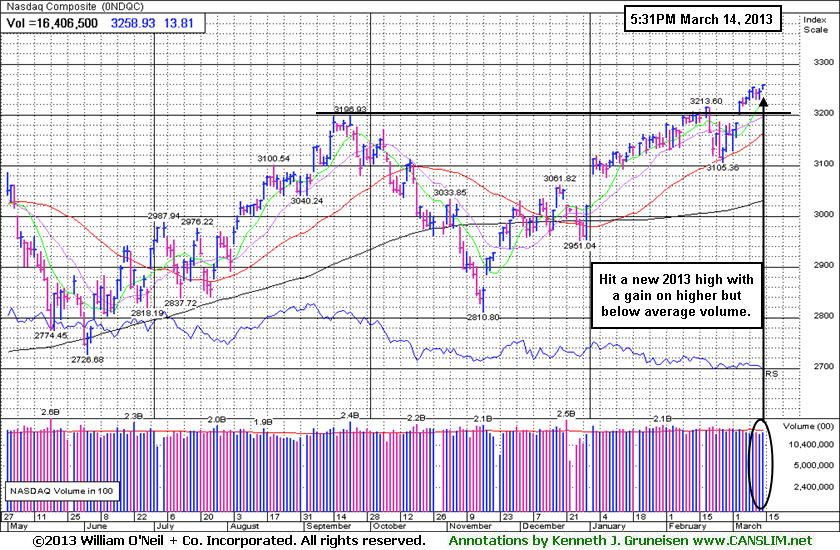
The major indices extended their gains into the closing bell of Thursday's session. The volume totals reported were higher than the prior session totals on the NYSE and on the Nasdaq exchange, an encouraging sign of accumulation by institutional investors. Breadth was solidly positive as advancers led decliners by a 2-1 margin on the NYSE and on the Nasdaq exchange. The total number of stocks hitting new 52-week highs swelled and easily outnumbered new 52-week lows on the NYSE and on the Nasdaq exchange. There were 100 high-ranked companies from the CANSLIM.net Leaders List making new 52-week highs and appearing on the CANSLIM.net BreakOuts Page, up from the prior session's total of 68 stocks. There were gains for 11 of the 16 high-ranked companies currently included on the Featured Stocks Page.
The Dow Jones Industrial Average improved its winning streak to 10 sessions, its best winning streak since 1996. Stocks were higher from the opening bell as investors responded positively to a better-than-expected unemployment report. Looking at the data, weekly jobless claims fell -10,000 from the previous week to 332,000. That reading was better than the anticipated 350,000 first-time claims. Also on the economic front, producer prices rose +0.7% in February, in-line with expectations.
All 10 sectors on the S&P ended higher, led by gains in energy stocks including shares of Chevron Corp (CVX +1.39%) and Transocean Ltd (RIG +1.78%). Financial stocks were also active ahead of the Fed's capital analysis review. Details were due to be released in the evening and will determine whether institutions are able to pay dividends or buy back stock. In the space, Bank of America Corp (BAC +0.41%) edged higher. E-Trade Financial Corp (ETFC -8.21%) was the largest decliner among S&P 500 issues as it proposed a Secondary Offering while its largest shareholder looked to reduce its holdings.
On the earnings front, The Men's Wearhouse Inc(MW +19.09%) rallied following their fourth-quarter profit tally, but Vera Bradley Inc (VRA -8.3%) tumbled following their fourth-quarter report. In other news, Blackberry (BBRY +3.77%) rallied after receiving the largest smartphone order in the company's history.
Turning to fixed income markets, Treasuries ended lower along the curve. The benchmark 10-year note was down 3/32 to yield 2.03% and the 30-year bond fell 3/8 of a point to yield 3.24%.
New buying efforts are justified under the fact-based system since a follow-through day on 3/05/13 shifted the market's (M criteria) direction to a confirmed rally again after a brief correction. Any sustainable rally requires a healthy crop of companies hitting new 52-week highs, so it is always essential to see meaningful leadership (stocks hitting new 52-week highs).
Watch for an announcement via email concerning the next WEBCAST. The webcast will also be available via an updated link highlighted at the top of the Premium Member Homepage.
PICTURED: The Nasdaq Composite Index rose to a new 2013 with a gain on higher but below average volume.
|
 Kenneth J. Gruneisen started out as a licensed stockbroker in August 1987, a couple of months prior to the historic stock market crash that took the Dow Jones Industrial Average down -22.6% in a single day. He has published daily fact-based fundamental and technical analysis on high-ranked stocks online for two decades. Through FACTBASEDINVESTING.COM, Kenneth provides educational articles, news, market commentary, and other information regarding proven investment systems that work in good times and bad.
Comments contained in the body of this report are technical opinions only and are not necessarily those of Gruneisen Growth Corp. The material herein has been obtained from sources believed to be reliable and accurate, however, its accuracy and completeness cannot be guaranteed. Our firm, employees, and customers may effect transactions, including transactions contrary to any recommendation herein, or have positions in the securities mentioned herein or options with respect thereto. Any recommendation contained in this report may not be suitable for all investors and it is not to be deemed an offer or solicitation on our part with respect to the purchase or sale of any securities. |
|
 |
Commodity-Linked Groups, Bank, and Tech Indexes Rose
Kenneth J. Gruneisen - Passed the CAN SLIM® Master's Exam
Commodity-linked groups tallied gains as the Gold & Silver Index ($XAU +1.03%), Integrated Oil Index ($XOI +1.11%), and Oil Services Index ($OSX +1.47%) rose on Thursday. The Retail Index ($RLX -0.67%) created a slight drag on the major averages while the Broker/Dealer Index ($XBD +0.01%) finished flat and the Bank Index ($BKX +0.56%) edged higher. The Internet Index ($IIX -0.39%) and Healthcare Index ($HMO -0.20%) also ended the session with small losses. Meanwhile, the Networking Index ($NWX +1.08%) led the tech sector higher as the Semiconductor Index ($SOX +0.54%) and Biotechnology Index ($BTK +0.67%) followed with smaller gains.
Charts courtesy www.stockcharts.com
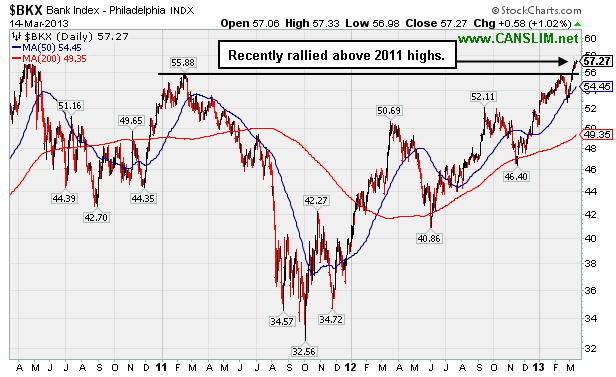
PICTURED: The Bank Index ($BKX +0.56%) recently rallied above its 2011 highs. Ongoing strength in the financial group is a "leading indicator" that continues to bode well for the broader market's outlook.
| Oil Services |
$OSX |
247.77 |
+3.60 |
+1.47% |
+12.54% |
| Healthcare |
$HMO |
2,786.95 |
-5.55 |
-0.20% |
+10.85% |
| Integrated Oil |
$XOI |
1,362.93 |
+14.92 |
+1.11% |
+9.75% |
| Semiconductor |
$SOX |
441.53 |
+2.39 |
+0.54% |
+14.96% |
| Networking |
$NWX |
242.20 |
+2.58 |
+1.08% |
+6.91% |
| Internet |
$IIX |
367.77 |
-1.46 |
-0.39% |
+12.47% |
| Broker/Dealer |
$XBD |
111.19 |
+0.01 |
+0.01% |
+17.87% |
| Retail |
$RLX |
725.71 |
-4.90 |
-0.67% |
+11.12% |
| Gold & Silver |
$XAU |
133.96 |
+1.36 |
+1.03% |
-19.11% |
| Bank |
$BKX |
57.27 |
+0.32 |
+0.56% |
+11.68% |
| Biotech |
$BTK |
1,811.39 |
+12.07 |
+0.67% |
+17.09% |
|
|
|
 |
Hit New High With 4.5 Times Average Volume Behind Gain
Kenneth J. Gruneisen - Passed the CAN SLIM® Master's Exam
Often, when a leading stock is breaking out of a solid base it is highlighted in CANSLIM.net's Mid-Day Breakouts Report. The most relevant factors are noted in the report which alerts prudent CANSLIM oriented investors. After doing any necessary backup research, the investor is prepared to act. Disciplined investors know to buy as near as possible to the pivot point and avoid chasing stocks after they have rallied more than +5% above their pivot point. It is crucial to always limit losses whenever any stock heads the wrong direction, and disciplined investors sell if a struggling stock ever falls more than -7% from their purchase price.
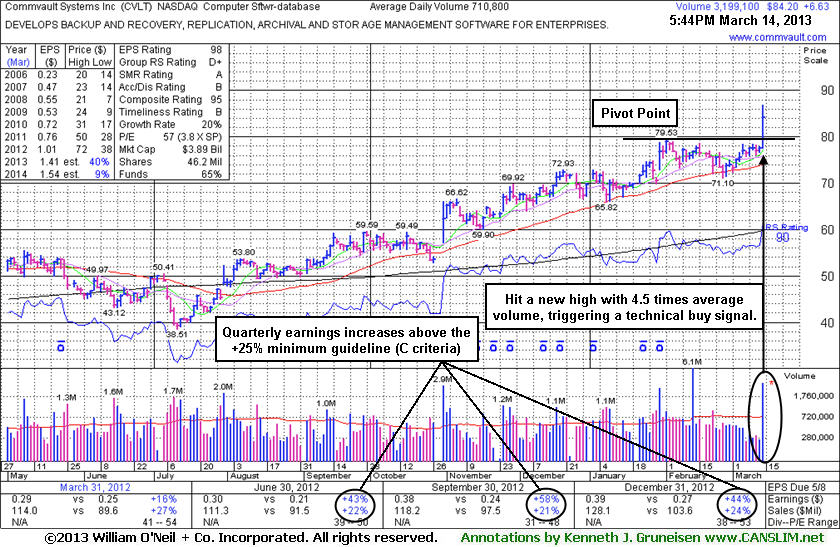
Commvault Systems Inc (CVLT +$6.63 or +8.55% to $84.20) was highlighted in yellow with pivot point cited based on its 2/01/13 high plus 10 cents in the earlier mid-day report (read here). It hit new 52-week highs (N criteria) with 4.5 times average volume behind today's considerable volume-driven gain while quickly rising well above its pivot point triggering a technical buy signal. It found support at its 50-day moving average (DMA) line during its orderly consolidation since last noted in the 1/30/13 mid-day report - "Reported earnings +44% on +24% sales revenues for the Dec '12 quarter, its 3rd consecutive quarter with earnings above the +25% minimum guideline (C criteria). Annual earnings (A criteria) growth has been improving since a minor downturn in FY '09. It made a choppy ascent after sputtering when dropped from the Featured Stocks list on 7/13/10."
The high-ranked Computer Software - Database firm's annual earnings (A criteria) history includes a slight downward turn in FY '09, yet it has an impressive history and recent quarters showed accelerating sales revenues and earnings increases with +25% earnings increases or greater in the past 3 comparisons versus the year ago period. The number of top-rated funds owning its shares rose from 459 in Mar '12 to 516 in Dec '12, a reassuring sign concerning the I criteria. Its current Up/Down volume ratio of 1.5 is an unbiased indication that its shares have been under accumulation over the past 50 days. The Computer Software - Database industry group's low Group Relative Strength Rating is a concern, however leadership from at least one other stock in the group is a somewhat reassuring sign concerning the L criteria. Disciplined investors avoid chasing stocks more than +5% above their prior highs and always limit losses by selling if any stock falls more than -7% from their purchase price.
|
|
|
Color Codes Explained :
Y - Better candidates highlighted by our
staff of experts.
G - Previously featured
in past reports as yellow but may no longer be buyable under the
guidelines.
***Last / Change / Volume data in this table is the closing quote data***
Symbol/Exchange
Company Name
Industry Group |
PRICE |
CHANGE
(%Change) |
Day High |
Volume
(% DAV)
(% 50 day avg vol) |
52 Wk Hi
% From Hi |
Featured
Date |
Price
Featured |
Pivot Featured |
|
Max Buy |
CELG
-
NASDAQ
Celgene Corp
DRUGS - Drug Manufacturers - Major
|
$114.28
|
+1.21
1.07% |
$115.44
|
3,011,961
75.90% of 50 DAV
50 DAV is 3,968,100
|
$114.00
0.25%
|
12/11/2012
|
$82.24
|
PP = $81.34
|
|
MB = $85.41
|
Most Recent Note - 3/12/2013 1:09:23 PM
G - Wedging further into new all-time high territory with today's 6th consecutive gain, getting very extended from any sound base. Its 50 DMA line defines important support to watch.
>>> The latest Featured Stock Update with an annotated graph appeared on 2/28/2013. Click here.
View all notes |
Alert me of new notes |
CANSLIM.net Company Profile |
SEC |
Zacks Reports |
StockTalk |
News |
Chart |
Request a new note
C
A N
S L
I M


|
CFNL
-
NASDAQ
Cardinal Financial Corp
BANKING - Regional - Southeast Banks
|
$17.85
|
+0.10
0.56% |
$17.95
|
159,126
73.16% of 50 DAV
50 DAV is 217,500
|
$18.19
-1.87%
|
3/7/2013
|
$17.27
|
PP = $16.77
|
|
MB = $17.61
|
Most Recent Note - 3/8/2013 12:13:11 PM
Y - Gapped up and hit another new 52-week high while trading near its "max buy" level with above average volume behind today's 7th consecutive gain. Prior session's gain was backed by volume +169% above average as it rose above the new pivot point cited based upon its 2/15/13 high, clearing a "double bottom" base and triggering a proper technical buy signal under the fact-based system.
>>> The latest Featured Stock Update with an annotated graph appeared on 2/21/2013. Click here.
View all notes |
Alert me of new notes |
CANSLIM.net Company Profile |
SEC |
Zacks Reports |
StockTalk |
News |
Chart |
Request a new note
C
A N
S L
I M
|
CMCSA
-
NASDAQ
Comcast Corp Cl A
MEDIA - CATV Systems
|
$41.16
|
+0.57
1.40% |
$41.24
|
14,185,792
103.56% of 50 DAV
50 DAV is 13,698,300
|
$42.00
-2.00%
|
12/3/2012
|
$37.08
|
PP = $38.06
|
|
MB = $39.96
|
Most Recent Note - 3/12/2013 1:11:32 PM
G - Volume totals have been cooling in recent weeks while consolidating above support at its 50 DMA line, still perched very near its 52-week high. Reported earnings +11% on +6% sales revenues for the Dec '12 quarter, below the +25% minimum earnings guideline (C criteria), raising fundamental concerns
>>> The latest Featured Stock Update with an annotated graph appeared on 2/19/2013. Click here.
View all notes |
Alert me of new notes |
CANSLIM.net Company Profile |
SEC |
Zacks Reports |
StockTalk |
News |
Chart |
Request a new note
C
A N
S L
I M
|
CVLT
-
NASDAQ
Commvault Systems Inc
COMPUTER SOFTWARE and SERVICES - Business Software and Services
|
$84.20
|
+6.63
8.55% |
$86.89
|
3,200,421
450.26% of 50 DAV
50 DAV is 710,800
|
$79.53
5.87%
|
3/14/2013
|
$84.71
|
PP = $79.63
|
|
MB = $83.61
|
 Most Recent Note - 3/14/2013 6:09:38 PM
Y - Finished the session with a solid gain backed by 4.5 times average volume while clearing the pivot point cited based on its 2/01/13 high plus 10 cents and hitting new 52-week highs. Found support at its 50 DMA line during its orderly consolidation. See the latest FSU analysis for more details and a new annotated graph.
>>> The latest Featured Stock Update with an annotated graph appeared on 3/14/2013. Click here.
View all notes |
Alert me of new notes |
CANSLIM.net Company Profile |
SEC |
Zacks Reports |
StockTalk |
News |
Chart |
Request a new note
C
A N
S L
I M
|
EVER
-
NYSE
Everbank Financial Corp
BANKING
|
$15.64
|
+0.07
0.45% |
$15.80
|
595,778
71.01% of 50 DAV
50 DAV is 839,000
|
$17.29
-9.54%
|
3/4/2013
|
$15.38
|
PP = $15.83
|
|
MB = $16.62
|
Most Recent Note - 3/12/2013 1:47:11 PM
Y - Violated prior highs in the $16 area noted as initial chart support to watch, raising concerns. Slumped below its pivot point and briefly undercut its 50 DMA line before rebounding from the morning's lows.
>>> The latest Featured Stock Update with an annotated graph appeared on 3/4/2013. Click here.
View all notes |
Alert me of new notes |
CANSLIM.net Company Profile |
SEC |
Zacks Reports |
StockTalk |
News |
Chart |
Request a new note
C
A N
S L
I M
|
Symbol/Exchange
Company Name
Industry Group |
PRICE |
CHANGE
(%Change) |
Day High |
Volume
(% DAV)
(% 50 day avg vol) |
52 Wk Hi
% From Hi |
Featured
Date |
Price
Featured |
Pivot Featured |
|
Max Buy |
JAZZ
-
NASDAQ
Jazz Pharmaceuticals Plc
DRUGS - Biotechnology
|
$59.11
|
-0.09
-0.15% |
$59.76
|
450,984
85.97% of 50 DAV
50 DAV is 524,600
|
$60.79
-2.76%
|
3/5/2013
|
$59.10
|
PP = $60.10
|
|
MB = $63.11
|
Most Recent Note - 3/11/2013 12:25:09 PM
Y - Holding its ground since completing a Secondary Offering on 3/05/13. Disciplined investors may watch for a volume-driven gain above the pivot point to trigger a technical buy signal before new buying efforts may be justified under the fact-based investment system. See the latest FSU analysis for more details and a new annotated graph.
>>> The latest Featured Stock Update with an annotated graph appeared on 3/7/2013. Click here.
View all notes |
Alert me of new notes |
CANSLIM.net Company Profile |
SEC |
Zacks Reports |
StockTalk |
News |
Chart |
Request a new note
C
A N
S L
I M
|
KORS
-
NYSE
Michael Kors Hldgs Ltd
RETAIL - Apparel Stores
|
$58.05
|
-0.46
-0.79% |
$59.41
|
4,835,382
81.23% of 50 DAV
50 DAV is 5,952,900
|
$65.10
-10.83%
|
1/23/2013
|
$54.98
|
PP = $58.72
|
|
MB = $61.66
|
Most Recent Note - 3/13/2013 7:52:22 PM
Y - Color code is changed to yellow after rebounding above its 50 DMA line with today's volume-driven gain, improving its technical stance. Completed another Secondary Offering 2/20/13 while perched near its all-time high.
>>> The latest Featured Stock Update with an annotated graph appeared on 3/8/2013. Click here.
View all notes |
Alert me of new notes |
CANSLIM.net Company Profile |
SEC |
Zacks Reports |
StockTalk |
News |
Chart |
Request a new note
C
A N
S L
I M
|
LNKD
-
NYSE
Linkedin Corp Class A
INTERNET - Internet Information Providers
|
$179.85
|
+0.58
0.32% |
$184.15
|
2,356,104
97.34% of 50 DAV
50 DAV is 2,420,400
|
$181.45
-0.88%
|
2/8/2013
|
$147.04
|
PP = $127.55
|
|
MB = $133.93
|
Most Recent Note - 3/14/2013 12:37:16 PM
G - Hit yet another new high with today's gain. Repeatedly noted - "Very extended from its prior base, but having rallied more than +20% in the first 2-3 weeks after its breakout, the investment system rules suggest holding such winners for a minimum of 8 weeks. See the latest FSU analysis for more details and a new annotated graph."
>>> The latest Featured Stock Update with an annotated graph appeared on 3/11/2013. Click here.
View all notes |
Alert me of new notes |
CANSLIM.net Company Profile |
SEC |
Zacks Reports |
StockTalk |
News |
Chart |
Request a new note
C
A N
S L
I M
|
LOPE
-
NASDAQ
Grand Canyon Education
DIVERSIFIED SERVICES - Education and; Training Services
|
$24.34
|
+0.21
0.87% |
$24.39
|
200,850
42.99% of 50 DAV
50 DAV is 467,200
|
$27.18
-10.45%
|
2/20/2013
|
$26.44
|
PP = $25.10
|
|
MB = $26.36
|
Most Recent Note - 3/13/2013 7:49:45 PM
G - Consolidating near its 50 DMA line with volume totals cooling in recent weeks after it quickly negated the prior technical breakout. It has not formed a sound new base. See the latest FSU analysis for more details and a new annotated graph.
>>> The latest Featured Stock Update with an annotated graph appeared on 3/13/2013. Click here.
View all notes |
Alert me of new notes |
CANSLIM.net Company Profile |
SEC |
Zacks Reports |
StockTalk |
News |
Chart |
Request a new note
C
A N
S L
I M
|
MIDD
-
NASDAQ
Middleby Corp
MANUFACTURING - Diversified Machinery
|
$149.87
|
+0.26
0.17% |
$150.95
|
110,727
121.15% of 50 DAV
50 DAV is 91,400
|
$154.74
-3.15%
|
10/8/2012
|
$118.46
|
PP = $122.67
|
|
MB = $128.80
|
Most Recent Note - 3/12/2013 1:52:24 PM
G - Still hovering near all-time highs today with volume totals cooling. Fundamental concerns were recently noted. Its 50 DMA line defines important near-term chart support.
>>> The latest Featured Stock Update with an annotated graph appeared on 2/25/2013. Click here.
View all notes |
Alert me of new notes |
CANSLIM.net Company Profile |
SEC |
Zacks Reports |
StockTalk |
News |
Chart |
Request a new note
C
A N
S L
I M
|
Symbol/Exchange
Company Name
Industry Group |
PRICE |
CHANGE
(%Change) |
Day High |
Volume
(% DAV)
(% 50 day avg vol) |
52 Wk Hi
% From Hi |
Featured
Date |
Price
Featured |
Pivot Featured |
|
Max Buy |
MWIV
-
NASDAQ
M W I Veterinary Supply
HEALTH SERVICES - Medical Instruments and; Supplies
|
$129.98
|
-0.75
-0.57% |
$130.99
|
54,093
97.11% of 50 DAV
50 DAV is 55,700
|
$137.18
-5.25%
|
3/4/2013
|
$130.90
|
PP = $129.45
|
|
MB = $135.92
|
Most Recent Note - 3/11/2013 6:13:30 PM
Y - Fell with above average volume today, its 2nd distribution day since hitting its all-time high last week. Color code is changed to yellow after retreating below its "max buy" level. Subsequent deterioration below its pivot point would raise concerns and could negate its latest breakout.
>>> The latest Featured Stock Update with an annotated graph appeared on 3/6/2013. Click here.
View all notes |
Alert me of new notes |
CANSLIM.net Company Profile |
SEC |
Zacks Reports |
StockTalk |
News |
Chart |
Request a new note
C
A N
S L
I M
|
N
-
NYSE
Netsuite Inc
DIVERSIFIED SERVICES - Business/Management Services
|
$76.61
|
+1.61
2.15% |
$76.93
|
303,320
86.34% of 50 DAV
50 DAV is 351,300
|
$75.75
1.14%
|
12/12/2012
|
$64.75
|
PP = $67.12
|
|
MB = $70.48
|
Most Recent Note - 3/8/2013 1:10:41 PM
G - Perched at its 52-week and all-time high, holding its ground following a streak of 7 consecutive volume-driven gains. Its 50 DMA line acted as support during the recent consolidation.
>>> The latest Featured Stock Update with an annotated graph appeared on 3/1/2013. Click here.
View all notes |
Alert me of new notes |
CANSLIM.net Company Profile |
SEC |
Zacks Reports |
StockTalk |
News |
Chart |
Request a new note
C
A N
S L
I M
|
NSR
-
NYSE
Neustar Inc
TELECOMMUNICATIONS - Diversified Communication Serv
|
$46.58
|
+1.32
2.92% |
$46.73
|
647,230
148.21% of 50 DAV
50 DAV is 436,700
|
$47.24
-1.40%
|
3/8/2013
|
$44.99
|
PP = $47.34
|
|
MB = $49.71
|
Most Recent Note - 3/14/2013 6:17:52 PM
Y - Gapped up and tallied a considerable gain with above average volume, rebounding near its 52-week high. Color code was changed to yellow with new pivot point cited based on its 2/27/13 high plus 10 cents while forming a "square box" base. Volume-driven gains above the pivot point may trigger a new (or add-on) technical buy signal. The 2/21/13 low ($42.40) defines important near-term support where any subsequent deterioration would raise greater concerns and trigger a worrisome technical sell signal.
>>> The latest Featured Stock Update with an annotated graph appeared on 2/27/2013. Click here.
View all notes |
Alert me of new notes |
CANSLIM.net Company Profile |
SEC |
Zacks Reports |
StockTalk |
News |
Chart |
Request a new note
C
A N
S L
I M
|
QIHU
-
NYSE
Qihoo 360 Technology Ads
INTERNET - Internet Service Providers
|
$28.71
|
-0.85
-2.88% |
$30.33
|
4,699,737
181.21% of 50 DAV
50 DAV is 2,593,500
|
$34.90
-17.74%
|
3/5/2013
|
$34.63
|
PP = $34.47
|
|
MB = $36.19
|
Most Recent Note - 3/14/2013 6:15:49 PM
Slumped further below its 50 DMA line today and undercut prior lows raising more serious concerns with its loss on higher volume. Recently reported earnings +10% on +65% sales revenues for the Dec '12 quarter, below the +25% minimum earnings guideline (C criteria) raising fundamental concerns. Based on deterioration both fundamentally and technically it will be dropped from the Featured Stocks list tonight.
>>> The latest Featured Stock Update with an annotated graph appeared on 3/5/2013. Click here.
View all notes |
Alert me of new notes |
CANSLIM.net Company Profile |
SEC |
Zacks Reports |
StockTalk |
News |
Chart |
Request a new note
C
A N
S L
I M
|
SLCA
-
NYSE
U S Silica Holdings Inc
CHEMICALS - Specialty Chemicals
|
$21.70
|
-1.09
-4.78% |
$22.20
|
9,259,021
1,524.87% of 50 DAV
50 DAV is 607,200
|
$28.50
-23.86%
|
2/26/2013
|
$22.23
|
PP = $21.50
|
|
MB = $22.58
|
Most Recent Note - 3/14/2013 6:11:44 PM
G - Gapped down today after pricing the recently noted Secondary Offering after a spurt of volume-driven gains into new 52-week high territory. Previously noted - "Very extended from its prior base, but having rallied more than +20% in the first 2-3 weeks after its breakout, the investment system rules suggest holding such winners for a minimum of 8 weeks."
>>> The latest Featured Stock Update with an annotated graph appeared on 2/26/2013. Click here.
View all notes |
Alert me of new notes |
CANSLIM.net Company Profile |
SEC |
Zacks Reports |
StockTalk |
News |
Chart |
Request a new note
C
A N
S L
I M
|
Symbol/Exchange
Company Name
Industry Group |
PRICE |
CHANGE
(%Change) |
Day High |
Volume
(% DAV)
(% 50 day avg vol) |
52 Wk Hi
% From Hi |
Featured
Date |
Price
Featured |
Pivot Featured |
|
Max Buy |
VRX
-
NYSE
Valeant Pharmaceuticals
DRUGS - Drug Manufacturers - Other
|
$70.07
|
+0.14
0.20% |
$70.47
|
1,249,668
96.22% of 50 DAV
50 DAV is 1,298,800
|
$71.49
-1.99%
|
12/20/2012
|
$60.24
|
PP = $61.21
|
|
MB = $64.27
|
Most Recent Note - 3/12/2013 2:00:03 PM
Y - Wedged higher with recent gains lacking great volume conviction, and holding its ground stubbornly. A valid secondary buy point exists following the successful test of support at its 10-week moving average up to as high as +5% above the recent high ($67.98 plus 5% or $71.38). Color code was changed to yellow however no new pivot point was cited since a new base was not formed. The 50 DMA line and recent low ($64.05 on 2/21/13) define important support areas to watch.
>>> The latest Featured Stock Update with an annotated graph appeared on 3/12/2013. Click here.
View all notes |
Alert me of new notes |
CANSLIM.net Company Profile |
SEC |
Zacks Reports |
StockTalk |
News |
Chart |
Request a new note
C
A N
S L
I M
|
|
|
|
THESE ARE NOT BUY RECOMMENDATIONS!
Comments contained in the body of this report are technical
opinions only. The material herein has been obtained
from sources believed to be reliable and accurate, however,
its accuracy and completeness cannot be guaranteed.
This site is not an investment advisor, hence it does
not endorse or recommend any securities or other investments.
Any recommendation contained in this report may not
be suitable for all investors and it is not to be deemed
an offer or solicitation on our part with respect to
the purchase or sale of any securities. All trademarks,
service marks and trade names appearing in this report
are the property of their respective owners, and are
likewise used for identification purposes only.
This report is a service available
only to active Paid Premium Members.
You may opt-out of receiving report notifications
at any time. Questions or comments may be submitted
by writing to Premium Membership Services 665 S.E. 10 Street, Suite 201 Deerfield Beach, FL 33441-5634 or by calling 1-800-965-8307
or 954-785-1121.
|
|
|

