You are not logged in.
This means you
CAN ONLY VIEW reports that were published prior to Monday, April 14, 2025.
You
MUST UPGRADE YOUR MEMBERSHIP if you want to see any current reports.
AFTER MARKET UPDATE - WEDNESDAY, MARCH 13TH, 2013
Previous After Market Report Next After Market Report >>>
|
|
|
|
DOW |
+5.22 |
14,455.28 |
+0.04% |
|
Volume |
584,688,580 |
-6% |
|
Volume |
1,517,132,070 |
-5% |
|
NASDAQ |
+2.80 |
3,245.12 |
+0.09% |
|
Advancers |
1,689 |
54% |
|
Advancers |
1,384 |
54% |
|
S&P 500 |
+2.04 |
1,554.52 |
+0.13% |
|
Decliners |
1,300 |
42% |
|
Decliners |
1,046 |
41% |
|
Russell 2000 |
+3.64 |
943.90 |
+0.39% |
|
52 Wk Highs |
255 |
|
|
52 Wk Highs |
149 |
|
|
S&P 600 |
+2.60 |
526.08 |
+0.50% |
|
52 Wk Lows |
17 |
|
|
52 Wk Lows |
19 |
|
|
 |
Major Averages Edge Higher Again on Lighter Volume
Kenneth J. Gruneisen - Passed the CAN SLIM® Master's Exam
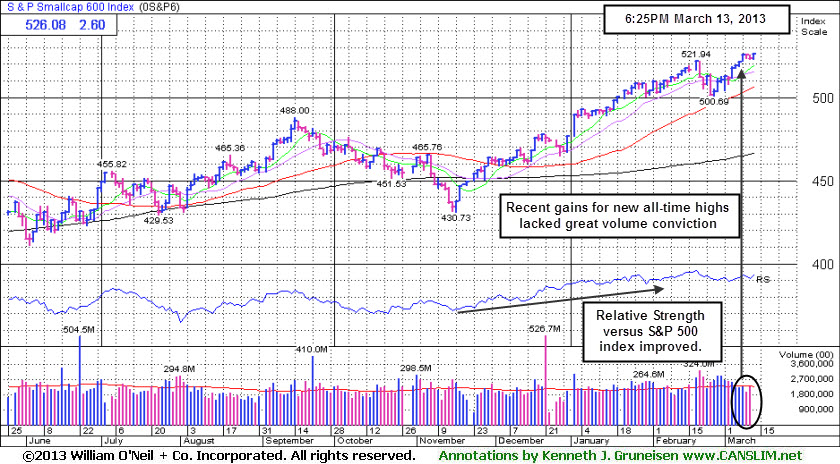
The major indices managed to eke out minor gains on Wednesday's quiet session. The volume totals reported were lighter than the prior session totals on the NYSE and on the Nasdaq exchange. Breadth was positive as advancers led decliners by a 4-3 margin on the NYSE and by a 9-7 margin on the Nasdaq exchange. The total number of stocks hitting new 52-week highs still solidly outnumbered new 52-week lows on the NYSE and on the Nasdaq exchange. There were 68 high-ranked companies from the CANSLIM.net Leaders List making new 52-week highs and appearing on the CANSLIM.net BreakOuts Page, up from the prior session's total of 48 stocks. However, there were gains for only 3 of the 15 high-ranked companies currently included on the Featured Stocks Page, a disconcertingly negative balance versus the broader market's positive bias.
The Dow Jones Industrial Average set an all-time record close for the 9th straight day while Washington's budget battle garnered attention and President Obama warned that it may be impossible to reach a budget deal with congressional Republicans. Stocks were choppy in early trading as investors digested a batch of economic reports. Looking at the data, February retail sales advanced the most in five months and were stronger than expected, rising +1.1%. In addition, signs of a pickup in consumer demand led to the best business inventories report since May 2011. Separately, February import and export prices (+1.1%) and January business inventories increased by the most in six months and more than projected.
Overall, sectors finished mixed. Consumer Discretionary was one of the best performing groups, led by Netflix Inc (NFLX +5.63) after it unveiled new social features. Losses in Materials limited the indices' gains as Cliffs Natural Resources (CLF -4.86%) tumbled. On the earnings front, Dole Foods Company Inc (DOLE -9.04%) and apparel retailer Express Inc (EXPR -3.18%) suffered losses after both companies fell short of analysts' projections. The above mentioned companies do not match the fact-based investment system's guidelines. Noteworthy high-ranked leaders are included on the Featured Stocks Page.
In fixed-income, Treasury prices pared early losses after a solid 10-year note auction. The 10-year note was down 2/32 to yield 2.02% and the 30-year bond lost 4/32 to yield 3.22%.
New buying efforts are justified under the fact-based system since a follow-through day on 3/05/13 shifted the market's (M criteria) direction to a confirmed rally again after a brief correction. Any sustainable rally requires a healthy crop of companies hitting new 52-week highs, so it is always essential to see meaningful leadership (stocks hitting new 52-week highs).
Watch for an announcement via email concerning the next WEBCAST. The webcast will also be available via an updated link highlighted at the top of the Premium Member Homepage.
PICTURED: The S&P 600 Small Cap Index recently wedged to new all-time highs with gains lacking great volume conviction. An encouraging sign for fans of the fact-based system's is the way the small cap index's improving Relative Strength line is plotted versus the benchmark S&P 500 Index (see jagged blue line). The system of stock selection focuses on smaller stocks which are being discovered by institutional investors.
|
 Kenneth J. Gruneisen started out as a licensed stockbroker in August 1987, a couple of months prior to the historic stock market crash that took the Dow Jones Industrial Average down -22.6% in a single day. He has published daily fact-based fundamental and technical analysis on high-ranked stocks online for two decades. Through FACTBASEDINVESTING.COM, Kenneth provides educational articles, news, market commentary, and other information regarding proven investment systems that work in good times and bad.
Comments contained in the body of this report are technical opinions only and are not necessarily those of Gruneisen Growth Corp. The material herein has been obtained from sources believed to be reliable and accurate, however, its accuracy and completeness cannot be guaranteed. Our firm, employees, and customers may effect transactions, including transactions contrary to any recommendation herein, or have positions in the securities mentioned herein or options with respect thereto. Any recommendation contained in this report may not be suitable for all investors and it is not to be deemed an offer or solicitation on our part with respect to the purchase or sale of any securities. |
|
 |
Retail and Financial Groups Rose and Commodity-Linked Groups Fell
Kenneth J. Gruneisen - Passed the CAN SLIM® Master's Exam
The Retail Index ($RLX +0.49%) was a positive influence on the major averages along with strength in financial shares as the Bank Index ($BKX +0.46%) and Broker/Dealer Index ($XBD +1.05%) tallied gains on Wednesday. The Networking Index ($NWX -0.90%) fell and the Biotechnology Index ($BTK +0.06%) finished flat while the Semiconductor Index ($SOX +0.34%) and the Internet Index ($IIX +0.43%) posted modest gains and the Healthcare Index ($HMO +0.56%) rose. Meanwhile, commodity-linked groups lost ground as the Integrated Oil Index ($XOI -0.50%) and the Oil Services Index ($OSX -0.25%) edged lower, and the Gold & Silver Index ($XAU -2.70%) was a standout decliner.
Charts courtesy www.stockcharts.com
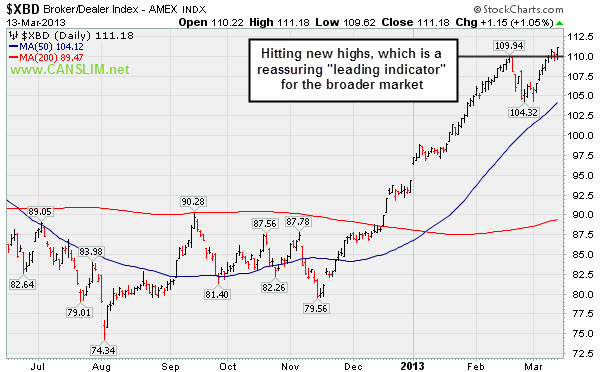
PICTURED: The Broker/Dealer Index ($XBD +1.05%) is ralllying to new highs, which is a reassuring "leading indicator" for the broader market
| Oil Services |
$OSX |
244.17 |
-0.62 |
-0.25% |
+10.91% |
| Healthcare |
$HMO |
2,792.50 |
+15.58 |
+0.56% |
+11.07% |
| Integrated Oil |
$XOI |
1,348.01 |
-6.78 |
-0.50% |
+8.55% |
| Semiconductor |
$SOX |
439.14 |
+1.47 |
+0.34% |
+14.34% |
| Networking |
$NWX |
239.62 |
-2.18 |
-0.90% |
+5.77% |
| Internet |
$IIX |
369.23 |
+1.59 |
+0.43% |
+12.91% |
| Broker/Dealer |
$XBD |
111.18 |
+1.15 |
+1.05% |
+17.86% |
| Retail |
$RLX |
730.61 |
+3.58 |
+0.49% |
+11.87% |
| Gold & Silver |
$XAU |
132.60 |
-3.68 |
-2.70% |
-19.93% |
| Bank |
$BKX |
56.95 |
+0.26 |
+0.46% |
+11.06% |
| Biotech |
$BTK |
1,799.33 |
+1.11 |
+0.06% |
+16.31% |
|
|
|
 |
Weakening Relative Strength After Negating Breakout
Kenneth J. Gruneisen - Passed the CAN SLIM® Master's Exam
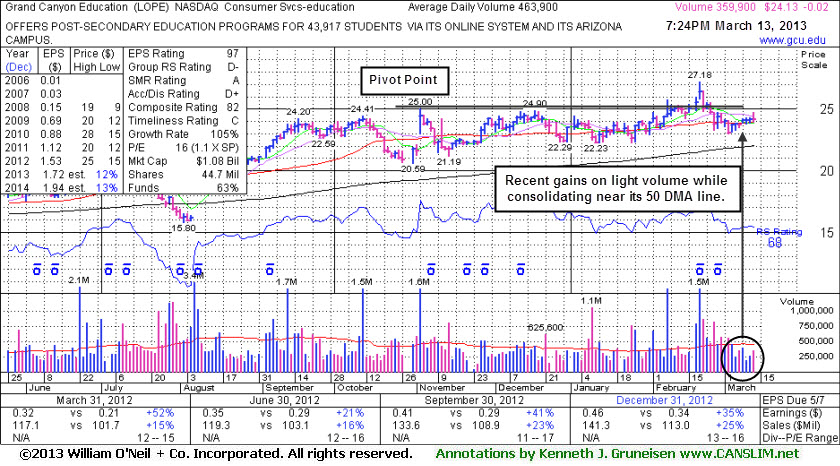
Grand Canyon Education (LOPE -$0.02 or -0.08% to $24.13) is consolidating above its 50-day moving average (DMA) line with volume totals cooling in recent weeks after it quickly negated the prior technical breakout. It has not formed a sound new base. It was last shown in this FSU section on 2/20/13 with an annotated graph under the headline, "Follow Up Gains on Higher Volume Clinched Technical Breakout", while rising above the pivot point based on its 11/02/12 high plus 10 cents in the earlier mid-day report (read here). It did not reach the previously noted all-time high ($28.46 in April 2010). Its Relative Strength Rating (68) has slumped below the 80+ minimum guideline for buy candidates under the fact-based investment system. The Commercial Services - Schools group (L criteria) now has a D- Rating, down from a B- when last shown. Disciplined investors always liimit losses if any stock falls more than -7% from their purchase price.
It most recently reported earnings +35% on +25% sales revenues for the Dec '12 quarter, and earnings increases were above the +25% minimum earnings guideline (C criteria) in 3 of the past 4 quarterly comparisons. The number of top-rated funds owning its shares rose from 200 in Mar '12 to 259 in Dec '12, a reassuring trend concerning the I criteria. Its current Up/Down Volume Ratio of 1.2 is still an unbiased indication that its shares have been under accumulation over the past 50 days.
|
|
|
Color Codes Explained :
Y - Better candidates highlighted by our
staff of experts.
G - Previously featured
in past reports as yellow but may no longer be buyable under the
guidelines.
***Last / Change / Volume data in this table is the closing quote data***
Symbol/Exchange
Company Name
Industry Group |
PRICE |
CHANGE
(%Change) |
Day High |
Volume
(% DAV)
(% 50 day avg vol) |
52 Wk Hi
% From Hi |
Featured
Date |
Price
Featured |
Pivot Featured |
|
Max Buy |
CELG
-
NASDAQ
Celgene Corp
DRUGS - Drug Manufacturers - Major
|
$113.07
|
-0.65
-0.57% |
$114.00
|
3,288,545
83.62% of 50 DAV
50 DAV is 3,932,700
|
$113.88
-0.71%
|
12/11/2012
|
$82.24
|
PP = $81.34
|
|
MB = $85.41
|
Most Recent Note - 3/12/2013 1:09:23 PM
G - Wedging further into new all-time high territory with today's 6th consecutive gain, getting very extended from any sound base. Its 50 DMA line defines important support to watch.
>>> The latest Featured Stock Update with an annotated graph appeared on 2/28/2013. Click here.
View all notes |
Alert me of new notes |
CANSLIM.net Company Profile |
SEC |
Zacks Reports |
StockTalk |
News |
Chart |
Request a new note
C
A N
S L
I M


|
CFNL
-
NASDAQ
Cardinal Financial Corp
BANKING - Regional - Southeast Banks
|
$17.75
|
+0.00
0.00% |
$17.81
|
238,712
111.29% of 50 DAV
50 DAV is 214,500
|
$18.19
-2.42%
|
3/7/2013
|
$17.27
|
PP = $16.77
|
|
MB = $17.61
|
Most Recent Note - 3/8/2013 12:13:11 PM
Y - Gapped up and hit another new 52-week high while trading near its "max buy" level with above average volume behind today's 7th consecutive gain. Prior session's gain was backed by volume +169% above average as it rose above the new pivot point cited based upon its 2/15/13 high, clearing a "double bottom" base and triggering a proper technical buy signal under the fact-based system.
>>> The latest Featured Stock Update with an annotated graph appeared on 2/21/2013. Click here.
View all notes |
Alert me of new notes |
CANSLIM.net Company Profile |
SEC |
Zacks Reports |
StockTalk |
News |
Chart |
Request a new note
C
A N
S L
I M
|
CMCSA
-
NASDAQ
Comcast Corp Cl A
MEDIA - CATV Systems
|
$40.59
|
-0.13
-0.32% |
$40.82
|
8,661,817
63.33% of 50 DAV
50 DAV is 13,676,800
|
$42.00
-3.36%
|
12/3/2012
|
$37.08
|
PP = $38.06
|
|
MB = $39.96
|
Most Recent Note - 3/12/2013 1:11:32 PM
G - Volume totals have been cooling in recent weeks while consolidating above support at its 50 DMA line, still perched very near its 52-week high. Reported earnings +11% on +6% sales revenues for the Dec '12 quarter, below the +25% minimum earnings guideline (C criteria), raising fundamental concerns
>>> The latest Featured Stock Update with an annotated graph appeared on 2/19/2013. Click here.
View all notes |
Alert me of new notes |
CANSLIM.net Company Profile |
SEC |
Zacks Reports |
StockTalk |
News |
Chart |
Request a new note
C
A N
S L
I M
|
EVER
-
NYSE
Everbank Financial Corp
BANKING
|
$15.57
|
-0.01
-0.06% |
$15.91
|
1,599,543
196.34% of 50 DAV
50 DAV is 814,700
|
$17.29
-9.95%
|
3/4/2013
|
$15.38
|
PP = $15.83
|
|
MB = $16.62
|
Most Recent Note - 3/12/2013 1:47:11 PM
Y - Violated prior highs in the $16 area noted as initial chart support to watch, raising concerns. Slumped below its pivot point and briefly undercut its 50 DMA line before rebounding from the morning's lows.
>>> The latest Featured Stock Update with an annotated graph appeared on 3/4/2013. Click here.
View all notes |
Alert me of new notes |
CANSLIM.net Company Profile |
SEC |
Zacks Reports |
StockTalk |
News |
Chart |
Request a new note
C
A N
S L
I M
|
JAZZ
-
NASDAQ
Jazz Pharmaceuticals Plc
DRUGS - Biotechnology
|
$59.20
|
-0.22
-0.37% |
$59.96
|
640,529
123.82% of 50 DAV
50 DAV is 517,300
|
$60.79
-2.62%
|
3/5/2013
|
$59.10
|
PP = $60.10
|
|
MB = $63.11
|
Most Recent Note - 3/11/2013 12:25:09 PM
Y - Holding its ground since completing a Secondary Offering on 3/05/13. Disciplined investors may watch for a volume-driven gain above the pivot point to trigger a technical buy signal before new buying efforts may be justified under the fact-based investment system. See the latest FSU analysis for more details and a new annotated graph.
>>> The latest Featured Stock Update with an annotated graph appeared on 3/7/2013. Click here.
View all notes |
Alert me of new notes |
CANSLIM.net Company Profile |
SEC |
Zacks Reports |
StockTalk |
News |
Chart |
Request a new note
C
A N
S L
I M
|
Symbol/Exchange
Company Name
Industry Group |
PRICE |
CHANGE
(%Change) |
Day High |
Volume
(% DAV)
(% 50 day avg vol) |
52 Wk Hi
% From Hi |
Featured
Date |
Price
Featured |
Pivot Featured |
|
Max Buy |
KORS
-
NYSE
Michael Kors Hldgs Ltd
RETAIL - Apparel Stores
|
$58.51
|
+2.23
3.96% |
$58.88
|
7,860,073
134.12% of 50 DAV
50 DAV is 5,860,500
|
$65.10
-10.12%
|
1/23/2013
|
$54.98
|
PP = $58.72
|
|
MB = $61.66
|
 Most Recent Note - 3/13/2013 7:52:22 PM
Y - Color code is changed to yellow after rebounding above its 50 DMA line with today's volume-driven gain, improving its technical stance. Completed another Secondary Offering 2/20/13 while perched near its all-time high.
>>> The latest Featured Stock Update with an annotated graph appeared on 3/8/2013. Click here.
View all notes |
Alert me of new notes |
CANSLIM.net Company Profile |
SEC |
Zacks Reports |
StockTalk |
News |
Chart |
Request a new note
C
A N
S L
I M
|
LNKD
-
NYSE
Linkedin Corp Class A
INTERNET - Internet Information Providers
|
$179.27
|
+3.27
1.86% |
$181.45
|
2,299,260
95.71% of 50 DAV
50 DAV is 2,402,200
|
$179.35
-0.04%
|
2/8/2013
|
$147.04
|
PP = $127.55
|
|
MB = $133.93
|
Most Recent Note - 3/11/2013 5:39:34 PM
G - Very extended from its prior base, but having rallied more than +20% in the first 2-3 weeks after its breakout, the investment system rules suggest holding such winners for a minimum of 8 weeks. See the latest FSU analysis for more details and a new annotated graph.
>>> The latest Featured Stock Update with an annotated graph appeared on 3/11/2013. Click here.
View all notes |
Alert me of new notes |
CANSLIM.net Company Profile |
SEC |
Zacks Reports |
StockTalk |
News |
Chart |
Request a new note
C
A N
S L
I M
|
LOPE
-
NASDAQ
Grand Canyon Education
DIVERSIFIED SERVICES - Education and; Training Services
|
$24.13
|
-0.02
-0.08% |
$24.71
|
360,804
77.78% of 50 DAV
50 DAV is 463,900
|
$27.18
-11.22%
|
2/20/2013
|
$26.44
|
PP = $25.10
|
|
MB = $26.36
|
Most Recent Note - 3/13/2013 7:49:45 PM
G - Consolidating near its 50 DMA line with volume totals cooling in recent weeks after it quickly negated the prior technical breakout. It has not formed a sound new base. See the latest FSU analysis for more details and a new annotated graph.
>>> The latest Featured Stock Update with an annotated graph appeared on 3/13/2013. Click here.
View all notes |
Alert me of new notes |
CANSLIM.net Company Profile |
SEC |
Zacks Reports |
StockTalk |
News |
Chart |
Request a new note
C
A N
S L
I M
|
MIDD
-
NASDAQ
Middleby Corp
MANUFACTURING - Diversified Machinery
|
$149.61
|
-0.36
-0.24% |
$150.89
|
36,180
39.37% of 50 DAV
50 DAV is 91,900
|
$154.74
-3.32%
|
10/8/2012
|
$118.46
|
PP = $122.67
|
|
MB = $128.80
|
Most Recent Note - 3/12/2013 1:52:24 PM
G - Still hovering near all-time highs today with volume totals cooling. Fundamental concerns were recently noted. Its 50 DMA line defines important near-term chart support.
>>> The latest Featured Stock Update with an annotated graph appeared on 2/25/2013. Click here.
View all notes |
Alert me of new notes |
CANSLIM.net Company Profile |
SEC |
Zacks Reports |
StockTalk |
News |
Chart |
Request a new note
C
A N
S L
I M
|
MWIV
-
NASDAQ
M W I Veterinary Supply
HEALTH SERVICES - Medical Instruments and; Supplies
|
$130.73
|
-1.16
-0.88% |
$131.92
|
50,372
90.92% of 50 DAV
50 DAV is 55,400
|
$137.18
-4.70%
|
3/4/2013
|
$130.90
|
PP = $129.45
|
|
MB = $135.92
|
Most Recent Note - 3/11/2013 6:13:30 PM
Y - Fell with above average volume today, its 2nd distribution day since hitting its all-time high last week. Color code is changed to yellow after retreating below its "max buy" level. Subsequent deterioration below its pivot point would raise concerns and could negate its latest breakout.
>>> The latest Featured Stock Update with an annotated graph appeared on 3/6/2013. Click here.
View all notes |
Alert me of new notes |
CANSLIM.net Company Profile |
SEC |
Zacks Reports |
StockTalk |
News |
Chart |
Request a new note
C
A N
S L
I M
|
Symbol/Exchange
Company Name
Industry Group |
PRICE |
CHANGE
(%Change) |
Day High |
Volume
(% DAV)
(% 50 day avg vol) |
52 Wk Hi
% From Hi |
Featured
Date |
Price
Featured |
Pivot Featured |
|
Max Buy |
N
-
NYSE
Netsuite Inc
DIVERSIFIED SERVICES - Business/Management Services
|
$75.00
|
-0.20
-0.27% |
$75.66
|
226,566
64.71% of 50 DAV
50 DAV is 350,100
|
$75.75
-0.99%
|
12/12/2012
|
$64.75
|
PP = $67.12
|
|
MB = $70.48
|
Most Recent Note - 3/8/2013 1:10:41 PM
G - Perched at its 52-week and all-time high, holding its ground following a streak of 7 consecutive volume-driven gains. Its 50 DMA line acted as support during the recent consolidation.
>>> The latest Featured Stock Update with an annotated graph appeared on 3/1/2013. Click here.
View all notes |
Alert me of new notes |
CANSLIM.net Company Profile |
SEC |
Zacks Reports |
StockTalk |
News |
Chart |
Request a new note
C
A N
S L
I M
|
NSR
-
NYSE
Neustar Inc
TELECOMMUNICATIONS - Diversified Communication Serv
|
$45.26
|
+0.38
0.85% |
$45.27
|
195,367
44.14% of 50 DAV
50 DAV is 442,600
|
$47.24
-4.19%
|
3/8/2013
|
$44.99
|
PP = $47.34
|
|
MB = $49.71
|
Most Recent Note - 3/8/2013 1:08:01 PM
Y - Consolidating above its 50 DMA line today after small gains this week backed by below average volume. Color code is changed to yellow with new pivot point cited based on its 2/27/13 high plus 10 cents while forming a "square box" base. Volume-driven gains above the pivot point may trigger a new (or add-on) technical buy signal. The 2/21/13 low ($42.40) defines important near-term support where any subsequent deterioration would raise greater concerns and trigger a worrisome technical sell signal.
>>> The latest Featured Stock Update with an annotated graph appeared on 2/27/2013. Click here.
View all notes |
Alert me of new notes |
CANSLIM.net Company Profile |
SEC |
Zacks Reports |
StockTalk |
News |
Chart |
Request a new note
C
A N
S L
I M
|
QIHU
-
NYSE
Qihoo 360 Technology Ads
INTERNET - Internet Service Providers
|
$29.56
|
-1.78
-5.68% |
$31.50
|
3,048,391
118.47% of 50 DAV
50 DAV is 2,573,200
|
$34.90
-15.30%
|
3/5/2013
|
$34.63
|
PP = $34.47
|
|
MB = $36.19
|
Most Recent Note - 3/12/2013 1:56:09 PM
G - Trading just below its 50 DMA line today. Volume totals have cooled since its damaging gap down on 3/06/13 after reporting earnings +10% on +65% sales revenues for the Dec '12 quarter, below the +25% minimum earnings guideline (C criteria) raising fundamental concerns. Color code was changed to green based the sub par results and the abrupt reversal from its new 52-week high. See the latest FSU analysis for more details and a new annotated graph under the headline, "Earnings Below Guideline Raised Concerns After Technical Breakout".
>>> The latest Featured Stock Update with an annotated graph appeared on 3/5/2013. Click here.
View all notes |
Alert me of new notes |
CANSLIM.net Company Profile |
SEC |
Zacks Reports |
StockTalk |
News |
Chart |
Request a new note
C
A N
S L
I M
|
SLCA
-
NYSE
U S Silica Holdings Inc
CHEMICALS - Specialty Chemicals
|
$22.79
|
-1.68
-6.87% |
$24.75
|
1,880,300
328.84% of 50 DAV
50 DAV is 571,800
|
$28.50
-20.04%
|
2/26/2013
|
$22.23
|
PP = $21.50
|
|
MB = $22.58
|
Most Recent Note - 3/12/2013 11:38:44 AM
G - Gapped down today for a large loss after announcing a Secondary Offering after a spurt of volume-driven gains into new 52-week high territory. Previously noted - "Very extended from its prior base, but having rallied more than +20% in the first 2-3 weeks after its breakout, the investment system rules suggest holding such winners for a minimum of 8 weeks."
>>> The latest Featured Stock Update with an annotated graph appeared on 2/26/2013. Click here.
View all notes |
Alert me of new notes |
CANSLIM.net Company Profile |
SEC |
Zacks Reports |
StockTalk |
News |
Chart |
Request a new note
C
A N
S L
I M
|
VRX
-
NYSE
Valeant Pharmaceuticals
DRUGS - Drug Manufacturers - Other
|
$69.93
|
-0.67
-0.95% |
$70.93
|
1,031,780
79.88% of 50 DAV
50 DAV is 1,291,700
|
$71.49
-2.18%
|
12/20/2012
|
$60.24
|
PP = $61.21
|
|
MB = $64.27
|
Most Recent Note - 3/12/2013 2:00:03 PM
Y - Wedged higher with recent gains lacking great volume conviction, and holding its ground stubbornly. A valid secondary buy point exists following the successful test of support at its 10-week moving average up to as high as +5% above the recent high ($67.98 plus 5% or $71.38). Color code was changed to yellow however no new pivot point was cited since a new base was not formed. The 50 DMA line and recent low ($64.05 on 2/21/13) define important support areas to watch.
>>> The latest Featured Stock Update with an annotated graph appeared on 3/12/2013. Click here.
View all notes |
Alert me of new notes |
CANSLIM.net Company Profile |
SEC |
Zacks Reports |
StockTalk |
News |
Chart |
Request a new note
C
A N
S L
I M
|
Symbol/Exchange
Company Name
Industry Group |
PRICE |
CHANGE
(%Change) |
Day High |
Volume
(% DAV)
(% 50 day avg vol) |
52 Wk Hi
% From Hi |
Featured
Date |
Price
Featured |
Pivot Featured |
|
Max Buy |
|
|
|
THESE ARE NOT BUY RECOMMENDATIONS!
Comments contained in the body of this report are technical
opinions only. The material herein has been obtained
from sources believed to be reliable and accurate, however,
its accuracy and completeness cannot be guaranteed.
This site is not an investment advisor, hence it does
not endorse or recommend any securities or other investments.
Any recommendation contained in this report may not
be suitable for all investors and it is not to be deemed
an offer or solicitation on our part with respect to
the purchase or sale of any securities. All trademarks,
service marks and trade names appearing in this report
are the property of their respective owners, and are
likewise used for identification purposes only.
This report is a service available
only to active Paid Premium Members.
You may opt-out of receiving report notifications
at any time. Questions or comments may be submitted
by writing to Premium Membership Services 665 S.E. 10 Street, Suite 201 Deerfield Beach, FL 33441-5634 or by calling 1-800-965-8307
or 954-785-1121.
|
|
|

