You are not logged in.
This means you
CAN ONLY VIEW reports that were published prior to Monday, April 14, 2025.
You
MUST UPGRADE YOUR MEMBERSHIP if you want to see any current reports.
AFTER MARKET UPDATE - WEDNESDAY, MARCH 12TH, 2014
Previous After Market Report Next After Market Report >>>
|
|
|
|
DOW |
-11.17 |
16,340.08 |
-0.07% |
|
Volume |
645,604,240 |
+3% |
|
Volume |
1,998,684,620 |
-14% |
|
NASDAQ |
+16.14 |
4,323.33 |
+0.37% |
|
Advancers |
1,770 |
56% |
|
Advancers |
1,479 |
54% |
|
S&P 500 |
+0.57 |
1,868.20 |
+0.03% |
|
Decliners |
1,293 |
41% |
|
Decliners |
1,168 |
43% |
|
Russell 2000 |
+4.32 |
1,191.37 |
+0.36% |
|
52 Wk Highs |
46 |
|
|
52 Wk Highs |
52 |
|
|
S&P 600 |
+1.49 |
674.94 |
+0.22% |
|
52 Wk Lows |
41 |
|
|
52 Wk Lows |
15 |
|
|
 |
Tech Helped Nasdaq Rise as Major Averages Ended Mixed
Kenneth J. Gruneisen - Passed the CAN SLIM® Master's Exam
The major averages finished mixed on Wednesday. The volume totals were reported mixed, higher on the NYSE and lighter on the Nasdaq exchange. Advancers led decliners by about a 7-6 margin on the NYSE and on the Nasdaq exchange. There were 10 high-ranked companies from the CANSLIM.net Leaders List that made new 52-week highs and appeared on the CANSLIM.net BreakOuts Page, down from the total of 38 stocks on the prior session. The list of stocks hitting new 52-week highs still outnumbered new 52-week lows on the Nasdaq exchange and on the NYSE. There were gains for 6 of the 12 high-ranked companies currently included on the Featured Stocks Page. The Market (M criteria) environment has been noted as a "Confirmed Uptrend". For any rally to be sustained it is critical for there to be healthy leadership, so it remains crucial for many stocks to continue hitting new 52-week highs.

Dow lost 11 points to 16,340. The S&P 500 closed virtually unchanged at 1,868. The NASDAQ snapped a four-day losing streak as it gained 16 points to 4,323.
Equities spent the day toggling between gains and losses as investors continued to monitor the situation in Ukraine while fears of a growth slowdown in China lingered. Disappointing economic data added to the downside as euro zone industrial production unexpectedly declined for a second straight month in January.
Overall, sectors finished mixed. Industrials and telecommunications were the worst performing groups as General Electric (GE -0.54%) and Frontier Communications (FTR -1.58%) fell. Consumer stocks were also under pressure. Express (EXPR -12.01%) fell after the retailer delivered a weaker than expected sales and profit outlook. The more defensive utilities sector closed higher, led by Duke Energy’s (DUK +1.28%) advance. Microsoft (MSFT +0.66%) and Facebook (FB +1.11%) rose as technology stocks helped lift the NASDAQ.
Earnings results were also in focus. VeriFone Systems (PAY +11.04%) rallied after posting earnings above analyst expectations. Diamond Foods (DMND +9.88%) also bested profit and revenue estimates to help push its shares up. On the downside, Men's Wearhouse (MW -2.54%) fell fter the company reported a wider-than-expected quarterly loss following Tuesday's announcement that it will buy its rival Jos. A. Bank. (JOSB +0.03%) In other news, General Mills (GIS +1.20%) boosted its quarterly dividend by +8% and its shares rose.
Treasury prices rose for a third day and a government auction of 10-year debt attracted the highest demand in a year. The 10-year note increased 12/32 to yield 2.72%. The 30-year bond gained 25/32 to yield 3.66%.
The CANSLIM.net Featured Stocks Page shows the most action-worthy candidates and their latest notes and a Headline Link directs members to the latest detailed analysis with data-packed graphs annotated by a Certified expert along with links to additional resources. The Premium Member Homepage includes "dynamic archives" to all prior pay reports published. Watch for an announcement via email concerning the next WEBCAST.
PICTURED: The Nasdaq Composite Index posted a gain to snap a 4 session losing streak. It is consolidating above prior highs and -1.1% off its 2014 high.
|
 Kenneth J. Gruneisen started out as a licensed stockbroker in August 1987, a couple of months prior to the historic stock market crash that took the Dow Jones Industrial Average down -22.6% in a single day. He has published daily fact-based fundamental and technical analysis on high-ranked stocks online for two decades. Through FACTBASEDINVESTING.COM, Kenneth provides educational articles, news, market commentary, and other information regarding proven investment systems that work in good times and bad.
Comments contained in the body of this report are technical opinions only and are not necessarily those of Gruneisen Growth Corp. The material herein has been obtained from sources believed to be reliable and accurate, however, its accuracy and completeness cannot be guaranteed. Our firm, employees, and customers may effect transactions, including transactions contrary to any recommendation herein, or have positions in the securities mentioned herein or options with respect thereto. Any recommendation contained in this report may not be suitable for all investors and it is not to be deemed an offer or solicitation on our part with respect to the purchase or sale of any securities. |
|
 |
Tech Sector Rose and Gold & Silver Index Posted Big Gain
Kenneth J. Gruneisen - Passed the CAN SLIM® Master's Exam
The tech sector saw unanimous gains from the Biotechnology Index ($BTK +0.66%), Semiconductor Index ($SOX +0.85%), and the Networking Index ($NWX +1.40%). The Broker/Dealer Index ($XBD +0.23%) posted a small gain while the Bank Index ($BKX -0.11%) and the Retail Index ($RLX -0.07%) finished with tiny losses. Energy-related shares were mixed as the Oil Services Index ($OSX -0.30%) edged lower and the Integrated Oil Index ($XOI +0.28%) edged higher. The Gold & Silver Index ($XAU +2.96%) was a standout gainer.
Charts courtesy www.stockcharts.com
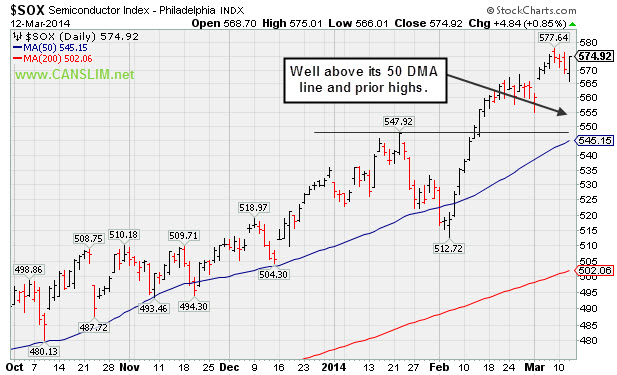
PICTURED: The Semiconductor Index ($SOX +0.85%) is consolidating well above prior highs and its 50-day moving average (DMA) line.
| Oil Services |
$OSX |
277.92 |
-0.83 |
-0.30% |
-1.11% |
| Integrated Oil |
$XOI |
1,483.61 |
+4.12 |
+0.28% |
-1.30% |
| Semiconductor |
$SOX |
574.92 |
+4.84 |
+0.85% |
+7.46% |
| Networking |
$NWX |
347.44 |
+4.78 |
+1.40% |
+7.26% |
| Broker/Dealer |
$XBD |
162.28 |
+0.37 |
+0.23% |
+1.07% |
| Retail |
$RLX |
932.20 |
-0.67 |
-0.07% |
-0.81% |
| Gold & Silver |
$XAU |
102.83 |
+2.96 |
+2.96% |
+22.20% |
| Bank |
$BKX |
70.52 |
-0.08 |
-0.11% |
+1.82% |
| Biotech |
$BTK |
2,819.47 |
+18.48 |
+0.66% |
+20.98% |
|
|
|
 |
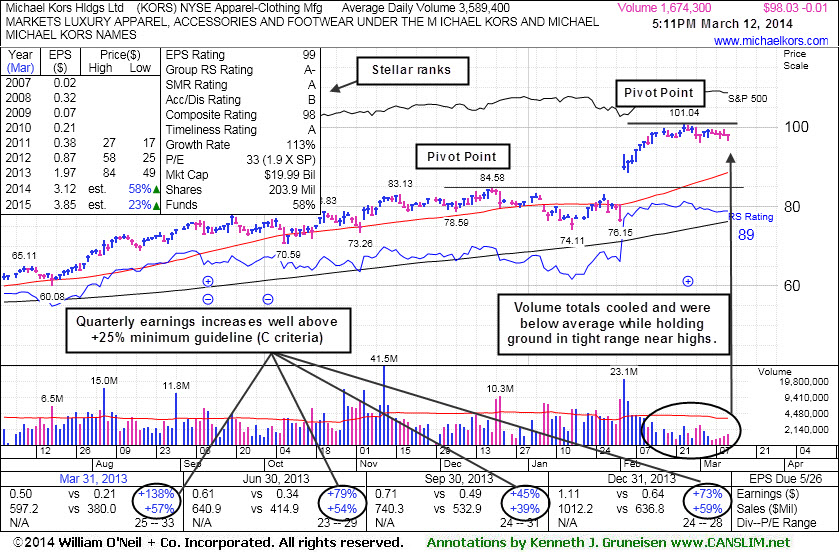
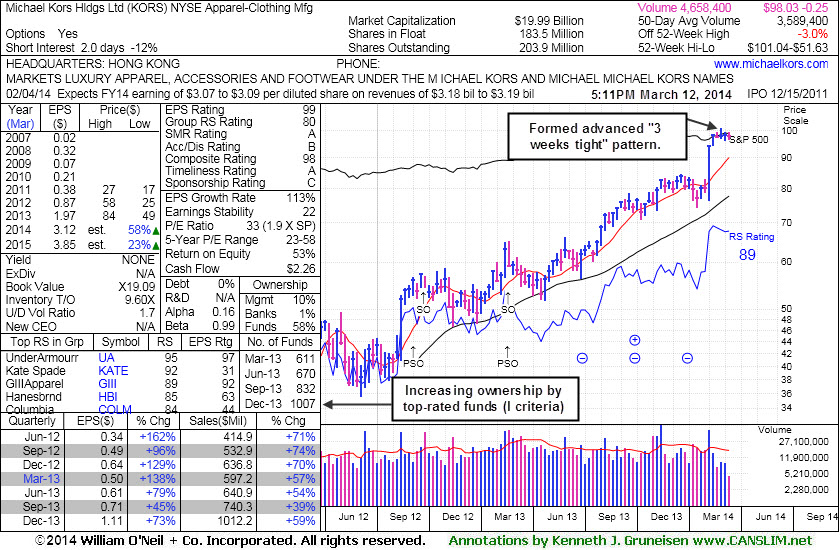
Formed Advanced Base Pattern With Volume Totals Cooling
Kenneth J. Gruneisen - Passed the CAN SLIM® Master's Exam
Michael Kors Hldgs Ltd (KORS -$0.01 or -0.01% to $98.03) is still stubbornly holding its ground in a tight range near its 52-week high with volume totals cooling in recent weeks indicating that few investors have headed for the exit. It has formed an advanced "3-weeks tight" base pattern and a new pivot point is cited based on its 2/25/14 high plus 10 cents. Subsequent volume-driven gains to new highs may trigger a new (or add-on) technical buy signal. Disciplined investors may watch for proof of fresh institutional buying demand and yet avoid chasing stocks more than +5% above prior highs.
Its 50-day moving average (DMA) line ($88.60) defines the nearest support above prior highs in the $84 area. It was last shown in this FSU section on 2/19/14 with annotated graphs under the headline, "Extended From Sound Base and Wedging Higher". The company reported +73% earnings on +59% sales revenues for the Dec '13 quarter, continuing its strong earnings history (meeting C and A criteria).
This high-ranked Apparel - Clothing Manufacturing firm has headquarters in Hong Kong. It completed Secondary Offerings on 9/25/12 and 2/20/13, each time while perched near its all-time highs. Prior reports noted - "Such offerings often are a short-term hindrance to upward price progress yet typically result in broader institutional ownership interest." The number of top-rated funds owning its shares rose from 326 in Mar '12 to 1,007 in Dec '13, a reassuring sign concerning the I criteria. Its current Up/Down Volume Ratio of 1.7 is an unbiased indication its shares have been under accumulation over the past 50 days.
|
|
|
Color Codes Explained :
Y - Better candidates highlighted by our
staff of experts.
G - Previously featured
in past reports as yellow but may no longer be buyable under the
guidelines.
***Last / Change / Volume data in this table is the closing quote data***
Symbol/Exchange
Company Name
Industry Group |
PRICE |
CHANGE
(%Change) |
Day High |
Volume
(% DAV)
(% 50 day avg vol) |
52 Wk Hi
% From Hi |
Featured
Date |
Price
Featured |
Pivot Featured |
|
Max Buy |
EQM
-
NYSE
E Q T Midstream Partners
ENERGY - Oil and Gas Pipelines
|
$64.61
|
-0.08
-0.12% |
$65.11
|
89,798
80.90% of 50 DAV
50 DAV is 111,000
|
$67.80
-4.71%
|
12/12/2013
|
$53.17
|
PP = $56.51
|
|
MB = $59.34
|
Most Recent Note - 3/10/2014 3:47:05 PM
G - Still stubbornly holding its ground since reporting earnings -2% on +22% sales revenues for the Dec '13 quarter, below the +25% minimum earnings guideline (C criteria), raising fundamental concerns. Its 50 DMA line ($62.85 now) defines near-term support where a violation may trigger a technical sell signal.
>>> FEATURED STOCK ARTICLE : Resilient Despite Fundamental Concerns - 3/3/2014
View all notes |
Set NEW NOTE alert |
CANSLIM.net Company Profile |
SEC
News |
Chart |
Request a new note
C
A N
S L
I M


|
FB
-
NASDAQ
Facebook Inc Cl A
INTERNET
|
$70.88
|
+0.78
1.11% |
$71.35
|
46,328,433
78.03% of 50 DAV
50 DAV is 59,370,000
|
$72.59
-2.36%
|
12/12/2013
|
$51.40
|
PP = $54.93
|
|
MB = $57.68
|
Most Recent Note - 3/10/2014 3:48:57 PM
G - Hitting another new all-time high with today's gain. Getting more extended from any sound base and its 50 DMA line ($61.97 now) defining near-term support to watch.
>>> FEATURED STOCK ARTICLE : High-Ranked Internet Group Leader is Extended From Base - 2/25/2014
View all notes |
Set NEW NOTE alert |
CANSLIM.net Company Profile |
SEC
News |
Chart |
Request a new note
C
A N
S L
I M
|
FLT
-
NYSE
Fleetcor Technologies
DIVERSIFIED SERVICES - Business/Management Services
|
$120.89
|
-2.03
-1.65% |
$122.30
|
1,081,253
95.01% of 50 DAV
50 DAV is 1,138,000
|
$132.22
-8.57%
|
3/5/2014
|
$125.40
|
PP = $124.06
|
|
MB = $130.26
|
Most Recent Note - 3/11/2014 5:38:07 PM
Y - Volume totals have been cooling while consolidating near prior highs in the $123 area defining initial support to watch. Deterioration leading to a close below its old high close ($122.70 on 12/02/13) would raise greater concerns and completely negate the recent breakout.
>>> FEATURED STOCK ARTICLE : Consolidating Following Recent Breakout to New High Territory - 3/5/2014
View all notes |
Set NEW NOTE alert |
CANSLIM.net Company Profile |
SEC
News |
Chart |
Request a new note
C
A N
S L
I M
|
GNRC
-
NYSE
Generac Hldgs Inc
Electrical-Power/Equipmt
|
$58.20
|
+0.53
0.92% |
$58.31
|
378,184
40.02% of 50 DAV
50 DAV is 945,000
|
$59.74
-2.57%
|
2/14/2014
|
$56.50
|
PP = $57.39
|
|
MB = $60.26
|
Most Recent Note - 3/11/2014 5:27:34 PM
Y - Wedging higher in recent weeks while making limited headway above prior resistance in the $57 area. Volume should be at least +40% above average as a stock rallies above its pivot point to trigger a proper technical buy signal. See the latest FSU analysis for more details and new annotated graphs.
>>> FEATURED STOCK ARTICLE : Bullish Gap Up Followed By Wedging and Stalling Action - 3/11/2014
View all notes |
Set NEW NOTE alert |
CANSLIM.net Company Profile |
SEC
News |
Chart |
Request a new note
C
A N
S L
I M
|
ICON
-
NASDAQ
Iconix Brand Group Inc
CONSUMER NON-DURABLES - Textile - Apparel Footwear
|
$40.58
|
-0.12
-0.29% |
$40.93
|
436,509
71.33% of 50 DAV
50 DAV is 612,000
|
$42.47
-4.44%
|
3/7/2014
|
$41.46
|
PP = $40.88
|
|
MB = $42.92
|
 Most Recent Note - 3/12/2014 5:43:05 PM
Y - Consolidating above prior highs in the $40 area defining near-term support. Highlighted in yellow with pivot point cited based on its 12/02/13 high plus 10 cents in the 3/07/14 mid-day report (read here).
>>> FEATURED STOCK ARTICLE : Encountered Distributional Pressure Following Recent Breakout - 3/7/2014
View all notes |
Set NEW NOTE alert |
CANSLIM.net Company Profile |
SEC
News |
Chart |
Request a new note
C
A N
S L
I M
|
Symbol/Exchange
Company Name
Industry Group |
PRICE |
CHANGE
(%Change) |
Day High |
Volume
(% DAV)
(% 50 day avg vol) |
52 Wk Hi
% From Hi |
Featured
Date |
Price
Featured |
Pivot Featured |
|
Max Buy |
KORS
-
NYSE
Michael Kors Hldgs Ltd
RETAIL - Apparel Stores
|
$98.03
|
-0.01
-0.01% |
$98.10
|
1,674,325
46.65% of 50 DAV
50 DAV is 3,589,000
|
$101.04
-2.98%
|
3/12/2014
|
$98.03
|
PP = $101.14
|
|
MB = $106.20
|
Most Recent Note - 3/12/2014 5:35:29 PM
Y - Color code is changed to yellow with new pivot point cited based on its 2/25/14 high plus 10 cents. While stubbornly holding its ground in a tight range near its 52-week high, volume totals cooling in recent weeks indicates that few investors have headed for the exit. Its 50 DMA line ($88) defines the nearest support above prior highs in the $84 area. See the latest FSU analysis for more details and new annotated graphs.
>>> FEATURED STOCK ARTICLE : Formed Advanced Base Pattern With Volume Totals Cooling - 3/12/2014
View all notes |
Set NEW NOTE alert |
CANSLIM.net Company Profile |
SEC
News |
Chart |
Request a new note
C
A N
S L
I M
|
LEAF
-
NYSE
Springleaf Holdings Inc
Finance-Consumer Loans
|
$26.15
|
-1.14
-4.18% |
$27.24
|
511,266
362.60% of 50 DAV
50 DAV is 141,000
|
$29.50
-11.36%
|
2/24/2014
|
$28.60
|
PP = $27.44
|
|
MB = $28.81
|
Most Recent Note - 3/12/2014 12:29:19 PM
Y - Undercut prior highs in the $27 area raising concerns and testing support at its 50 DMA line with today's damaging 3rd consecutive loss on ever-increasing volume. Disciplined investors avoid chasing extended stocks more than +5% above prior highs and always limit losses by selling any stock that falls more than -7% from their purchase price.
>>> FEATURED STOCK ARTICLE : Breakout Backed by Four Times Average Volume - 2/24/2014
View all notes |
Set NEW NOTE alert |
CANSLIM.net Company Profile |
SEC
News |
Chart |
Request a new note
C
A N
S L
I M
|
PCLN
-
NASDAQ
Priceline.com Inc
INTERNET - Internet Software and Services
|
$1,332.58
|
+6.28
0.47% |
$1,338.98
|
633,845
81.89% of 50 DAV
50 DAV is 774,000
|
$1,378.96
-3.36%
|
12/18/2013
|
$1,156.20
|
PP = $1,198.85
|
|
MB = $1,258.79
|
Most Recent Note - 3/10/2014 5:33:40 PM
G - Volume totals have been cooling while perched near its 52-week high, stubbornly holding its ground. See the latest FSU analysis for more details and new annotated graphs.
>>> FEATURED STOCK ARTICLE : Perched At Highs With Volume Totals Cooling - 3/10/2014
View all notes |
Set NEW NOTE alert |
CANSLIM.net Company Profile |
SEC
News |
Chart |
Request a new note
C
A N
S L
I M
|
PSIX
-
NASDAQ
Power Solutions Intl Inc
Machinery-Gen Industrial
|
$82.30
|
-1.61
-1.92% |
$84.10
|
127,512
212.52% of 50 DAV
50 DAV is 60,000
|
$87.40
-5.83%
|
2/28/2014
|
$74.65
|
PP = $76.93
|
|
MB = $80.78
|
Most Recent Note - 3/12/2014 5:39:36 PM
G - Down with above average volume today, enduring some distributional pressure this week after rallying to new 52-week highs beyond its "max buy" level. Prior highs near $78 define initial support to watch. Disciplined investors avoid chasing stocks more than +5% above prior highs and always sell if any stock falls more than -7% from their purchase price.
>>> FEATURED STOCK ARTICLE : Earnings Solid and Forming a Cup-With-Handle - 2/28/2014
View all notes |
Set NEW NOTE alert |
CANSLIM.net Company Profile |
SEC
News |
Chart |
Request a new note
C
A N
S L
I M
|
SILC
-
NASDAQ
Silicom Ltd
COMPUTER HARDWARE - Networking andamp; Communication Dev
|
$68.80
|
+1.45
2.15% |
$68.87
|
30,565
36.83% of 50 DAV
50 DAV is 83,000
|
$73.44
-6.32%
|
12/23/2013
|
$44.62
|
PP = $46.25
|
|
MB = $48.56
|
Most Recent Note - 3/12/2014 5:41:23 PM
G - Posted a gain today on lighter volume after retreating from all-time highs with 4 consecutive losses. Extended from any sound base. Patient investors may watch for a new base or secondary buy point to possibly develop and be noted in the weeks ahead.
>>> FEATURED STOCK ARTICLE : Very Extended From Prior Base After 11 Straight Weekly Gains - 3/6/2014
View all notes |
Set NEW NOTE alert |
CANSLIM.net Company Profile |
SEC
News |
Chart |
Request a new note
C
A N
S L
I M
|
Symbol/Exchange
Company Name
Industry Group |
PRICE |
CHANGE
(%Change) |
Day High |
Volume
(% DAV)
(% 50 day avg vol) |
52 Wk Hi
% From Hi |
Featured
Date |
Price
Featured |
Pivot Featured |
|
Max Buy |
ULTI
-
NASDAQ
Ultimate Software Group
INTERNET - Internet Software and Services
|
$155.75
|
+0.63
0.41% |
$156.89
|
207,596
147.23% of 50 DAV
50 DAV is 141,000
|
$171.96
-9.43%
|
1/27/2014
|
$153.75
|
PP = $162.98
|
|
MB = $171.13
|
Most Recent Note - 3/11/2014 5:32:29 PM
G - Volume was higher behind today's 5th consecutive damaging loss. Weak action triggered a technical sell signal while slumping below its 50 DMA line and its color code is changed to green. Only a prompt rebound above the 50 DMA line would help its outlook improve.
>>> FEATURED STOCK ARTICLE : Near 52--Week High Following Another Volume-Driven Gain - 3/4/2014
View all notes |
Set NEW NOTE alert |
CANSLIM.net Company Profile |
SEC
News |
Chart |
Request a new note
C
A N
S L
I M
|
VRX
-
NYSE
Valeant Pharmaceuticals
DRUGS - Drug Manufacturers - Other
|
$141.00
|
+1.04
0.74% |
$141.63
|
1,768,291
103.96% of 50 DAV
50 DAV is 1,701,000
|
$153.10
-7.90%
|
9/11/2013
|
$100.26
|
PP = $105.50
|
|
MB = $110.78
|
Most Recent Note - 3/7/2014 1:16:35 PM
G - Testing its 50 DMA line ($134) which defines near-term support. A more damaging violation may raise serious concerns and trigger a more worrisome technical sell signal.
>>> FEATURED STOCK ARTICLE : Strong Earnings Report; On Track for 9th Weekly Gain in 10 Weeks - 2/27/2014
View all notes |
Set NEW NOTE alert |
CANSLIM.net Company Profile |
SEC
News |
Chart |
Request a new note
C
A N
S L
I M
|
|
|
|
THESE ARE NOT BUY RECOMMENDATIONS!
Comments contained in the body of this report are technical
opinions only. The material herein has been obtained
from sources believed to be reliable and accurate, however,
its accuracy and completeness cannot be guaranteed.
This site is not an investment advisor, hence it does
not endorse or recommend any securities or other investments.
Any recommendation contained in this report may not
be suitable for all investors and it is not to be deemed
an offer or solicitation on our part with respect to
the purchase or sale of any securities. All trademarks,
service marks and trade names appearing in this report
are the property of their respective owners, and are
likewise used for identification purposes only.
This report is a service available
only to active Paid Premium Members.
You may opt-out of receiving report notifications
at any time. Questions or comments may be submitted
by writing to Premium Membership Services 665 S.E. 10 Street, Suite 201 Deerfield Beach, FL 33441-5634 or by calling 1-800-965-8307
or 954-785-1121.
|
|
|

