You are not logged in.
This means you
CAN ONLY VIEW reports that were published prior to Monday, April 14, 2025.
You
MUST UPGRADE YOUR MEMBERSHIP if you want to see any current reports.
AFTER MARKET UPDATE - TUESDAY, MARCH 12TH, 2013
Previous After Market Report Next After Market Report >>>
|
|
|
|
DOW |
+2.77 |
14,450.06 |
+0.02% |
|
Volume |
622,449,280 |
+4% |
|
Volume |
1,602,752,650 |
+1% |
|
NASDAQ |
-10.55 |
3,242.32 |
-0.32% |
|
Advancers |
1,244 |
40% |
|
Advancers |
1,011 |
40% |
|
S&P 500 |
-3.74 |
1,552.48 |
-0.24% |
|
Decliners |
1,777 |
57% |
|
Decliners |
1,444 |
57% |
|
Russell 2000 |
-2.25 |
940.26 |
-0.24% |
|
52 Wk Highs |
234 |
|
|
52 Wk Highs |
153 |
|
|
S&P 600 |
-2.00 |
523.48 |
-0.38% |
|
52 Wk Lows |
17 |
|
|
52 Wk Lows |
12 |
|
|
 |
Major Averages End Mixed and Little Changed
Kenneth J. Gruneisen - Passed the CAN SLIM® Master's Exam
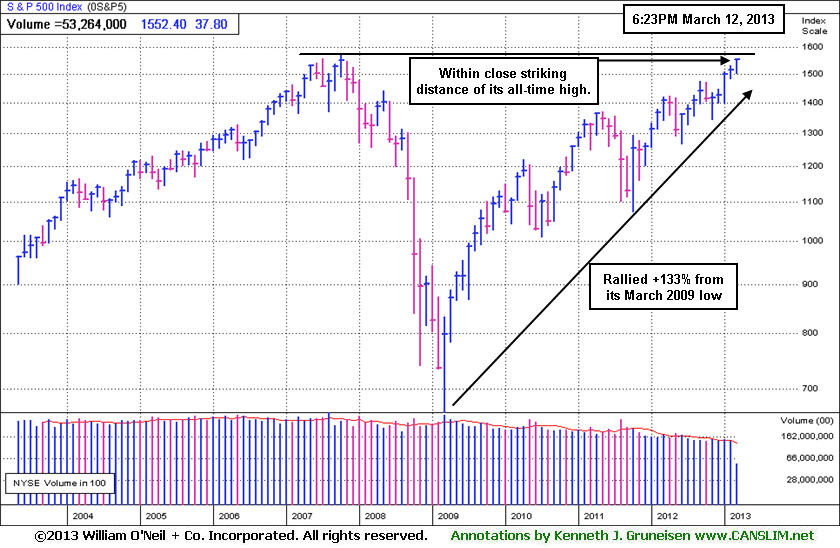
The S&P 500 Index ended a mere -0.24% lower on Tuesday, breaking a seven-session string of gains and finishing at 1,552.48 - about 13 points below its record closing high. The Dow Jones Industrial Average rose just 2.77 points, or +0.02%, to 14,450.06, another record close. The volume totals reported were below average but slightly higher than the prior session totals on the NYSE and on the Nasdaq exchange. Breadth was negative as decliners led advancers by nearly a 3-2 margin on the NYSE and on the Nasdaq exchange. The total number of stocks hitting new 52-week highs contracted yet still solidly outnumbered new 52-week lows on the NYSE and on the Nasdaq exchange. There were 48 high-ranked companies from the CANSLIM.net Leaders List making new 52-week highs and appearing on the CANSLIM.net BreakOuts Page, down from the prior session's total of 75 stocks. There were gains for 6 of the 15 high-ranked companies currently included on the Featured Stocks Page.
Jens Weidmann, head of the Bundesbank and a member of the European Central Bank's governing council, said the euro-zone crisis was not over. After a light economic calendar the last couple of days, investors will turn their attention to retail sales data on Wednesday to get a sense of how consumers are faring. Sales are expected to have increased +0.5% in February.
Apple Inc (AAPL -2.2%) fell to $428.43 after an analyst said the company has a 25% chance of missing its quarterly revenue forecast as iPhone sales slow. Among the day's gainers, J.C. Penney Co Inc (JCP +4%) rallied amid speculation that the department store chain's chief executive, Ron Johnson, may resign. In another bright spot, Merck & Co (MRK +3.2%) rose after the pharmaceutical company said an outside board had allowed it to continue a trial assessing its Vytorin cholesterol drug. None of the above mentioned companies match the fact-based investment system's guidelines. The most noteworthy high-ranked leaders are included on the Featured Stocks Page.
Any sustainable rally requires a healthy crop of companies hitting new 52-week highs, so it is always essential to see meaningful leadership (stocks hitting new 52-week highs). New buying efforts are justified under the fact-based system since Nasdaq Composite Index's solid gain on higher volume may be considered a follow-through day, shifting the market's (M criteria) direction to a confirmed rally again after a brief correction.
Watch for an announcement via email concerning the next WEBCAST. The webcast will also be available via an updated link highlighted at the top of the Premium Member Homepage.
PICTURED: The S&P 500 Index's monthly graph shows it on track for a 5th consecutive monthly gain and perched within close striking distance of its all-time high. It has rallied +133% from the March 2009 low.
|
 Kenneth J. Gruneisen started out as a licensed stockbroker in August 1987, a couple of months prior to the historic stock market crash that took the Dow Jones Industrial Average down -22.6% in a single day. He has published daily fact-based fundamental and technical analysis on high-ranked stocks online for two decades. Through FACTBASEDINVESTING.COM, Kenneth provides educational articles, news, market commentary, and other information regarding proven investment systems that work in good times and bad.
Comments contained in the body of this report are technical opinions only and are not necessarily those of Gruneisen Growth Corp. The material herein has been obtained from sources believed to be reliable and accurate, however, its accuracy and completeness cannot be guaranteed. Our firm, employees, and customers may effect transactions, including transactions contrary to any recommendation herein, or have positions in the securities mentioned herein or options with respect thereto. Any recommendation contained in this report may not be suitable for all investors and it is not to be deemed an offer or solicitation on our part with respect to the purchase or sale of any securities. |
|
 |
Gold & Silver Index Attempting Rebound From Multi-Year Lows
Kenneth J. Gruneisen - Passed the CAN SLIM® Master's Exam
Energy-related shares also had a positive bias as the Integrated Oil Index ($XOI +0.51%) and Oil Services Index ($OSX +0.18%) both edged higher. The Bank Index ($BKX -0.74%) and Broker/Dealer Index ($XBD -0.52%) suffered small losses which weighed on the major averages. The Internet Index ($IIX -0.30%) and the Retail Index ($RLX -0.15%) also edged lower. The Networking Index ($NWX -0.05%) finished flat while the Biotechnology Index ($BTK +0.19%) and Semiconductor Index ($SOX +0.42%) each posted a small gain. The Healthcare Index ($HMO +0.59%) posted a modest gain. Traditionally considered a defensive bet, the healthcare sector has been one of the leaders of the rally so far this year. The same cannot be said for the other classic defensive "safe haven" groups.
Charts courtesy www.stockcharts.com
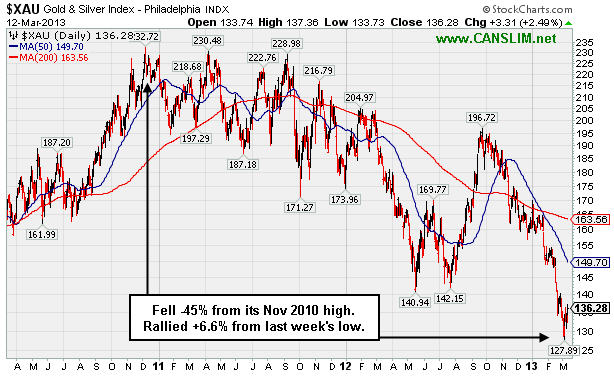
PICTURED: The 3-year graph of the Gold & Silver Index ($XAU +2.49%) shows the -45% decline which occurred from the November 2010 high to the recent low. The XAU was a standout gainer on Tuesday and it has rallied +6.6% while rebounding from multi-year lows.
| Oil Services |
$OSX |
244.79 |
+0.43 |
+0.18% |
+11.19% |
| Healthcare |
$HMO |
2,776.92 |
+16.27 |
+0.59% |
+10.45% |
| Integrated Oil |
$XOI |
1,354.79 |
+6.93 |
+0.51% |
+9.10% |
| Semiconductor |
$SOX |
437.67 |
+1.82 |
+0.42% |
+13.96% |
| Networking |
$NWX |
241.80 |
-0.12 |
-0.05% |
+6.73% |
| Internet |
$IIX |
367.64 |
-1.10 |
-0.30% |
+12.43% |
| Broker/Dealer |
$XBD |
110.02 |
-0.57 |
-0.52% |
+16.64% |
| Retail |
$RLX |
727.03 |
-1.10 |
-0.15% |
+11.33% |
| Gold & Silver |
$XAU |
136.28 |
+3.31 |
+2.49% |
-17.71% |
| Bank |
$BKX |
56.69 |
-0.42 |
-0.74% |
+10.55% |
| Biotech |
$BTK |
1,798.22 |
+3.35 |
+0.19% |
+16.24% |
|
|
|
 |
Following Test Of Support a Valid Chance to Accumulate
Kenneth J. Gruneisen - Passed the CAN SLIM® Master's Exam
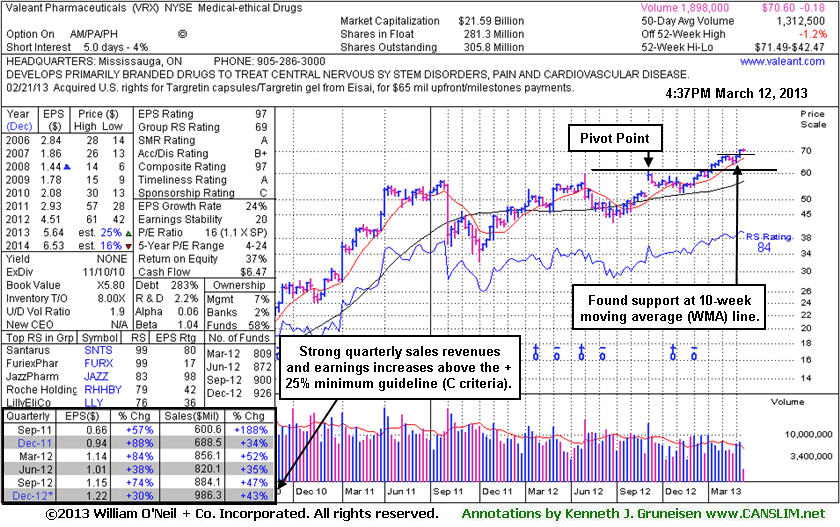
Valeant Pharmaceuticals (VRX +$0.02 or +0.03% to $70.55) wedged higher with recent daily gains lacking great volume conviction and it has been holding its ground stubbornly. Its weekly graph below shows no signs of distributional pressure. In fact, the recent down weeks have clearly been plotted with lighter than average volume. That is a sign that few investors have been headed for the exit door.
In the Certification they teach that if an investor misses a stock's initial breakout, a valid secondary buy point exists following the first successful test of support at the stock's 10-week moving average up to as high as +5% above its recent high. In this case the prior high was $67.98, so one might consider that price plus 5%, or $71.38, as the highest that a disciplined investor would be willing to pay to accumulate shares under the fact-based investment system. Its color code was changed to yellow however no new pivot point was cited since a new base of sufficient length was not formed. Meanwhile, the recent low ($64.05 on 2/21/13) defines important near-term support to watch where a violation would trigger a worrisome technical sell signal.
The Medical - Ethical Drugs firm was last shown in this FSU section on 2/15/13 with an annotated graph under the headline "Upward Trendline Defines Initial Support Above 50 Day Moving Average". Since then it violated the upward trendline yet it has stayed above the 50-day moving average (DMA) line. The number of top-rated funds owning its shares rose from 818 in Mar '12 in to 926 in Dec '12, a reassuring trend concerning the I criteria. Its current Up/Down Volume Ratio of 1.9 is also an unbiased indication that its shares have been under accumulation over the past 50 days. Quarterly earnings increases (C criteria) have been strong and well above the +25% guideline. A downturn in FY '07 and '08 earnings (A criteria) has been followed by a strong earnings rebound in recent years.
|
|
|
Color Codes Explained :
Y - Better candidates highlighted by our
staff of experts.
G - Previously featured
in past reports as yellow but may no longer be buyable under the
guidelines.
***Last / Change / Volume data in this table is the closing quote data***
Symbol/Exchange
Company Name
Industry Group |
PRICE |
CHANGE
(%Change) |
Day High |
Volume
(% DAV)
(% 50 day avg vol) |
52 Wk Hi
% From Hi |
Featured
Date |
Price
Featured |
Pivot Featured |
|
Max Buy |
CELG
-
NASDAQ
Celgene Corp
DRUGS - Drug Manufacturers - Major
|
$113.72
|
+1.80
1.61% |
$113.88
|
3,638,078
93.18% of 50 DAV
50 DAV is 3,904,300
|
$112.09
1.45%
|
12/11/2012
|
$82.24
|
PP = $81.34
|
|
MB = $85.41
|
 Most Recent Note - 3/12/2013 1:09:23 PM
G - Wedging further into new all-time high territory with today's 6th consecutive gain, getting very extended from any sound base. Its 50 DMA line defines important support to watch.
>>> The latest Featured Stock Update with an annotated graph appeared on 2/28/2013. Click here.
View all notes |
Alert me of new notes |
CANSLIM.net Company Profile |
SEC |
Zacks Reports |
StockTalk |
News |
Chart |
Request a new note
C
A N
S L
I M


|
CFNL
-
NASDAQ
Cardinal Financial Corp
BANKING - Regional - Southeast Banks
|
$17.75
|
-0.05
-0.28% |
$17.95
|
276,603
130.72% of 50 DAV
50 DAV is 211,600
|
$18.19
-2.42%
|
3/7/2013
|
$17.27
|
PP = $16.77
|
|
MB = $17.61
|
Most Recent Note - 3/8/2013 12:13:11 PM
Y - Gapped up and hit another new 52-week high while trading near its "max buy" level with above average volume behind today's 7th consecutive gain. Prior session's gain was backed by volume +169% above average as it rose above the new pivot point cited based upon its 2/15/13 high, clearing a "double bottom" base and triggering a proper technical buy signal under the fact-based system.
>>> The latest Featured Stock Update with an annotated graph appeared on 2/21/2013. Click here.
View all notes |
Alert me of new notes |
CANSLIM.net Company Profile |
SEC |
Zacks Reports |
StockTalk |
News |
Chart |
Request a new note
C
A N
S L
I M
|
CMCSA
-
NASDAQ
Comcast Corp Cl A
MEDIA - CATV Systems
|
$40.72
|
-0.42
-1.01% |
$41.07
|
14,397,853
105.42% of 50 DAV
50 DAV is 13,657,700
|
$42.00
-3.05%
|
12/3/2012
|
$37.08
|
PP = $38.06
|
|
MB = $39.96
|
Most Recent Note - 3/12/2013 1:11:32 PM
G - Volume totals have been cooling in recent weeks while consolidating above support at its 50 DMA line, still perched very near its 52-week high. Reported earnings +11% on +6% sales revenues for the Dec '12 quarter, below the +25% minimum earnings guideline (C criteria), raising fundamental concerns
>>> The latest Featured Stock Update with an annotated graph appeared on 2/19/2013. Click here.
View all notes |
Alert me of new notes |
CANSLIM.net Company Profile |
SEC |
Zacks Reports |
StockTalk |
News |
Chart |
Request a new note
C
A N
S L
I M
|
EVER
-
NYSE
Everbank Financial Corp
BANKING
|
$15.58
|
-1.14
-6.82% |
$16.55
|
4,234,025
572.78% of 50 DAV
50 DAV is 739,200
|
$17.29
-9.89%
|
3/4/2013
|
$15.38
|
PP = $15.83
|
|
MB = $16.62
|
Most Recent Note - 3/12/2013 1:47:11 PM
Y - Violated prior highs in the $16 area noted as initial chart support to watch, raising concerns. Slumped below its pivot point and briefly undercut its 50 DMA line before rebounding from the morning's lows.
>>> The latest Featured Stock Update with an annotated graph appeared on 3/4/2013. Click here.
View all notes |
Alert me of new notes |
CANSLIM.net Company Profile |
SEC |
Zacks Reports |
StockTalk |
News |
Chart |
Request a new note
C
A N
S L
I M
|
JAZZ
-
NASDAQ
Jazz Pharmaceuticals Plc
DRUGS - Biotechnology
|
$59.42
|
+0.17
0.29% |
$60.79
|
1,100,704
219.31% of 50 DAV
50 DAV is 501,900
|
$60.25
-1.38%
|
3/5/2013
|
$59.10
|
PP = $60.10
|
|
MB = $63.11
|
Most Recent Note - 3/11/2013 12:25:09 PM
Y - Holding its ground since completing a Secondary Offering on 3/05/13. Disciplined investors may watch for a volume-driven gain above the pivot point to trigger a technical buy signal before new buying efforts may be justified under the fact-based investment system. See the latest FSU analysis for more details and a new annotated graph.
>>> The latest Featured Stock Update with an annotated graph appeared on 3/7/2013. Click here.
View all notes |
Alert me of new notes |
CANSLIM.net Company Profile |
SEC |
Zacks Reports |
StockTalk |
News |
Chart |
Request a new note
C
A N
S L
I M
|
Symbol/Exchange
Company Name
Industry Group |
PRICE |
CHANGE
(%Change) |
Day High |
Volume
(% DAV)
(% 50 day avg vol) |
52 Wk Hi
% From Hi |
Featured
Date |
Price
Featured |
Pivot Featured |
|
Max Buy |
KORS
-
NYSE
Michael Kors Hldgs Ltd
RETAIL - Apparel Stores
|
$56.28
|
+1.28
2.33% |
$56.37
|
6,846,751
117.02% of 50 DAV
50 DAV is 5,850,900
|
$65.10
-13.55%
|
1/23/2013
|
$54.98
|
PP = $58.72
|
|
MB = $61.66
|
Most Recent Note - 3/11/2013 11:04:56 AM
G - Color code is changed to green while slumping below prior highs in the $58 area and violating its 50 DMA line raising concerns. Completed another Secondary Offering 2/20/13 while perched near its all-time high.
>>> The latest Featured Stock Update with an annotated graph appeared on 3/8/2013. Click here.
View all notes |
Alert me of new notes |
CANSLIM.net Company Profile |
SEC |
Zacks Reports |
StockTalk |
News |
Chart |
Request a new note
C
A N
S L
I M
|
LNKD
-
NYSE
Linkedin Corp Class A
INTERNET - Internet Information Providers
|
$176.00
|
-1.08
-0.61% |
$177.39
|
1,763,320
73.71% of 50 DAV
50 DAV is 2,392,100
|
$179.35
-1.87%
|
2/8/2013
|
$147.04
|
PP = $127.55
|
|
MB = $133.93
|
Most Recent Note - 3/11/2013 5:39:34 PM
G - Very extended from its prior base, but having rallied more than +20% in the first 2-3 weeks after its breakout, the investment system rules suggest holding such winners for a minimum of 8 weeks. See the latest FSU analysis for more details and a new annotated graph.
>>> The latest Featured Stock Update with an annotated graph appeared on 3/11/2013. Click here.
View all notes |
Alert me of new notes |
CANSLIM.net Company Profile |
SEC |
Zacks Reports |
StockTalk |
News |
Chart |
Request a new note
C
A N
S L
I M
|
LOPE
-
NASDAQ
Grand Canyon Education
DIVERSIFIED SERVICES - Education and; Training Services
|
$24.15
|
+0.06
0.25% |
$24.32
|
265,453
57.19% of 50 DAV
50 DAV is 464,200
|
$27.18
-11.15%
|
2/20/2013
|
$26.44
|
PP = $25.10
|
|
MB = $26.36
|
Most Recent Note - 3/12/2013 1:50:39 PM
G - Consolidating above its 50 DMA line with volume totals cooling in recent weeks after it quickly negated the prior technical breakout. It has not formed a sound new base.
>>> The latest Featured Stock Update with an annotated graph appeared on 2/20/2013. Click here.
View all notes |
Alert me of new notes |
CANSLIM.net Company Profile |
SEC |
Zacks Reports |
StockTalk |
News |
Chart |
Request a new note
C
A N
S L
I M
|
MIDD
-
NASDAQ
Middleby Corp
MANUFACTURING - Diversified Machinery
|
$149.97
|
-0.53
-0.35% |
$150.61
|
80,016
87.74% of 50 DAV
50 DAV is 91,200
|
$154.74
-3.08%
|
10/8/2012
|
$118.46
|
PP = $122.67
|
|
MB = $128.80
|
Most Recent Note - 3/12/2013 1:52:24 PM
G - Still hovering near all-time highs today with volume totals cooling. Fundamental concerns were recently noted. Its 50 DMA line defines important near-term chart support.
>>> The latest Featured Stock Update with an annotated graph appeared on 2/25/2013. Click here.
View all notes |
Alert me of new notes |
CANSLIM.net Company Profile |
SEC |
Zacks Reports |
StockTalk |
News |
Chart |
Request a new note
C
A N
S L
I M
|
MWIV
-
NASDAQ
M W I Veterinary Supply
HEALTH SERVICES - Medical Instruments and; Supplies
|
$131.89
|
+0.14
0.11% |
$132.59
|
48,138
87.68% of 50 DAV
50 DAV is 54,900
|
$137.18
-3.86%
|
3/4/2013
|
$130.90
|
PP = $129.45
|
|
MB = $135.92
|
Most Recent Note - 3/11/2013 6:13:30 PM
Y - Fell with above average volume today, its 2nd distribution day since hitting its all-time high last week. Color code is changed to yellow after retreating below its "max buy" level. Subsequent deterioration below its pivot point would raise concerns and could negate its latest breakout.
>>> The latest Featured Stock Update with an annotated graph appeared on 3/6/2013. Click here.
View all notes |
Alert me of new notes |
CANSLIM.net Company Profile |
SEC |
Zacks Reports |
StockTalk |
News |
Chart |
Request a new note
C
A N
S L
I M
|
Symbol/Exchange
Company Name
Industry Group |
PRICE |
CHANGE
(%Change) |
Day High |
Volume
(% DAV)
(% 50 day avg vol) |
52 Wk Hi
% From Hi |
Featured
Date |
Price
Featured |
Pivot Featured |
|
Max Buy |
N
-
NYSE
Netsuite Inc
DIVERSIFIED SERVICES - Business/Management Services
|
$75.20
|
-0.36
-0.48% |
$75.42
|
431,870
125.00% of 50 DAV
50 DAV is 345,500
|
$75.75
-0.73%
|
12/12/2012
|
$64.75
|
PP = $67.12
|
|
MB = $70.48
|
Most Recent Note - 3/8/2013 1:10:41 PM
G - Perched at its 52-week and all-time high, holding its ground following a streak of 7 consecutive volume-driven gains. Its 50 DMA line acted as support during the recent consolidation.
>>> The latest Featured Stock Update with an annotated graph appeared on 3/1/2013. Click here.
View all notes |
Alert me of new notes |
CANSLIM.net Company Profile |
SEC |
Zacks Reports |
StockTalk |
News |
Chart |
Request a new note
C
A N
S L
I M
|
NSR
-
NYSE
Neustar Inc
TELECOMMUNICATIONS - Diversified Communication Serv
|
$44.88
|
-0.32
-0.71% |
$45.19
|
461,905
102.30% of 50 DAV
50 DAV is 451,500
|
$47.24
-5.00%
|
3/8/2013
|
$44.99
|
PP = $47.34
|
|
MB = $49.71
|
Most Recent Note - 3/8/2013 1:08:01 PM
Y - Consolidating above its 50 DMA line today after small gains this week backed by below average volume. Color code is changed to yellow with new pivot point cited based on its 2/27/13 high plus 10 cents while forming a "square box" base. Volume-driven gains above the pivot point may trigger a new (or add-on) technical buy signal. The 2/21/13 low ($42.40) defines important near-term support where any subsequent deterioration would raise greater concerns and trigger a worrisome technical sell signal.
>>> The latest Featured Stock Update with an annotated graph appeared on 2/27/2013. Click here.
View all notes |
Alert me of new notes |
CANSLIM.net Company Profile |
SEC |
Zacks Reports |
StockTalk |
News |
Chart |
Request a new note
C
A N
S L
I M
|
QIHU
-
NYSE
Qihoo 360 Technology Ads
INTERNET - Internet Service Providers
|
$31.34
|
-0.47
-1.48% |
$31.80
|
2,564,206
100.56% of 50 DAV
50 DAV is 2,549,800
|
$34.90
-10.20%
|
3/5/2013
|
$34.63
|
PP = $34.47
|
|
MB = $36.19
|
Most Recent Note - 3/12/2013 1:56:09 PM
G - Trading just below its 50 DMA line today. Volume totals have cooled since its damaging gap down on 3/06/13 after reporting earnings +10% on +65% sales revenues for the Dec '12 quarter, below the +25% minimum earnings guideline (C criteria) raising fundamental concerns. Color code was changed to green based the sub par results and the abrupt reversal from its new 52-week high. See the latest FSU analysis for more details and a new annotated graph under the headline, "Earnings Below Guideline Raised Concerns After Technical Breakout".
>>> The latest Featured Stock Update with an annotated graph appeared on 3/5/2013. Click here.
View all notes |
Alert me of new notes |
CANSLIM.net Company Profile |
SEC |
Zacks Reports |
StockTalk |
News |
Chart |
Request a new note
C
A N
S L
I M
|
SLCA
-
NYSE
U S Silica Holdings Inc
CHEMICALS - Specialty Chemicals
|
$24.47
|
-2.06
-7.76% |
$25.65
|
2,132,613
397.95% of 50 DAV
50 DAV is 535,900
|
$28.50
-14.14%
|
2/26/2013
|
$22.23
|
PP = $21.50
|
|
MB = $22.58
|
Most Recent Note - 3/12/2013 11:38:44 AM
G - Gapped down today for a large loss after announcing a Secondary Offering after a spurt of volume-driven gains into new 52-week high territory. Previously noted - "Very extended from its prior base, but having rallied more than +20% in the first 2-3 weeks after its breakout, the investment system rules suggest holding such winners for a minimum of 8 weeks."
>>> The latest Featured Stock Update with an annotated graph appeared on 2/26/2013. Click here.
View all notes |
Alert me of new notes |
CANSLIM.net Company Profile |
SEC |
Zacks Reports |
StockTalk |
News |
Chart |
Request a new note
C
A N
S L
I M
|
VRX
-
NYSE
Valeant Pharmaceuticals
DRUGS - Drug Manufacturers - Other
|
$70.60
|
+0.07
0.10% |
$70.97
|
997,514
76.00% of 50 DAV
50 DAV is 1,312,500
|
$71.49
-1.24%
|
12/20/2012
|
$60.24
|
PP = $61.21
|
|
MB = $64.27
|
Most Recent Note - 3/12/2013 2:00:03 PM
Y - Wedged higher with recent gains lacking great volume conviction, and holding its ground stubbornly. A valid secondary buy point exists following the successful test of support at its 10-week moving average up to as high as +5% above the recent high ($67.98 plus 5% or $71.38). Color code was changed to yellow however no new pivot point was cited since a new base was not formed. The 50 DMA line and recent low ($64.05 on 2/21/13) define important support areas to watch.
>>> The latest Featured Stock Update with an annotated graph appeared on 3/12/2013. Click here.
View all notes |
Alert me of new notes |
CANSLIM.net Company Profile |
SEC |
Zacks Reports |
StockTalk |
News |
Chart |
Request a new note
C
A N
S L
I M
|
Symbol/Exchange
Company Name
Industry Group |
PRICE |
CHANGE
(%Change) |
Day High |
Volume
(% DAV)
(% 50 day avg vol) |
52 Wk Hi
% From Hi |
Featured
Date |
Price
Featured |
Pivot Featured |
|
Max Buy |
|
|
|
THESE ARE NOT BUY RECOMMENDATIONS!
Comments contained in the body of this report are technical
opinions only. The material herein has been obtained
from sources believed to be reliable and accurate, however,
its accuracy and completeness cannot be guaranteed.
This site is not an investment advisor, hence it does
not endorse or recommend any securities or other investments.
Any recommendation contained in this report may not
be suitable for all investors and it is not to be deemed
an offer or solicitation on our part with respect to
the purchase or sale of any securities. All trademarks,
service marks and trade names appearing in this report
are the property of their respective owners, and are
likewise used for identification purposes only.
This report is a service available
only to active Paid Premium Members.
You may opt-out of receiving report notifications
at any time. Questions or comments may be submitted
by writing to Premium Membership Services 665 S.E. 10 Street, Suite 201 Deerfield Beach, FL 33441-5634 or by calling 1-800-965-8307
or 954-785-1121.
|
|
|

