You are not logged in.
This means you
CAN ONLY VIEW reports that were published prior to Monday, April 28, 2025.
You
MUST UPGRADE YOUR MEMBERSHIP if you want to see any current reports.
AFTER MARKET UPDATE - MONDAY, MARCH 10TH, 2014
Previous After Market Report Next After Market Report >>>
|
|
|
|
DOW |
-34.04 |
16,418.68 |
-0.21% |
|
Volume |
615,708,040 |
-13% |
|
Volume |
1,945,544,470 |
-4% |
|
NASDAQ |
-1.77 |
4,334.35 |
-0.04% |
|
Advancers |
1,306 |
42% |
|
Advancers |
1,149 |
43% |
|
S&P 500 |
-0.87 |
1,877.17 |
-0.05% |
|
Decliners |
1,707 |
55% |
|
Decliners |
1,423 |
53% |
|
Russell 2000 |
-2.78 |
1,200.54 |
-0.23% |
|
52 Wk Highs |
94 |
|
|
52 Wk Highs |
106 |
|
|
S&P 600 |
-0.91 |
680.31 |
-0.13% |
|
52 Wk Lows |
23 |
|
|
52 Wk Lows |
8 |
|
|
 |
Major Averages Ended Slightly Lower on Less Volume
Kenneth J. Gruneisen - Passed the CAN SLIM® Master's Exam
On Monday the major averages ended with small losses on the session. The volume totals were reported slightly lighter on the NYSE and on the Nasdaq exchange. Decliners led advancers by nearly a 3-2 margin on the NYSE and 7-6 on the Nasdaq exchange. There were 31 high-ranked companies from the CANSLIM.net Leaders List that made new 52-week highs and appeared on the CANSLIM.net BreakOuts Page, less than half the total of 69 stocks on the prior session. The list of stocks hitting new 52-week highs contracted yet still easily outnumbered new 52-week lows on the Nasdaq exchange and on the NYSE, and new 52-week lows were in the single digits on the Nasdaq exchange. There were gains for 4 of the 12 high-ranked companies currently included on the Featured Stocks Page. The Market (M criteria) environment has been noted as a "Confirmed Uptrend". For any rally to be sustained it is critical for there to be healthy leadership, so it remains crucial for many stocks to continue hitting new 52-week highs.
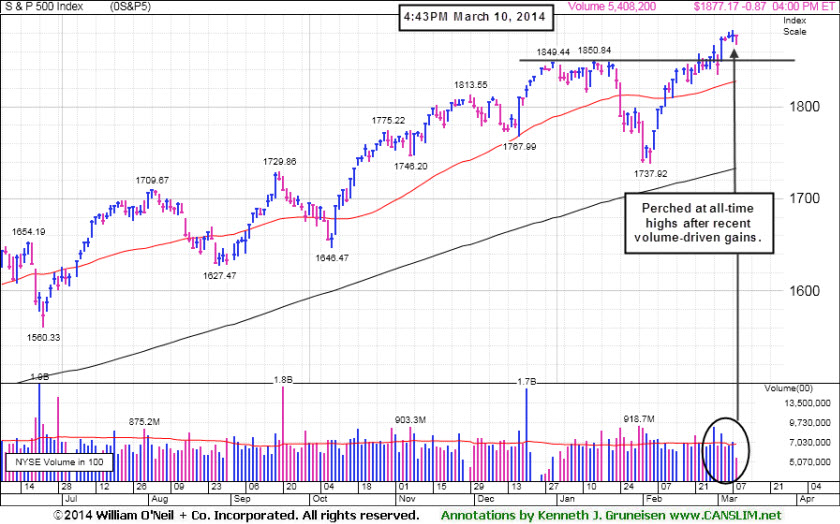
The major averages ended lower on the session, albeit well off of their worst levels. The Dow Jones Industrial Average gave up 34 points to 16,418 after being down by as many as 118 points earlier. The S&P 500 was relatively unchanged, down less than a point at 1,877 and the NASDAQ shed just over 1 point with the index closing at 4,334.
Stocks were under pressure from the opening bell as disappointing export data out of China heightened concerns that global growth may be slowing. Sector action on the S&P was mixed. Industrials were the worst performing group as Ingersoll-Rand (IR -1.58%) and others fell.
In other news, Alexion Pharmaceuticals (ALXN +7.11%) rallied after the company raised their full-year earnings guidance. On the M&A Front, Chiquita Brands (CQB +10.7%) rallied on news that the company is acquiring Irish competitor Fyffes for $526 million in stock.
Turning to fixed income markets, Treasuries were little changed along the curve. The benchmark 10-year note was up 1/16 of a point to yield 2.78% and the 30-year bond added 1/32 to yield 3.72%.
The CANSLIM.net Featured Stocks Page shows the most action-worthy candidates and their latest notes and a Headline Link directs members to the latest detailed analysis with data-packed graphs annotated by a Certified expert along with links to additional resources. The Premium Member Homepage includes "dynamic archives" to all prior pay reports published. Watch for an announcement via email concerning the next WEBCAST.
PICTURED: The S&P 500 Index is perched near its all-time high after recent volume-driven gains into new high territory.
|
 Kenneth J. Gruneisen started out as a licensed stockbroker in August 1987, a couple of months prior to the historic stock market crash that took the Dow Jones Industrial Average down -22.6% in a single day. He has published daily fact-based fundamental and technical analysis on high-ranked stocks online for two decades. Through FACTBASEDINVESTING.COM, Kenneth provides educational articles, news, market commentary, and other information regarding proven investment systems that work in good times and bad.
Comments contained in the body of this report are technical opinions only and are not necessarily those of Gruneisen Growth Corp. The material herein has been obtained from sources believed to be reliable and accurate, however, its accuracy and completeness cannot be guaranteed. Our firm, employees, and customers may effect transactions, including transactions contrary to any recommendation herein, or have positions in the securities mentioned herein or options with respect thereto. Any recommendation contained in this report may not be suitable for all investors and it is not to be deemed an offer or solicitation on our part with respect to the purchase or sale of any securities. |
|
 |
Biotech Index Rose; Most Groups Ended Lower
Kenneth J. Gruneisen - Passed the CAN SLIM® Master's Exam
Financial shares held their ground as the Broker/Dealer Index ($XBD -0.01%) and the Bank Index ($BKX +0.04%) both ended virtually unchanged on Monday. The Gold & Silver Index ($XAU -0.78%) fell while energy-related shares were mixed as the Oil Services Index ($OSX -0.14%) edged lower and the Integrated Oil Index ($XOI +0.33%) posted a small gain. The Biotechnology Index ($BTK +0.39%) led the tech sector higher with a small gain, meanwhile the Networking Index ($NWX -0.39%) and Semiconductor Index ($SOX -0.20%) suffered small losses, and the Retail Index ($RLX -0.26%) also edged lower.
Charts courtesy www.stockcharts.com
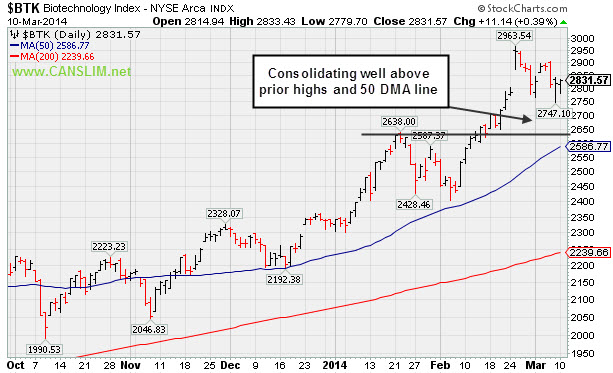
PICTURED: The Biotechnology Index ($BTK +0.39%) is consolidating well above prior highs and its 50-day moving average (DMA) line.
|
|
|
 |
Perched At Highs With Volume Totals Cooling
Kenneth J. Gruneisen - Passed the CAN SLIM® Master's Exam
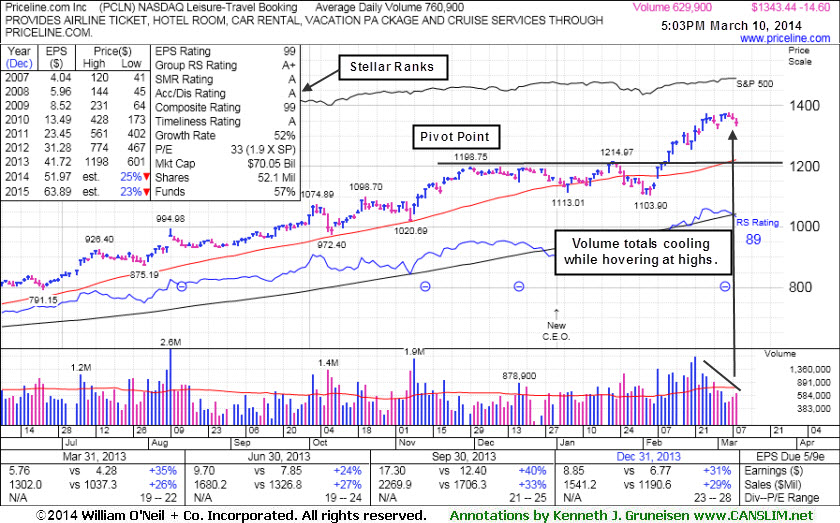
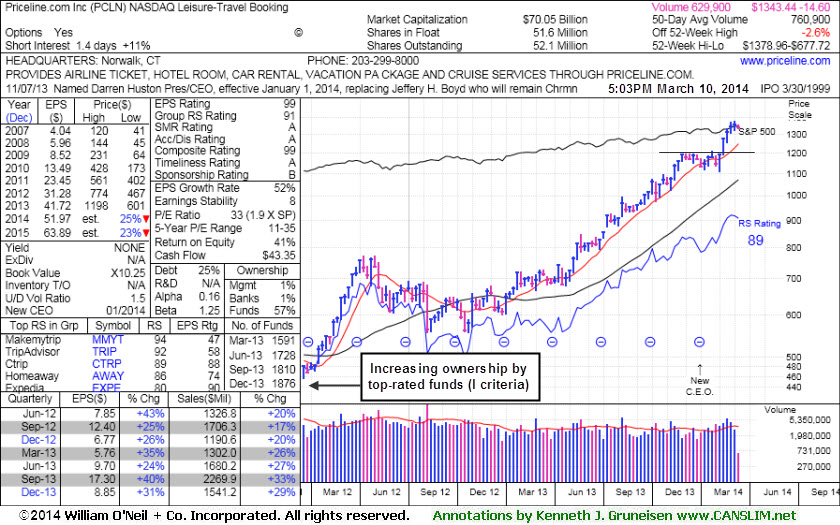
Priceline.com Inc (PCLN -$14.60 or -1.08% to $1,343.44) is perched near its 52-week high with volume totals cooling while stubbornly holding its ground. That is a sign that few investors have been headed for the exit. Its current Up/Down Volume Ratio of 1.5 is an unbiased indication its shares have been under accumulation over the past 50 days.
It was last shown in this FSU section on 2/13/14 with annotated graphs under the headline, "Extended From Prior Highs After 6th Straight Gain", yet rallied further into new high territory with above average volume behind its gains, getting more extended from any sound base. Disciplined investors may watch for a new base or secondary buy point to possibly develop and be noted in the weeks ahead.
The stock has faced no resistance due to overhead supply while rallying well above its prior highs and above the "max buy" level cited in prior reports. The Leisure - Travel Booking firm has earned great ranks, including the highest possible rating of 99 for earnings Per Share (EPS). Its strong annual earnings history satisfies the A criteria.
PCLN reported earnings +31% on +29% sales revenues for the quarter ended December 31, 2013, a 2nd quarterly earnings comparison above the +25% minimum earnings guideline (C criteria) after a slightly sub par Jun '13 report. Its small supply of only 52.1 million outstanding shares (S criteria) can contribute to price volatility in the event of institutional buying or selling.
Keep in mind, the investment system's biggest winning models were typically held by at least a few mutual funds and attracting many others. However, once a stock is very heavily owned by a long list of mutual funds, as is now the case with PCLN, investors should be especially cautious and alert for any technical sell signals or fundamental disappointments which could prompt a rush for the exits. The number of top-rated funds owning its shares rose from 1,594 in Mar '13 to 1,876 in Dec '13, and increasing interest is an encouraging sign concerning the I criteria.
|
|
|
Color Codes Explained :
Y - Better candidates highlighted by our
staff of experts.
G - Previously featured
in past reports as yellow but may no longer be buyable under the
guidelines.
***Last / Change / Volume data in this table is the closing quote data***
Symbol/Exchange
Company Name
Industry Group |
PRICE |
CHANGE
(%Change) |
Day High |
Volume
(% DAV)
(% 50 day avg vol) |
52 Wk Hi
% From Hi |
Featured
Date |
Price
Featured |
Pivot Featured |
|
Max Buy |
EQM
-
NYSE
E Q T Midstream Partners
ENERGY - Oil and Gas Pipelines
|
$65.25
|
+0.03
0.05% |
$65.80
|
339,978
317.74% of 50 DAV
50 DAV is 107,000
|
$67.80
-3.76%
|
12/12/2013
|
$53.17
|
PP = $56.51
|
|
MB = $59.34
|
 Most Recent Note - 3/10/2014 3:47:05 PM
G - Still stubbornly holding its ground since reporting earnings -2% on +22% sales revenues for the Dec '13 quarter, below the +25% minimum earnings guideline (C criteria), raising fundamental concerns. Its 50 DMA line ($62.85 now) defines near-term support where a violation may trigger a technical sell signal.
>>> FEATURED STOCK ARTICLE : Resilient Despite Fundamental Concerns - 3/3/2014
View all notes |
Set NEW NOTE alert |
CANSLIM.net Company Profile |
SEC
News |
Chart |
Request a new note
C
A N
S L
I M


|
FB
-
NASDAQ
Facebook Inc Cl A
INTERNET
|
$72.03
|
+2.23
3.19% |
$72.15
|
59,837,395
101.40% of 50 DAV
50 DAV is 59,014,000
|
$71.97
0.08%
|
12/12/2013
|
$51.40
|
PP = $54.93
|
|
MB = $57.68
|
Most Recent Note - 3/10/2014 3:48:57 PM
G - Hitting another new all-time high with today's gain. Getting more extended from any sound base and its 50 DMA line ($61.97 now) defining near-term support to watch.
>>> FEATURED STOCK ARTICLE : High-Ranked Internet Group Leader is Extended From Base - 2/25/2014
View all notes |
Set NEW NOTE alert |
CANSLIM.net Company Profile |
SEC
News |
Chart |
Request a new note
C
A N
S L
I M
|
FLT
-
NYSE
Fleetcor Technologies
DIVERSIFIED SERVICES - Business/Management Services
|
$124.07
|
-1.81
-1.44% |
$127.31
|
572,327
50.38% of 50 DAV
50 DAV is 1,136,000
|
$132.22
-6.16%
|
3/5/2014
|
$125.40
|
PP = $124.06
|
|
MB = $130.26
|
Most Recent Note - 3/5/2014 5:17:07 PM
Y - Highlighted in yellow in the earlier mid-day report (read here) with pivot point cited based on its 12/02/13 high plus 10 cents. Consolidating above prior highs following a recent spurt of volume-driven gains for new 52-week highs, and technically, it broke out last week. After dropped from the Featured Stocks list on 1/15/14 it rebounded above its 50 DMA line and made gradual progress. Fundamentals remain strong with earnings +32% on +26% sales revenues for the Dec '13 continuing its strong earnings history satisfying the C criteria. See the latest FSU analysis for more details and new annotated graphs.
>>> FEATURED STOCK ARTICLE : Consolidating Following Recent Breakout to New High Territory - 3/5/2014
View all notes |
Set NEW NOTE alert |
CANSLIM.net Company Profile |
SEC
News |
Chart |
Request a new note
C
A N
S L
I M
|
GNRC
-
NYSE
Generac Hldgs Inc
Electrical-Power/Equipmt
|
$58.77
|
-0.47
-0.79% |
$59.74
|
401,037
42.75% of 50 DAV
50 DAV is 938,000
|
$59.55
-1.31%
|
2/14/2014
|
$56.50
|
PP = $57.39
|
|
MB = $60.26
|
Most Recent Note - 3/10/2014 3:52:16 PM
Y - Volume totals have been below average in recent weeks making limited headway above prior resistance in the $57 area. Volume should be at least +40% above average as a stock rallies above its pivot point to trigger a proper technical buy signal.
>>> FEATURED STOCK ARTICLE : Following Island Reversal Prior Highs May Act as Resistance - 2/14/2014
View all notes |
Set NEW NOTE alert |
CANSLIM.net Company Profile |
SEC
News |
Chart |
Request a new note
C
A N
S L
I M
|
ICON
-
NASDAQ
Iconix Brand Group Inc
CONSUMER NON-DURABLES - Textile - Apparel Footwear
|
$41.19
|
+0.14
0.34% |
$41.36
|
990,911
167.38% of 50 DAV
50 DAV is 592,000
|
$42.47
-3.01%
|
3/7/2014
|
$41.46
|
PP = $40.88
|
|
MB = $42.92
|
Most Recent Note - 3/10/2014 3:54:30 PM
Y - Holding its ground above prior highs in the $40 area defining near-term support. Encountered distributional pressure on the prior session after highlighted in yellow with pivot point cited based on its 12/02/13 high plus 10 cents in the mid-day report (read here). See the latest FSU analysis for more details and annotated daily and weekly graphs.
>>> FEATURED STOCK ARTICLE : Encountered Distributional Pressure Following Recent Breakout - 3/7/2014
View all notes |
Set NEW NOTE alert |
CANSLIM.net Company Profile |
SEC
News |
Chart |
Request a new note
C
A N
S L
I M
|
Symbol/Exchange
Company Name
Industry Group |
PRICE |
CHANGE
(%Change) |
Day High |
Volume
(% DAV)
(% 50 day avg vol) |
52 Wk Hi
% From Hi |
Featured
Date |
Price
Featured |
Pivot Featured |
|
Max Buy |
KORS
-
NYSE
Michael Kors Hldgs Ltd
RETAIL - Apparel Stores
|
$98.27
|
-0.01
-0.01% |
$99.06
|
1,413,394
39.24% of 50 DAV
50 DAV is 3,602,000
|
$101.04
-2.74%
|
2/4/2014
|
$90.92
|
PP = $84.68
|
|
MB = $88.91
|
Most Recent Note - 3/5/2014 5:23:42 PM
G - Holding its ground in a tight range near its 52-week high with volume totals cooling in recent weeks indicating that few investors have headed for the exit. Prior highs in the $84 area define the nearest chart support level.
>>> FEATURED STOCK ARTICLE : Extended From Sound Base and Wedging Higher - 2/19/2014
View all notes |
Set NEW NOTE alert |
CANSLIM.net Company Profile |
SEC
News |
Chart |
Request a new note
C
A N
S L
I M
|
LEAF
-
NYSE
Springleaf Holdings Inc
Finance-Consumer Loans
|
$27.86
|
-0.10
-0.36% |
$28.12
|
308,128
106.25% of 50 DAV
50 DAV is 290,000
|
$29.50
-5.56%
|
2/24/2014
|
$28.60
|
PP = $27.44
|
|
MB = $28.81
|
Most Recent Note - 3/5/2014 5:21:17 PM
Y - Gapped down today for a loss with above average volume yet ended in the middle of its intra-day range. Prior highs in the $27 area define initial support to watch following its recent technical breakout. Disciplined investors avoid chasing extended stocks more than +5% above prior highs and always limit losses by selling any stock that falls more than -7% from their purchase price. See the annotated daily graph below this note and details with a weekly graph in the latest FSU analysis.

>>> FEATURED STOCK ARTICLE : Breakout Backed by Four Times Average Volume - 2/24/2014
View all notes |
Set NEW NOTE alert |
CANSLIM.net Company Profile |
SEC
News |
Chart |
Request a new note
C
A N
S L
I M
|
PCLN
-
NASDAQ
Priceline.com Inc
INTERNET - Internet Software and Services
|
$1,343.44
|
-14.60
-1.08% |
$1,358.84
|
630,161
82.92% of 50 DAV
50 DAV is 760,000
|
$1,378.96
-2.58%
|
12/18/2013
|
$1,156.20
|
PP = $1,198.85
|
|
MB = $1,258.79
|
Most Recent Note - 3/10/2014 5:33:40 PM
G - Volume totals have been cooling while perched near its 52-week high, stubbornly holding its ground. See the latest FSU analysis for more details and new annotated graphs.
>>> FEATURED STOCK ARTICLE : Perched At Highs With Volume Totals Cooling - 3/10/2014
View all notes |
Set NEW NOTE alert |
CANSLIM.net Company Profile |
SEC
News |
Chart |
Request a new note
C
A N
S L
I M
|
PSIX
-
NASDAQ
Power Solutions Intl Inc
Machinery-Gen Industrial
|
$84.45
|
+0.18
0.21% |
$86.00
|
72,947
125.77% of 50 DAV
50 DAV is 58,000
|
$84.97
-0.62%
|
2/28/2014
|
$74.65
|
PP = $76.93
|
|
MB = $80.78
|
Most Recent Note - 3/7/2014 4:00:13 PM
G - Hit another new 52-week high today's considerable volume-driven gain and its color code is changed to green after rallying beyond its "max buy" level. The prior gain above the pivot point was backed by +92% above average volume triggering a technical buy signal.

>>> FEATURED STOCK ARTICLE : Earnings Solid and Forming a Cup-With-Handle - 2/28/2014
View all notes |
Set NEW NOTE alert |
CANSLIM.net Company Profile |
SEC
News |
Chart |
Request a new note
C
A N
S L
I M
|
SILC
-
NASDAQ
Silicom Ltd
COMPUTER HARDWARE - Networking andamp; Communication Dev
|
$67.41
|
-1.74
-2.52% |
$69.07
|
66,692
82.34% of 50 DAV
50 DAV is 81,000
|
$73.44
-8.21%
|
12/23/2013
|
$44.62
|
PP = $46.25
|
|
MB = $48.56
|
Most Recent Note - 3/10/2014 3:59:39 PM
G - Pulled back from all-time highs with today's 3rd consecutive loss. Very extended from any sound base after a streak of 11 straight weekly gains. Patient investors may watch for a new base or secondary buy point to possibly develop and be noted in the weeks ahead.
>>> FEATURED STOCK ARTICLE : Very Extended From Prior Base After 11 Straight Weekly Gains - 3/6/2014
View all notes |
Set NEW NOTE alert |
CANSLIM.net Company Profile |
SEC
News |
Chart |
Request a new note
C
A N
S L
I M
|
Symbol/Exchange
Company Name
Industry Group |
PRICE |
CHANGE
(%Change) |
Day High |
Volume
(% DAV)
(% 50 day avg vol) |
52 Wk Hi
% From Hi |
Featured
Date |
Price
Featured |
Pivot Featured |
|
Max Buy |
ULTI
-
NASDAQ
Ultimate Software Group
INTERNET - Internet Software and Services
|
$157.63
|
-2.02
-1.27% |
$159.78
|
201,503
136.15% of 50 DAV
50 DAV is 148,000
|
$171.96
-8.33%
|
1/27/2014
|
$153.75
|
PP = $162.98
|
|
MB = $171.13
|
Most Recent Note - 3/5/2014 5:24:56 PM
Y - Still hovering above its pivot point and below its "max buy" level. Found support above its 50 DMA line following a worrisome "negative reversal" on 2/05/14.
>>> FEATURED STOCK ARTICLE : Near 52--Week High Following Another Volume-Driven Gain - 3/4/2014
View all notes |
Set NEW NOTE alert |
CANSLIM.net Company Profile |
SEC
News |
Chart |
Request a new note
C
A N
S L
I M
|
VRX
-
NYSE
Valeant Pharmaceuticals
DRUGS - Drug Manufacturers - Other
|
$140.74
|
-0.63
-0.45% |
$141.88
|
1,920,113
116.16% of 50 DAV
50 DAV is 1,653,000
|
$153.10
-8.07%
|
9/11/2013
|
$100.26
|
PP = $105.50
|
|
MB = $110.78
|
Most Recent Note - 3/7/2014 1:16:35 PM
G - Testing its 50 DMA line ($134) which defines near-term support. A more damaging violation may raise serious concerns and trigger a more worrisome technical sell signal.
>>> FEATURED STOCK ARTICLE : Strong Earnings Report; On Track for 9th Weekly Gain in 10 Weeks - 2/27/2014
View all notes |
Set NEW NOTE alert |
CANSLIM.net Company Profile |
SEC
News |
Chart |
Request a new note
C
A N
S L
I M
|
|
|
|
THESE ARE NOT BUY RECOMMENDATIONS!
Comments contained in the body of this report are technical
opinions only. The material herein has been obtained
from sources believed to be reliable and accurate, however,
its accuracy and completeness cannot be guaranteed.
This site is not an investment advisor, hence it does
not endorse or recommend any securities or other investments.
Any recommendation contained in this report may not
be suitable for all investors and it is not to be deemed
an offer or solicitation on our part with respect to
the purchase or sale of any securities. All trademarks,
service marks and trade names appearing in this report
are the property of their respective owners, and are
likewise used for identification purposes only.
This report is a service available
only to active Paid Premium Members.
You may opt-out of receiving report notifications
at any time. Questions or comments may be submitted
by writing to Premium Membership Services 665 S.E. 10 Street, Suite 201 Deerfield Beach, FL 33441-5634 or by calling 1-800-965-8307
or 954-785-1121.
|
|
|

