Symbol/Exchange
Company Name
Industry Group |
PRICE |
CHANGE
(%Change) |
Day High |
Volume
(% DAV)
(% 50 day avg vol) |
52 Wk Hi
% From Hi |
Featured
Date |
Price
Featured |
Pivot Featured |
| Max Buy |
ADS - NYSE
Alliance Data Sys Corp
COMPUTER SOFTWARE and SERVICES - Information and Delivery Service |
$122.90 |
+0.61
0.50% |
$123.45 |
461,511
64.25% of 50 DAV
50 DAV is 718,300 |
$123.46
-0.45%
|
1/17/2012 |
$108.24 |
PP = $107.43 |
| MB = $112.80 |
Most Recent Note - 3/7/2012 6:48:06 PM
G - Posted a small gain today with twice its average volume total. Fundamental concerns were raised by earnings reported +9%, well below the +25% minimum guideline in the latest quarter ended December 31, 2011.
>>> The latest Featured Stock Update with an annotated graph appeared on 2/29/2012. Click here.
View all notes | Alert me of new notes | CANSLIM.net Company Profile | SEC | Zacks Reports | StockTalk | News | Chart |
Request a new note C A N S L I M    |
ALXN - NASDAQ
Alexion Pharmaceuticals
DRUGS - Drug Manufacturers - Other |
$84.73 |
-0.18
-0.21% |
$85.39 |
1,050,977
86.03% of 50 DAV
50 DAV is 1,221,600 |
$87.63
-3.31%
|
11/30/2011 |
$68.66 |
PP = $70.52 |
| MB = $74.05 |
Most Recent Note - 3/7/2012 6:50:20 PM
G - Still holding its ground stubbornly in a tight range near its all-time high with volume totals cooling. Support to watch is its 50 DMA line (now $78).
>>> The latest Featured Stock Update with an annotated graph appeared on 2/24/2012. Click here.
View all notes | Alert me of new notes | CANSLIM.net Company Profile | SEC | Zacks Reports | StockTalk | News | Chart |
Request a new note C A N S L I M |
BODY - NASDAQ
Body Central Corp
RETAIL - Catalog andamp; Mail Order Houses |
$26.75 |
-1.95
-6.79% |
$27.79 |
1,252,309
673.28% of 50 DAV
50 DAV is 186,000 |
$29.49
-9.29%
|
1/27/2012 |
$26.69 |
PP = $25.46 |
| MB = $26.73 |
 Most Recent Note - 3/9/2012 10:37:44 AM Most Recent Note - 3/9/2012 10:37:44 AM
G - Reported earnings +52% on +20% sales revenues for the quarter ended December 31, 2011 versus the year ago period. Testing important support near its 50 DMA line and prior highs in the $26 area after a gap down and considerable volume-driven loss today violated the previously noted upward trendline connecting its Nov-Feb lows.
>>> The latest Featured Stock Update with an annotated graph appeared on 1/27/2012. Click here.
View all notes | Alert me of new notes | CANSLIM.net Company Profile | SEC | Zacks Reports | StockTalk | News | Chart |
Request a new note C A N S L I M |
CATM - NASDAQ
Cardtronics Inc
DIVERSIFIED SERVICES - Business/Management Services |
$27.39 |
-0.02
-0.07% |
$27.94 |
194,417
48.15% of 50 DAV
50 DAV is 403,800 |
$28.74
-4.70%
|
2/24/2012 |
$27.94 |
PP = $28.30 |
| MB = $29.72 |
Most Recent Note - 3/9/2012 8:38:42 PM
Y - Pulled back today for a 4th consecutive small loss on below average volume while staying perched near its pivot point cited, not yet triggering a technical buy signal. Disciplined investors resist the urge to get in early while confirming gains are still needed.
>>> The latest Featured Stock Update with an annotated graph appeared on 1/30/2012. Click here.
View all notes | Alert me of new notes | CANSLIM.net Company Profile | SEC | Zacks Reports | StockTalk | News | Chart |
Request a new note C A N S L I M |
CDNS - NASDAQ
Cadence Design Systems
COMPUTER SOFTWARE and SERVICES - Technical and System Software |
$12.01 |
+0.05
0.42% |
$12.25 |
3,735,505
115.51% of 50 DAV
50 DAV is 3,233,800 |
$12.11
-0.83%
|
2/3/2012 |
$11.66 |
PP = $11.15 |
| MB = $11.71 |
Most Recent Note - 3/9/2012 8:40:01 PM
Y - Touched a new 52-week high today with a gain on average volume. Color code remains yellow because a secondary buy point the experts teach in the Certification allows buying from the first test of support at the 10-week moving average up to +5% above the latest high ($12.11 plus another +5% in this example) following an earlier technical breakout.
>>> The latest Featured Stock Update with an annotated graph appeared on 2/3/2012. Click here.
View all notes | Alert me of new notes | CANSLIM.net Company Profile | SEC | Zacks Reports | StockTalk | News | Chart |
Request a new note C A N S L I M |
Symbol/Exchange
Company Name
Industry Group |
PRICE |
CHANGE
(%Change) |
Day High |
Volume
(% DAV)
(% 50 day avg vol) |
52 Wk Hi
% From Hi |
Featured
Date |
Price
Featured |
Pivot Featured |
| Max Buy |
CELG - NASDAQ
Celgene Corp
DRUGS - Drug Manufacturers - Major |
$75.18 |
+0.94
1.27% |
$75.27 |
2,821,957
91.00% of 50 DAV
50 DAV is 3,100,900 |
$76.09
-1.20%
|
2/2/2012 |
$74.16 |
PP = $75.21 |
| MB = $78.97 |
Most Recent Note - 3/8/2012 2:15:56 PM
Y - Rising with light volume after a pullback tested its 50 DMA line and prior lows in the $71 area previously noted as important chart support to watch. Within striking distance of its all-time high ($77.39 in Aug '08). Any subsequent volume-driven gains would be a reassuring sign of fresh institutional demand
>>> The latest Featured Stock Update with an annotated graph appeared on 2/2/2012. Click here.
View all notes | Alert me of new notes | CANSLIM.net Company Profile | SEC | Zacks Reports | StockTalk | News | Chart |
Request a new note C A N S L I M |
COO - NYSE
Cooper Companies Inc
HEALTH SERVICES - Medical Instruments and Supplies |
$81.96 |
+3.03
3.84% |
$83.85 |
1,451,914
402.86% of 50 DAV
50 DAV is 360,400 |
$84.20
-2.66%
|
9/1/2004 |
$83.05 |
PP = $81.02 |
| MB = $85.07 |
Most Recent Note - 3/9/2012 8:37:04 PM
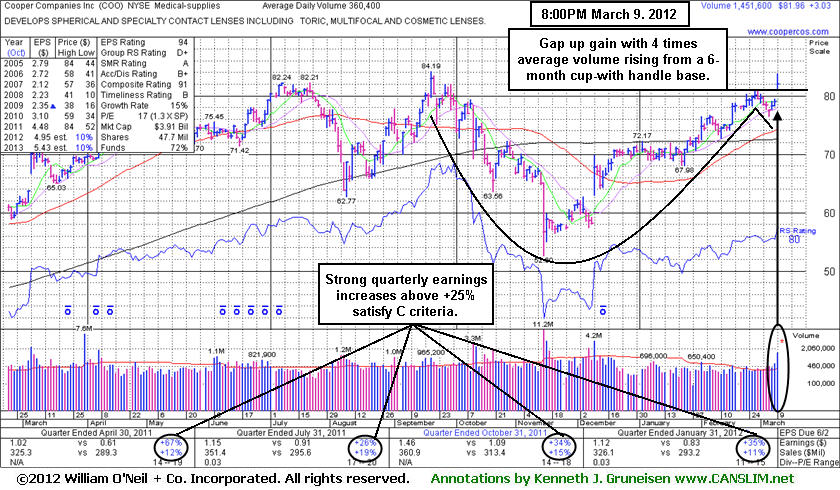
Y - Gap up gain today with 4 times average volume triggered a technical buy signal as it rose from a near 6-month cup-with-handle base pattern. See the latest FSU analysis for more details and a new annotated graph.
>>> The latest Featured Stock Update with an annotated graph appeared on 3/9/2012. Click here.
View all notes | Alert me of new notes | CANSLIM.net Company Profile | SEC | Zacks Reports | StockTalk | News | Chart |
Request a new note C A N S L I M |
DISH - NASDAQ
Dish Network Corp Cl A
CONSUMER DURABLES - Electronic Equipment |
$31.46 |
+0.11
0.35% |
$31.63 |
1,366,857
50.13% of 50 DAV
50 DAV is 2,726,500 |
$32.57
-3.39%
|
3/7/2012 |
$30.83 |
PP = $30.10 |
| MB = $31.61 |
Most Recent Note - 3/9/2012 8:51:39 PM
Y - Lighter volume was behind today's 6th consecutive gain. It remains within 5% of its pivot point, not too extended from its latest base. Prior highs in the $30 area define initial support to watch on pullbacks. The annotated graph below was included when first featured in the mid-day report on Wednesday.

There are no Featured Stock Updates™ available for this stock at this time. You may request one by clicking the Request a New Note link below
View all notes | Alert me of new notes | CANSLIM.net Company Profile | SEC | Zacks Reports | StockTalk | News | Chart |
Request a new note C A N S L I M |
ECHO - NASDAQ
Echo Global Logistics
DIVERSIFIED SERVICES - Business/Management Services |
$18.16 |
+0.15
0.83% |
$18.29 |
60,785
77.43% of 50 DAV
50 DAV is 78,500 |
$19.38
-6.30%
|
2/22/2012 |
$18.50 |
PP = $18.63 |
| MB = $19.56 |
Most Recent Note - 3/6/2012 12:11:24 PM
Y - Slumping near its 50 DMA line today following 2 damaging volume-driven gaps down in the past week. Gaps down are considered signs of distributional pressure. It has slumped below its pivot point, raising concerns.
>>> The latest Featured Stock Update with an annotated graph appeared on 2/23/2012. Click here.
View all notes | Alert me of new notes | CANSLIM.net Company Profile | SEC | Zacks Reports | StockTalk | News | Chart |
Request a new note C A N S L I M |
FEIC - NASDAQ
F E I Co
ELECTRONICS - Diversified Electronics |
$45.09 |
+0.69
1.55% |
$45.48 |
261,506
82.29% of 50 DAV
50 DAV is 317,800 |
$48.31
-6.67%
|
12/7/2011 |
$41.41 |
PP = $42.35 |
| MB = $44.47 |
Most Recent Note - 3/8/2012 2:03:18 PM
G - Considerable gain today, rebounding back above its 50 DMA line and helping its technical stance improve. However, it recently reported +21% earnings for Dec '11 quarter, below the +25% minimum guideline for earnings growth.
>>> The latest Featured Stock Update with an annotated graph appeared on 1/25/2012. Click here.
View all notes | Alert me of new notes | CANSLIM.net Company Profile | SEC | Zacks Reports | StockTalk | News | Chart |
Request a new note C A N S L I M |
Symbol/Exchange
Company Name
Industry Group |
PRICE |
CHANGE
(%Change) |
Day High |
Volume
(% DAV)
(% 50 day avg vol) |
52 Wk Hi
% From Hi |
Featured
Date |
Price
Featured |
Pivot Featured |
| Max Buy |
GNC - NYSE
G N C Holdings Inc
RETAIL - Drug Stores |
$31.54 |
-0.26
-0.82% |
$32.67 |
1,617,000
165.93% of 50 DAV
50 DAV is 974,500 |
$33.70
-6.41%
|
1/19/2012 |
$28.99 |
PP = $29.60 |
| MB = $31.08 |
Most Recent Note - 3/6/2012 1:29:43 PM
G - Pulling back today, consolidating well above prior highs in the $29.50 area and its 50 DMA line defining near-term support to watch.
>>> The latest Featured Stock Update with an annotated graph appeared on 3/5/2012. Click here.
View all notes | Alert me of new notes | CANSLIM.net Company Profile | SEC | Zacks Reports | StockTalk | News | Chart |
Request a new note C A N S L I M |
GOLD - NASDAQ
Randgold Resources Adr
METALS and MINING - Gold |
$112.41 |
+0.75
0.67% |
$113.11 |
654,076
144.55% of 50 DAV
50 DAV is 452,500 |
$120.73
-6.89%
|
2/7/2012 |
$116.21 |
PP = $120.83 |
| MB = $126.87 |
Most Recent Note - 3/9/2012 12:25:41 PM
G - Finding support near its 50 DMA line after recently undercutting that important short-term average and dipping below its prior low ($108.63 on 2/16/12). It faces resistance due to overhead supply up through the $120 area.
>>> The latest Featured Stock Update with an annotated graph appeared on 2/8/2012. Click here.
View all notes | Alert me of new notes | CANSLIM.net Company Profile | SEC | Zacks Reports | StockTalk | News | Chart |
Request a new note C A N S L I M |
HLF - NYSE
Herbalife Ltd
DRUGS - Nutrition and Weight Management |
$69.29 |
+2.41
3.60% |
$70.35 |
2,379,796
186.42% of 50 DAV
50 DAV is 1,276,600 |
$68.01
1.88%
|
2/22/2012 |
$65.90 |
PP = $63.50 |
| MB = $66.68 |
Most Recent Note - 3/9/2012 12:31:04 PM
G - Up today, rising further above its "max buy" level and getting more extended from its prior base pattern. Prior highs in the $63 area define support to watch on pullbacks.
>>> The latest Featured Stock Update with an annotated graph appeared on 2/22/2012. Click here.
View all notes | Alert me of new notes | CANSLIM.net Company Profile | SEC | Zacks Reports | StockTalk | News | Chart |
Request a new note C A N S L I M |
ISRG - NASDAQ
Intuitive Surgical Inc
HEALTH SERVICES - Medical Appliances and Equipment |
$523.83 |
+6.97
1.35% |
$526.51 |
322,980
89.57% of 50 DAV
50 DAV is 360,600 |
$523.10
0.14%
|
12/20/2011 |
$442.43 |
PP = $449.16 |
| MB = $471.62 |
Most Recent Note - 3/8/2012 2:12:59 PM
G - Recently wedged to new all-time highs without great volume conviction and it is consolidating in a very tight trading range near its high for the past few weeks. December '11 quarterly earnings increased by just below the borderline +25% minimum guideline for ideal buy candidates.
>>> The latest Featured Stock Update with an annotated graph appeared on 3/1/2012. Click here.
View all notes | Alert me of new notes | CANSLIM.net Company Profile | SEC | Zacks Reports | StockTalk | News | Chart |
Request a new note C A N S L I M |
LULU - NASDAQ
Lululemon Athletica
MANUFACTURING - Textile Manufacturing |
$72.09 |
+1.15
1.62% |
$72.36 |
2,348,297
98.54% of 50 DAV
50 DAV is 2,383,200 |
$72.00
0.13%
|
1/10/2012 |
$60.97 |
PP = $59.46 |
| MB = $62.43 |
Most Recent Note - 3/8/2012 2:05:05 PM
G - Gapped up today and touched a new all-time high. It is extended from any sound base. Prior highs in the $61-64 area and its 50 DMA line define chart support to watch on pullbacks.
>>> The latest Featured Stock Update with an annotated graph appeared on 2/21/2012. Click here.
View all notes | Alert me of new notes | CANSLIM.net Company Profile | SEC | Zacks Reports | StockTalk | News | Chart |
Request a new note C A N S L I M |
Symbol/Exchange
Company Name
Industry Group |
PRICE |
CHANGE
(%Change) |
Day High |
Volume
(% DAV)
(% 50 day avg vol) |
52 Wk Hi
% From Hi |
Featured
Date |
Price
Featured |
Pivot Featured |
| Max Buy |
MA - NYSE
Mastercard Inc Cl A
DIVERSIFIED SERVICES - Business/Management Services |
$419.52 |
+2.26
0.54% |
$421.07 |
735,318
66.77% of 50 DAV
50 DAV is 1,101,300 |
$428.57
-2.11%
|
2/2/2012 |
$379.05 |
PP = $381.32 |
| MB = $400.39 |
Most Recent Note - 3/6/2012 10:54:18 AM
G - Small gap down today, retreating from its all-time high hit last week. Prior highs in the $381-384 area define support to watch on pullbacks.
>>> The latest Featured Stock Update with an annotated graph appeared on 2/17/2012. Click here.
View all notes | Alert me of new notes | CANSLIM.net Company Profile | SEC | Zacks Reports | StockTalk | News | Chart |
Request a new note C A N S L I M |
MELI - NASDAQ
Mercadolibre Inc
INTERNET - Internet Software and; Services |
$96.01 |
+0.78
0.82% |
$97.08 |
339,429
63.84% of 50 DAV
50 DAV is 531,700 |
$104.50
-8.12%
|
2/6/2012 |
$97.09 |
PP = $95.58 |
| MB = $100.36 |
Most Recent Note - 3/6/2012 10:58:27 AM
Y - Gapped down today, slumping under its pivot point and under prior highs in the $95 area, also violating an upward trendline connecting its October-February lows, raising concerns. Its 50 DMA line defines the next important support level to watch.
>>> The latest Featured Stock Update with an annotated graph appeared on 2/6/2012. Click here.
View all notes | Alert me of new notes | CANSLIM.net Company Profile | SEC | Zacks Reports | StockTalk | News | Chart |
Request a new note C A N S L I M |
MKTX - NASDAQ
Marketaxess Holdings Inc
FINANCIAL SERVICES - Investment Brokerage - Nationa |
$35.86 |
+0.14
0.39% |
$35.93 |
213,183
85.96% of 50 DAV
50 DAV is 248,000 |
$35.84
0.06%
|
3/8/2012 |
$35.80 |
PP = $35.52 |
| MB = $37.30 |
Most Recent Note - 3/8/2012 4:58:55 PM
Y - Rose to a new all-time high with today's gain backed by below average volume. Color code is changed to yellow with new pivot point cited based on its 2/03/12 high plus 10 cents. A gain above the pivot point backed at least +40% above average volume, ideally more, is needed to trigger a proper technical buy signal. See the latest FSU analysis for more details and a new annotated graph.
>>> The latest Featured Stock Update with an annotated graph appeared on 3/8/2012. Click here.
View all notes | Alert me of new notes | CANSLIM.net Company Profile | SEC | Zacks Reports | StockTalk | News | Chart |
Request a new note C A N S L I M |
RAX - NYSE
Rackspace Hosting Inc
INTERNET - Internet Software and; Services |
$53.63 |
-0.20
-0.37% |
$54.50 |
1,361,368
68.41% of 50 DAV
50 DAV is 1,990,100 |
$56.94
-5.81%
|
2/2/2012 |
$46.69 |
PP = $45.55 |
| MB = $47.83 |
Most Recent Note - 3/8/2012 2:09:03 PM
G - Rebounding without great volume behind gains following damaging losses earlier this week. Stayed well above its 50 DMA line and prior highs in the $46 area that define important near-term support to watch.
>>> The latest Featured Stock Update with an annotated graph appeared on 2/16/2012. Click here.
View all notes | Alert me of new notes | CANSLIM.net Company Profile | SEC | Zacks Reports | StockTalk | News | Chart |
Request a new note C A N S L I M |
RRTS - NYSE
Roadrunner Trans Systems
TRANSPORTATION - Air Delivery and Freight Service |
$17.89 |
+0.12
0.68% |
$17.89 |
74,559
54.78% of 50 DAV
50 DAV is 136,100 |
$18.44
-2.98%
|
2/10/2012 |
$17.40 |
PP = $17.50 |
| MB = $18.38 |
Most Recent Note - 3/9/2012 8:41:36 PM
Y - Posted a 3rd consecutive gain today on light volume. Prior highs in the $17 area define initial support to watch on pullbacks.
>>> The latest Featured Stock Update with an annotated graph appeared on 2/13/2012. Click here.
View all notes | Alert me of new notes | CANSLIM.net Company Profile | SEC | Zacks Reports | StockTalk | News | Chart |
Request a new note C A N S L I M |
Symbol/Exchange
Company Name
Industry Group |
PRICE |
CHANGE
(%Change) |
Day High |
Volume
(% DAV)
(% 50 day avg vol) |
52 Wk Hi
% From Hi |
Featured
Date |
Price
Featured |
Pivot Featured |
| Max Buy |
SHFL - NASDAQ
Shuffle Master Inc
MANUFACTURING - Diversified Machinery |
$16.80 |
+0.10
0.60% |
$16.88 |
495,148
92.92% of 50 DAV
50 DAV is 532,900 |
$17.49
-3.95%
|
3/6/2012 |
$17.07 |
PP = $15.25 |
| MB = $16.01 |
Most Recent Note - 3/9/2012 8:45:29 PM
G - Up today for a 5th consecutive gain, getting more extended from any sound base pattern. It may produce more climactic gains, but it is outside of the buyable range under the rules-based system, and patient investors may watch for secondary buy points to possibly develop and be noted.

There are no Featured Stock Updates™ available for this stock at this time. You may request one by clicking the Request a New Note link below
View all notes | Alert me of new notes | CANSLIM.net Company Profile | SEC | Zacks Reports | StockTalk | News | Chart |
Request a new note C A N S L I M |
SWI - NYSE
Solarwinds Inc
COMPUTER SOFTWARE and SERVICES - Application Software |
$37.41 |
+0.22
0.59% |
$37.50 |
1,498,836
130.88% of 50 DAV
50 DAV is 1,145,200 |
$39.75
-5.89%
|
1/26/2012 |
$32.36 |
PP = $33.78 |
| MB = $35.47 |
Most Recent Note - 3/9/2012 8:47:24 PM
G - Posted a 3rd consecutive gain today with volume picking up. Earnings below the +25% guideline for the Dec '11 quarter raised fundamental concerns.
>>> The latest Featured Stock Update with an annotated graph appeared on 1/26/2012. Click here.
View all notes | Alert me of new notes | CANSLIM.net Company Profile | SEC | Zacks Reports | StockTalk | News | Chart |
Request a new note C A N S L I M |
SXCI - NASDAQ
S X C Health Solutions
COMPUTER SOFTWARE and SERVICES - Healthcare Information Service |
$72.82 |
+0.28
0.39% |
$76.42 |
663,949
171.96% of 50 DAV
50 DAV is 386,100 |
$74.37
-2.08%
|
2/23/2012 |
$68.24 |
PP = $66.05 |
| MB = $69.35 |
Most Recent Note - 3/9/2012 12:52:32 PM
G - Off the session's earlier high after trading up for another new all-time high today. Prior highs in the $66 area define support to watch on pullbacks.
>>> The latest Featured Stock Update with an annotated graph appeared on 3/6/2012. Click here.
View all notes | Alert me of new notes | CANSLIM.net Company Profile | SEC | Zacks Reports | StockTalk | News | Chart |
Request a new note C A N S L I M |
TDG - NYSE
Transdigm Group Inc
AEROSPACE/DEFENSE - Aerospace/Defense Products and; Services |
$113.78 |
-0.16
-0.14% |
$114.92 |
240,232
61.68% of 50 DAV
50 DAV is 389,500 |
$121.48
-6.34%
|
2/29/2012 |
$120.10 |
PP = $118.93 |
| MB = $124.88 |
Most Recent Note - 3/6/2012 11:12:18 AM
Y - Gapped down today, encountering more distributional pressure. Its 50 DMA line defines important chart support to watch above prior highs in the $102 area.
>>> The latest Featured Stock Update with an annotated graph appeared on 2/10/2012. Click here.
View all notes | Alert me of new notes | CANSLIM.net Company Profile | SEC | Zacks Reports | StockTalk | News | Chart |
Request a new note C A N S L I M |
TNGO - NASDAQ
Tangoe Inc
COMPUTER SOFTWARE and SERVICES - Technical and System Software |
$18.42 |
-0.32
-1.71% |
$18.90 |
98,885
30.47% of 50 DAV
50 DAV is 324,500 |
$19.90
-7.44%
|
2/13/2012 |
$15.39 |
PP = $16.51 |
| MB = $17.34 |
Most Recent Note - 3/6/2012 11:41:19 AM
G - Small gap down today. Still consolidating above its "max buy" level and still too extended from prior highs in the $16 area to be considered buyable under the fact-based investment system's guidelines.
>>> The latest Featured Stock Update with an annotated graph appeared on 2/14/2012. Click here.
View all notes | Alert me of new notes | CANSLIM.net Company Profile | SEC | Zacks Reports | StockTalk | News | Chart |
Request a new note C A N S L I M |
Symbol/Exchange
Company Name
Industry Group |
PRICE |
CHANGE
(%Change) |
Day High |
Volume
(% DAV)
(% 50 day avg vol) |
52 Wk Hi
% From Hi |
Featured
Date |
Price
Featured |
Pivot Featured |
| Max Buy |
TSCO - NASDAQ
Tractor Supply Co
SPECIALTY RETAIL - Specialty Retail, Other |
$87.37 |
-0.10
-0.11% |
$87.93 |
547,494
75.47% of 50 DAV
50 DAV is 725,400 |
$88.65
-1.44%
|
1/12/2012 |
$79.12 |
PP = $75.58 |
| MB = $79.36 |
Most Recent Note - 3/7/2012 7:03:59 PM
G - Up today on near average volume while matching its best-ever close. It is extended from a sound base after tallying 5 weekly gains in the span of 6 weeks. Its 50 DMA line defines support to watch on pullbacks.
>>> The latest Featured Stock Update with an annotated graph appeared on 2/27/2012. Click here.
View all notes | Alert me of new notes | CANSLIM.net Company Profile | SEC | Zacks Reports | StockTalk | News | Chart |
Request a new note C A N S L I M |
UA - NYSE
Under Armour Inc Cl A
CONSUMER NON-DURABLES - Textile - Apparel Clothing |
$94.94 |
+2.09
2.25% |
$95.45 |
929,230
73.61% of 50 DAV
50 DAV is 1,262,400 |
$93.36
1.69%
|
2/15/2012 |
$85.77 |
PP = $84.86 |
| MB = $89.10 |
Most Recent Note - 3/7/2012 7:01:47 PM
G - Color code is changed to green again after rising back above its "max buy" level with a gain on lighter than average volume today. Recent gains above its pivot point did not have volume sufficient to trigger a proper technical buy signal. Pyramiding into a stock can help investors avoid chasing them too far above their pivot point.
>>> The latest Featured Stock Update with an annotated graph appeared on 2/15/2012. Click here.
View all notes | Alert me of new notes | CANSLIM.net Company Profile | SEC | Zacks Reports | StockTalk | News | Chart |
Request a new note C A N S L I M |
UBNT - NASDAQ
Ubiquiti Networks Inc
TELECOMMUNICATIONS - Diversified Communication Serv |
$25.50 |
+0.39
1.55% |
$25.90 |
135,650
44.16% of 50 DAV
50 DAV is 307,200 |
$28.97
-11.98%
|
1/27/2012 |
$22.25 |
PP = $23.14 |
| MB = $24.30 |
Most Recent Note - 3/7/2012 6:02:21 PM
Y - Up today with lighter (yet still above average) volume, closing back above its "max buy" level. No new pivot point is cited and it remains color coded yellow, as they teach in the Certification that a stock may be bought from its 10-week moving average (WMA) up to +5% above the latest high ($28.97 on 2/28/12 plus another 5%) following an earlier technical breakout.
>>> The latest Featured Stock Update with an annotated graph appeared on 2/1/2012. Click here.
View all notes | Alert me of new notes | CANSLIM.net Company Profile | SEC | Zacks Reports | StockTalk | News | Chart |
Request a new note C A N S L I M |
ULTA - NASDAQ
Ulta Salon Cosm & Frag
SPECIALTY RETAIL - Specialty Retail, Other |
$89.28 |
+0.01
0.01% |
$92.00 |
1,585,700
210.50% of 50 DAV
50 DAV is 753,300 |
$90.36
-1.20%
|
1/11/2012 |
$71.97 |
PP = $75.80 |
| MB = $79.59 |
Most Recent Note - 3/9/2012 12:53:19 PM
G - Reversed into the red after touching another new all-time high today. It is extended from any sound base pattern, meanwhile its prior highs near $75 and its 50 DMA line define important chart support.
>>> The latest Featured Stock Update with an annotated graph appeared on 2/28/2012. Click here.
View all notes | Alert me of new notes | CANSLIM.net Company Profile | SEC | Zacks Reports | StockTalk | News | Chart |
Request a new note C A N S L I M |
V - NYSE
Visa Inc Cl A
DIVERSIFIED SERVICES - Business/Management Services |
$117.17 |
-0.80
-0.68% |
$118.39 |
2,114,334
55.05% of 50 DAV
50 DAV is 3,840,500 |
$119.36
-1.83%
|
2/2/2012 |
$105.43 |
PP = $104.30 |
| MB = $109.52 |
Most Recent Note - 3/7/2012 6:45:03 PM
G - Recently wedged to new high territory with below average volume conviction behind its gains. Prior highs in the $103-104 area define support to watch. See the latest FSU analysis for more details and a new annotated weekly graph.
>>> The latest Featured Stock Update with an annotated graph appeared on 3/7/2012. Click here.
View all notes | Alert me of new notes | CANSLIM.net Company Profile | SEC | Zacks Reports | StockTalk | News | Chart |
Request a new note C A N S L I M |
Symbol/Exchange
Company Name
Industry Group |
PRICE |
CHANGE
(%Change) |
Day High |
Volume
(% DAV)
(% 50 day avg vol) |
52 Wk Hi
% From Hi |
Featured
Date |
Price
Featured |
Pivot Featured |
| Max Buy |