Symbol/Exchange
Company Name
Industry Group |
Last |
Chg. |
Vol
% DAV |
Date Featured |
Price Featured |
Latest Pivot Point
Featured |
Status |
| Latest Max Buy Price |
ARUN
- NASDAQ
Aruba Networks Inc
COMPUTER HARDWARE - Networking & Communication Dev
|
$13.43
|
+0.85
|
5,228,126
384% DAV
1,362,800
|
2/19/2010
(Date
Featured) |
$12.71
(Price
Featured) |
PP = $11.94 |
G |
| MB = $12.54 |
Most Recent Note - 3/9/2010 4:21:38 PM
G - Considerable gain for a new 52-week high today with volume nearly 4 times average. Getting extended from its prior base, its color code was changed to green. Support to watch is now defined by prior chart highs and its 50 DMA line. ARUN was featured in the mid-day report on 2/19/10 as it rose from a flat base-on-base pattern above its 50-day moving average line (read here).
>>> The latest Featured Stock Update with an annotated graph appeared on 2/22/2010. click here.
|
|
C
A
S
I |
News |
Chart |
SEC
View all notes Alert
me of new notes
Company
Profile
|
BIDU
- NASDAQ
Baidu Inc Ads
INTERNET - Internet Information Providers
|
$539.10
|
+4.77
|
1,515,609
79% DAV
1,930,300
|
1/13/2010
(Date
Featured) |
$431.25
(Price
Featured) |
PP = $426.75 |
G |
| MB = $448.09 |
Most Recent Note - 3/9/2010 4:24:07 PM
G - Small gain today with below average volume for yet another new all-time high. Its prior chart high near $470 is the nearest support level while it is extended above its mid-January highs. It rose steadily since the 2/10/10 gap up gain with more than 3 times average volume.
>>> The latest Featured Stock Update with an annotated graph appeared on 3/4/2010. click here.
|
|
C
A
S
I |
News |
Chart |
SEC
View all notes Alert
me of new notes
Company
Profile
|
BRLI
- NASDAQ
Bio Reference Labs Inc
HEALTH SERVICES - Medical Laboratories & Researc
|
$43.25
|
-0.12
|
125,746
137% DAV
91,800
|
2/12/2010
(Date
Featured) |
$39.02
(Price
Featured) |
PP = $40.97 |
G |
| MB = $43.02 |
Most Recent Note - 3/9/2010 4:27:22 PM
G - Holding its ground just above its "max buy" level since rallying to new 52-week highs last week. Breakout gain on 3/04/10 with 2 times average volume confirmed a technical buy signal. With no overhead supply, its weekly chart is marked by many up weeks with above average volume and few down weeks on volume -very bullish characteristics. This high-ranked Medical-Dental - Services firm was featured in yellow in the 2/12/10 mid-day report (read here).
>>> The latest Featured Stock Update with an annotated graph appeared on 3/1/2010. click here.
|
|
C
A
S
I |
News |
Chart |
SEC
View all notes Alert
me of new notes
Company
Profile
|
CACC
- NASDAQ
Credit Acceptance Corp
FINANCIAL SERVICES - Credit Services
|
$44.25
|
-0.06
|
77,359
131% DAV
58,900
|
9/29/2009
(Date
Featured) |
$33.48
(Price
Featured) |
PP = $37.10 |
G |
| MB = $38.96 |
Most Recent Note - 3/9/2010 4:29:12 PM
G - Posted a small loss on higher volume today, remaining below its 50 DMA line which has been acting as resistance. Recent lows in the $38 area are a nearby chart support level to watch.
>>> The latest Featured Stock Update with an annotated graph appeared on 3/2/2010. click here.
|
|
C
A
S
I |
News |
Chart |
SEC
View all notes Alert
me of new notes
Company
Profile
|
CISG
- NASDAQ
Cninsure Inc Ads
INSURANCE - Insurance Brokers
|
$25.71
|
-0.25
|
311,980
159% DAV
196,800
|
3/3/2010
(Date
Featured) |
$24.38
(Price
Featured) |
PP = $23.10 |
G |
| MB = $24.26 |
Most Recent Note - 3/9/2010 4:30:57 PM
G - Held its ground near its 52-week high today after 4 consecutive gains with above average volume. On 3/03/10 broke out with 8 times average volume following its latest earnings report for the quarter ended Dec 31, 2009. It rose from a 20-week double bottom base as it was featured in the 3/03/10 mid-day report (read here).
>>> The latest Featured Stock Update with an annotated graph appeared on 3/3/2010. click here.
|
|
C
A
S
I |
News |
Chart |
SEC
View all notes Alert
me of new notes
Company
Profile
|
CRM
- NYSE
Salesforce.com Inc
INTERNET - Internet Software & Services
|
$73.68
|
+0.73
|
2,338,572
114% DAV
2,057,600
|
3/5/2010
(Date
Featured) |
$72.28
(Price
Featured) |
PP = $75.53 |
Y |
| MB = $79.31 |
Most Recent Note - 3/9/2010 4:34:15 PM
Y - Posted a 4th consecutive gain today with slightly above average volume, closing only -2.4% from its all-time high. Recent chart low ($64.77 on 2/25/10) is now an important support level to watch.
>>> The latest Featured Stock Update with an annotated graph appeared on 3/5/2010. click here.
|
|
C
A
S
I |
News |
Chart |
SEC
View all notes Alert
me of new notes
Company
Profile
|
CTRP
- NASDAQ
Ctrip.com Intl Ltd Adr
LEISURE - Resorts & Casinos
|
$38.74
|
-0.66
|
1,587,737
73% DAV
2,176,200
|
3/1/2010
(Date
Featured) |
$38.23
(Price
Featured) |
PP = $38.50 |
Y |
| MB = $40.43 |
Most Recent Note - 3/9/2010 4:54:49 PM
Y - Gapped up today then negatively reversed and ended with a loss on lighter than average volume, still closing above its pivot point. It proposed and completed an offering of additional shares last week after it was recently featured in the new March 2010 issue of CANSLIM.net News (read here). A gain above its pivot point or its most recent chart highs is still needed to confirm a fresh technical buy signal with +50% above average volume or more.
>>> The latest Featured Stock Update with an annotated graph appeared on 2/28/2010. click here.
|
|
C
A
S
I |
News |
Chart |
SEC
View all notes Alert
me of new notes
Company
Profile
|
EZPW
- NASDAQ
Ezcorp Inc Cl A
SPECIALTY RETAIL - Specialty Retail, Other
|
$21.41
|
+0.42
|
764,114
165% DAV
462,700
|
2/19/2010
(Date
Featured) |
$19.03
(Price
Featured) |
PP = $18.80 |
G |
| MB = $19.74 |
Most Recent Note - 3/9/2010 4:55:41 PM
G - Gain today with above average volume for another new all-time high. Extended from any sound base of support, its prior chart highs in the $18 area define an important support level to watch. Featured in yellow in the 2/19/10 mid-day report (read here).
>>> The latest Featured Stock Update with an annotated graph appeared on 3/8/2010. click here.
|
|
C
A
S
I |
News |
Chart |
SEC
View all notes Alert
me of new notes
Company
Profile
|
GMCR
- NASDAQ
Green Mtn Coffee Roastrs
FOOD & BEVERAGE - Processed & Packaged Goods
|
$91.21
|
-1.23
|
1,253,131
93% DAV
1,352,600
|
2/26/2010
(Date
Featured) |
$84.39
(Price
Featured) |
PP = $88.75 |
Y |
| MB = $93.19 |
Most Recent Note - 3/9/2010 5:11:18 PM
Y - Negatively reversed today for a loss on near average volume after an early gain into new high ground. Gain on 3/08/10 with +66% above average volume while rising above its pivot point triggered a new technical buy signal. Important initial support level to watch is its 50 DMA line and recent lows near the $80 area.
>>> The latest Featured Stock Update with an annotated graph appeared on 2/23/2010. click here.
|
|
C
A
S
I |
News |
Chart |
SEC
View all notes Alert
me of new notes
Company
Profile
|
ISRG
- NASDAQ
Intuitive Surgical Inc
HEALTH SERVICES - Medical Appliances & Equipment
|
$355.66
|
-0.31
|
254,996
49% DAV
515,200
|
1/22/2010
(Date
Featured) |
$340.40
(Price
Featured) |
PP = $314.00 |
G |
| MB = $329.70 |
Most Recent Note - 3/9/2010 5:18:01 PM
G - Down on light volume today for a second straight session, consolidating after quietly touching new all-time high territory last week. ISRG was featured at $340.40 in the 1/22/10 mid-day report following a powerful breakaway gap (read here).
>>> The latest Featured Stock Update with an annotated graph appeared on 2/24/2010. click here.
|
|
C
A
S
I |
News |
Chart |
SEC
View all notes Alert
me of new notes
Company
Profile
|
PCLN
- NASDAQ
Priceline.com Inc
INTERNET - Internet Software & Services
|
$399.55
|
-4.72
|
584,812
N/A
|
11/1/2002
(Date
Featured) |
$399.55
(Price
Featured) |
PP = $428.20 |
Y |
| MB = $449.61 |
Most Recent Note - 1/2/2011
Y - Returns to Featured Stocks list with its appearance in the January 2011 CANSLIM.net News including detailed analysis and annotated daily and weekly graphs.
>>> The latest Featured Stock Update with an annotated graph appeared on 2/18/2010. click here.
|
|
C
A
S
I |
News |
Chart |
SEC
View all notes Alert
me of new notes
Company
Profile
|
PEGA
- NASDAQ
Pegasystems Inc
COMPUTER SOFTWARE & SERVICES - Business Software & Services
|
$36.09
|
+0.06
|
155,050
77% DAV
201,200
|
2/26/2010
(Date
Featured) |
$36.00
(Price
Featured) |
PP = $38.55 |
Y |
| MB = $40.48 |
Most Recent Note - 3/9/2010 6:00:24 PM
Y - Posted a third consecutive gain on light volume, perched within close striking distance of its pivot point. Recently finding support at its 50 DMA line, while prior chart lows in the $32 area are the next support level.
>>> The latest Featured Stock Update with an annotated graph appeared on 2/26/2010. click here.
|
|
C
A
S
I |
News |
Chart |
SEC
View all notes Alert
me of new notes
Company
Profile
|
ROVI
- NASDAQ
Rovi Corp
COMPUTER SOFTWARE & SERVICES - Security Software & Services
|
$35.82
|
+0.35
|
891,296
87% DAV
1,025,900
|
2/25/2010
(Date
Featured) |
$33.54
(Price
Featured) |
PP = $34.87 |
Y |
| MB = $36.61 |
Most Recent Note - 3/9/2010 6:06:05 PM
Y - Today it posted a 4th consecutive gain on light or near average volume for a new 52-week high. Considerable 3/02/10 gain with volume more than 2 times average triggered a technical buy signal as it rallied above its pivot point. It announced news after the 3/01/10 close about an expansion of its relationship with Comcast (read here). Featured on 2/25/10 in yellow in the mid-day report (read here).
>>> The latest Featured Stock Update with an annotated graph appeared on 2/25/2010. click here.
|
|
C
A
S
I |
News |
Chart |
SEC
View all notes Alert
me of new notes
Company
Profile
|
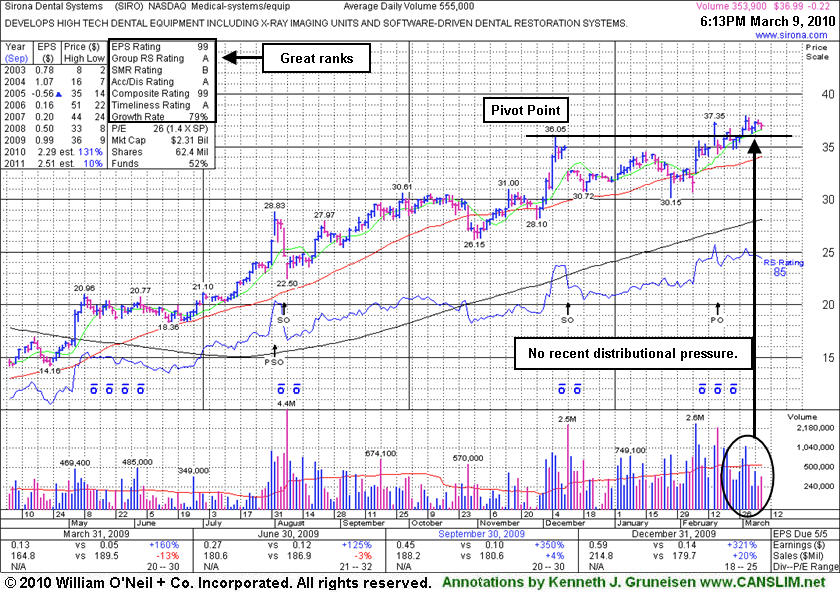
SIRO
- NASDAQ
Sirona Dental Systems
HEALTH SERVICES - Medical Instruments & Supplies
|
$36.99
|
-0.22
|
356,308
64% DAV
556,400
|
2/16/2010
(Date
Featured) |
$36.43
(Price
Featured) |
PP = $36.15 |
Y |
| MB = $37.96 |
Most Recent Note - 3/9/2010 6:06:52 PM
Y - Small loss on below average volume today leaves it still perched above its pivot point yet below its max buy level. It was featured in yellow in the 2/16/10 mid-day report (read here) as it broke out from a 10-week flat base.
>>> The latest Featured Stock Update with an annotated graph appeared on 3/9/2010. click here.
|
|
C
A
S
I |
News |
Chart |
SEC
View all notes Alert
me of new notes
Company
Profile
|
VPRT
- NASDAQ
Vistaprint Nv
DIVERSIFIED SERVICES - Business/Management Services
|
$62.05
|
+0.33
|
345,010
71% DAV
489,200
|
3/1/2010
(Date
Featured) |
$57.72
(Price
Featured) |
PP = $59.70 |
Y |
| MB = $62.69 |
Most Recent Note - 3/9/2010 6:07:30 PM
Y - Posted a 4th consecutive gain today on below average volume for a new all-time high above its pivot point, yet still under its max buy level. Its gain on 3/02/10 was below the volume guidelines for buyable breakouts under the investment system. Featured in the March 2010 CANSLIM.net News monthly newsletter (read here).
>>> The latest Featured Stock Update with an annotated graph appeared on 2/28/2010. click here.
|
|
C
A
S
I |
News |
Chart |
SEC
View all notes Alert
me of new notes
Company
Profile
|