You are not logged in.
This means you
CAN ONLY VIEW reports that were published prior to Monday, April 14, 2025.
You
MUST UPGRADE YOUR MEMBERSHIP if you want to see any current reports.
AFTER MARKET UPDATE - TUESDAY, MARCH 5TH, 2013
Previous After Market Report Next After Market Report >>>
|
|
|
|
DOW |
+125.95 |
14,253.77 |
+0.89% |
|
Volume |
683,015,530 |
-1% |
|
Volume |
1,831,913,420 |
+9% |
|
NASDAQ |
+42.10 |
3,224.13 |
+1.32% |
|
Advancers |
2,236 |
72% |
|
Advancers |
1,734 |
67% |
|
S&P 500 |
+14.59 |
1,539.79 |
+0.96% |
|
Decliners |
774 |
25% |
|
Decliners |
723 |
28% |
|
Russell 2000 |
+10.72 |
927.40 |
+1.17% |
|
52 Wk Highs |
440 |
|
|
52 Wk Highs |
248 |
|
|
S&P 600 |
+5.56 |
517.30 |
+1.09% |
|
52 Wk Lows |
26 |
|
|
52 Wk Lows |
24 |
|
|
 |
Dow Jones Industrial Average Hits All-Time High as Rally Resumes
Kenneth J. Gruneisen - Passed the CAN SLIM® Master's Exam
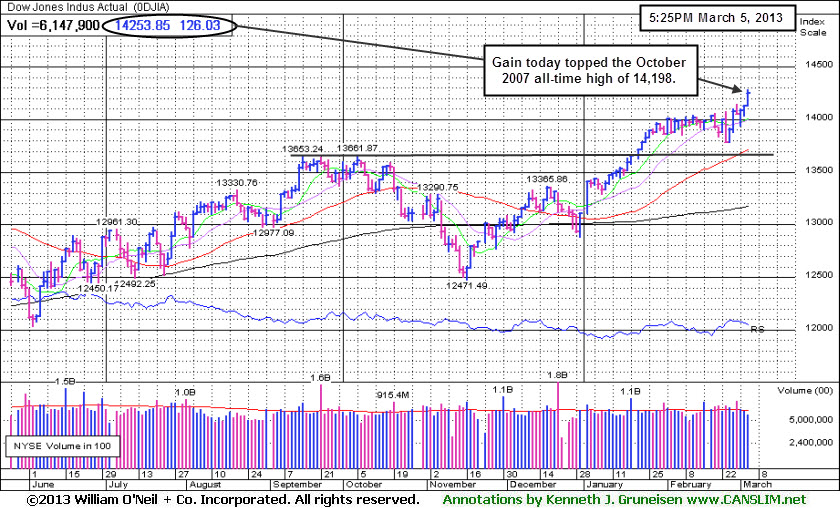
The major averages rallied on Tuesday and the Dow Jones Industrial Average closed at an all-time high as it rallied 125 points to 14,253. Volume totals were reported mixed, slightly lower than the prior session on the NYSE yet higher on the Nasdaq exchange. Coupled with solid leadership, the Nasdaq Composite Index's solid +1.32% gain on higher volume may be considered a follow-through day, shifting the market's (M criteria) direction to a confirmed rally again after a brief correction. Breadth was positive as advancers led decliners by nearly 3-1 on the NYSE and by more than 2-1 on the Nasdaq exchange. The total number of stocks hitting new 52-week highs (leadership) swelled and easily outnumbered new 52-week lows on the NYSE and on the Nasdaq exchange. There were 142 high-ranked companies from the CANSLIM.net Leaders List making new 52-week highs and appearing on the CANSLIM.net BreakOuts Page, up considerably from the prior session's total of 80 stocks. There were gains for 13 of the 16 high-ranked companies currently included on the Featured Stocks Page, a list that has recently expanded with a few new added leaders.
Stocks advanced above multi-year highs thanks to a batch of better-than-expected economic data. On our shores, the ISM's non-manufacturing index showed service-sector companies grew at a slightly faster pace in February and expanded for the 36th straight month. The sequester was on the back burner with House Republicans expected to introduce a bill to extend government funding through September. In Europe, euro zone leaders cut a bailout deal for Cyprus and the region’s services output shrank less than initially estimated in February while retail sales rose the most since 2010 in January. Meanwhile in Asia, China's government reduced fears with a pledge to increase fiscal spending to support economic growth.
All sectors gained ground. Technology was the best performing group, led by Apple Inc (AAPL +2.64%). Gains in industrials also lifted the market as Deere & Co (DE +2.32%). Industrial and telecommunication shares were also notable performers with General Electric Co (GE +1.38%) and Verizon Communications Inc (VZ +1.23%) gaining.
Treasury prices were lower with the risk-trade on. The 10-year note was down 5/32 to yield 1.89% and the 30-year bond was lower by 10/32 to yield 3.10%.
The S&P 500 Index touched a five and a half year high as it gained 14 points to 1,539. The Nasdaq Composite Index finished at its highest closing level since November 2000 as it advanced 42 points to 3,224.
Any sustainable rally requires a healthy crop of companies hitting new 52-week highs, so it is always essential to see meaningful leadership (stocks hitting new 52-week highs). New buying efforts are justified under the fact-based system since Nasdaq Composite Index's solid gain on higher volume may be considered a follow-through day, shifting the market's (M criteria) direction to a confirmed rally again after a brief correction.
Watch for an announcement via email concerning the next WEBCAST. The webcast will also be available via an updated link highlighted at the top of the Premium Member Homepage.
PICTURED: The Dow Jones Industrial Average closed at an all-time high.
|
 Kenneth J. Gruneisen started out as a licensed stockbroker in August 1987, a couple of months prior to the historic stock market crash that took the Dow Jones Industrial Average down -22.6% in a single day. He has published daily fact-based fundamental and technical analysis on high-ranked stocks online for two decades. Through FACTBASEDINVESTING.COM, Kenneth provides educational articles, news, market commentary, and other information regarding proven investment systems that work in good times and bad.
Comments contained in the body of this report are technical opinions only and are not necessarily those of Gruneisen Growth Corp. The material herein has been obtained from sources believed to be reliable and accurate, however, its accuracy and completeness cannot be guaranteed. Our firm, employees, and customers may effect transactions, including transactions contrary to any recommendation herein, or have positions in the securities mentioned herein or options with respect thereto. Any recommendation contained in this report may not be suitable for all investors and it is not to be deemed an offer or solicitation on our part with respect to the purchase or sale of any securities. |
|
 |
Tech, Retail, Financial, Healthcare, and Energy Groups Gained
Kenneth J. Gruneisen - Passed the CAN SLIM® Master's Exam
The Semiconductor Index ($SOX +1.98%) led the tech sector and the Networking Index ($NWX +1.10%), Biotechnology Index ($BTK +1.12%), and Internet Index ($IIX +1.13%) posted unanimous gains. Gains from the influential financial groups also underpinned the market's rally as the Broker/Dealer Index ($XBD +1.07%) outpaced the Bank Index ($BKX +0.38%). The Retail Index ($RLX +0.69%) rose and the Healthcare Index ($HMO +1.08%) showed strength. Positive action in energy-related shares rounded out the mostly positive session as the Integrated Oil Index ($XOI +0.88%) and Oil Services Index ($OSX +1.35%) posted gains. The Gold & Silver Index ($XAU -0.18%) sputtered for a small loss, continuing to lag behind growth oriented groups.
Charts courtesy www.stockcharts.com
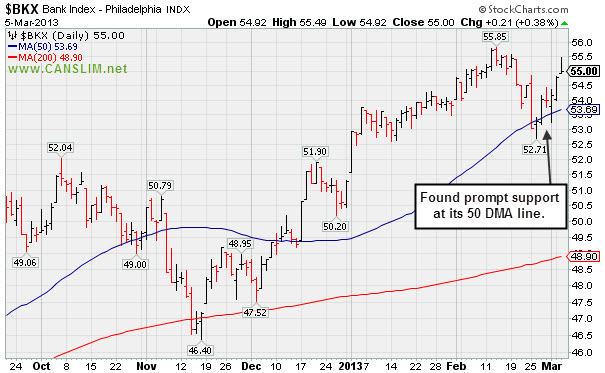
PICTURED: The Bank Index ($BKX +0.38%) recently found prompt support at its 50-day moving average (DMA) line.
| Oil Services |
$OSX |
241.82 |
+3.22 |
+1.35% |
+9.84% |
| Healthcare |
$HMO |
2,680.03 |
+28.65 |
+1.08% |
+6.60% |
| Integrated Oil |
$XOI |
1,344.75 |
+11.77 |
+0.88% |
+8.29% |
| Semiconductor |
$SOX |
432.39 |
+8.38 |
+1.98% |
+12.58% |
| Networking |
$NWX |
235.10 |
+2.55 |
+1.10% |
+3.77% |
| Internet |
$IIX |
363.99 |
+4.07 |
+1.13% |
+11.31% |
| Broker/Dealer |
$XBD |
107.66 |
+1.14 |
+1.07% |
+14.13% |
| Retail |
$RLX |
725.33 |
+4.96 |
+0.69% |
+11.07% |
| Gold & Silver |
$XAU |
128.89 |
-0.23 |
-0.18% |
-22.17% |
| Bank |
$BKX |
55.00 |
+0.21 |
+0.38% |
+7.25% |
| Biotech |
$BTK |
1,766.45 |
+19.61 |
+1.12% |
+14.18% |
|
|
|
 |
Earnings Below Guideline Raised Concerns After Technical Breakout
Kenneth J. Gruneisen - Passed the CAN SLIM® Master's Exam
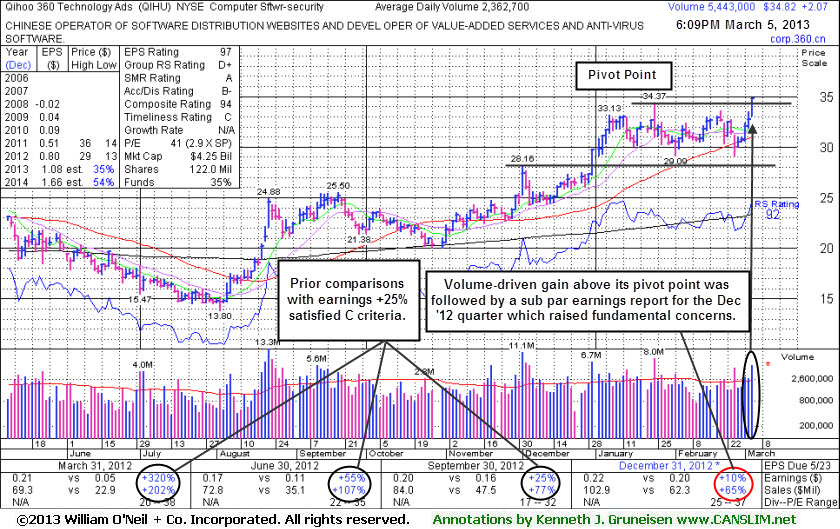
Often, when a leading stock is setting up to breakout of a solid base it is highlighted in CANSLIM.net's Mid-Day Breakouts Report. The most relevant factors are noted in the report which alerts prudent CANSLIM oriented investors to place the issue in their watch list. After doing any necessary backup research, the investor is prepared to act after the stock triggers a technical buy signal (breaks above its pivot point on more than +50% average turnover) but before it gets too extended from a sound base. In the event the stock fails to trigger a technical buy signal and its price declines then it will simply be removed from the watch list. Disciplined investors know to buy as near as possible to the pivot point and avoid chasing stocks after they have rallied more than +5% above their pivot point. It is crucial to always limit losses whenever any stock heads the wrong direction, and disciplined investors sell if a struggling stock ever falls more than -7% from their purchase price.
Qihoo 360 Technology Ads (QIHU +$2.07 or +6.32% to $34.82) was highlighted in yellow with pivot point based on its 1/24/13 high plus 10 cents in the earlier mid-day report (read here). The strong finish helped it technically break out from the previously noted base-on-base pattern being formed. However, it reported earnings +10% on +65% sales revenues for the Dec '12 quarter, below the +25% minimum earnings guideline (C criteria) after the close which raised fundamental concerns. As previously noted - "Volume and volatility often increase near earnings news."
It found prompt support at its 50-day moving average (DMA) line last week and above average volume behind today's 5th consecutive helped it hit a new 52-week high. The number of top-rated funds owning its share rose from 89 in Jun '12 to 116 in Dec '12, a reassuring sign concerning the I criteria. Strength from other leaders in the Computer Software - Security industry group has been a reassuring sign concerning the L criteria, although the group's current Relative Strength rating of D+ is below average. Prior mid-day reports cautioned - "Deceleration in its sales revenues and earnings growth rate in sequential quarterly comparisons through Sep '12 is cause for concern. Faces additional overhead supply up through the $36 area. Found support at its 200 DMA line in recent weeks. This Chinese Computer Software - Security firm's quarterly earnings (C criteria) and sales revenues increases have been strong."
|
|
|
Color Codes Explained :
Y - Better candidates highlighted by our
staff of experts.
G - Previously featured
in past reports as yellow but may no longer be buyable under the
guidelines.
***Last / Change / Volume data in this table is the closing quote data***
Symbol/Exchange
Company Name
Industry Group |
PRICE |
CHANGE
(%Change) |
Day High |
Volume
(% DAV)
(% 50 day avg vol) |
52 Wk Hi
% From Hi |
Featured
Date |
Price
Featured |
Pivot Featured |
|
Max Buy |
CELG
-
NASDAQ
Celgene Corp
DRUGS - Drug Manufacturers - Major
|
$108.37
|
+2.81
2.66% |
$108.51
|
4,037,130
105.12% of 50 DAV
50 DAV is 3,840,600
|
$105.82
2.41%
|
12/11/2012
|
$82.24
|
PP = $81.34
|
|
MB = $85.41
|
 Most Recent Note - 3/5/2013 1:52:36 PM
G - Hitting new all-time highs yet again with today's gain, getting extended from any sound base. Recent lows in the $96 area define near-term support above its 50 DMA line.
>>> The latest Featured Stock Update with an annotated graph appeared on 2/28/2013. Click here.
View all notes |
Alert me of new notes |
CANSLIM.net Company Profile |
SEC |
Zacks Reports |
StockTalk |
News |
Chart |
Request a new note
C
A N
S L
I M


|
CFNL
-
NASDAQ
Cardinal Financial Corp
BANKING - Regional - Southeast Banks
|
$16.58
|
+0.04
0.24% |
$16.65
|
121,572
63.42% of 50 DAV
50 DAV is 191,700
|
$16.90
-1.89%
|
12/3/2012
|
$15.20
|
PP = $16.31
|
|
MB = $17.13
|
Most Recent Note - 3/1/2013 3:59:51 PM
Y - Rebounding above its 50 DMA line and its color code is changed to yellow with today's gain helping its outlook improve.
>>> The latest Featured Stock Update with an annotated graph appeared on 2/21/2013. Click here.
View all notes |
Alert me of new notes |
CANSLIM.net Company Profile |
SEC |
Zacks Reports |
StockTalk |
News |
Chart |
Request a new note
C
A N
S L
I M
|
CMCSA
-
NASDAQ
Comcast Corp Cl A
MEDIA - CATV Systems
|
$40.95
|
+0.57
1.41% |
$41.04
|
12,340,728
88.20% of 50 DAV
50 DAV is 13,991,600
|
$42.00
-2.50%
|
12/3/2012
|
$37.08
|
PP = $38.06
|
|
MB = $39.96
|
Most Recent Note - 3/5/2013 1:41:04 PM
G - Volume totals have been cooling in the past week while consolidating above support at its 50 DMA line and still perched very near its 52-week high. Reported earnings +11% on +6% sales revenues for the Dec '12 quarter, below the +25% minimum earnings guideline (C criteria), raising fundamental concerns
>>> The latest Featured Stock Update with an annotated graph appeared on 2/19/2013. Click here.
View all notes |
Alert me of new notes |
CANSLIM.net Company Profile |
SEC |
Zacks Reports |
StockTalk |
News |
Chart |
Request a new note
C
A N
S L
I M
|
EVER
-
NYSE
Everbank Financial Corp
BANKING
|
$16.14
|
+0.77
5.01% |
$16.56
|
3,014,288
541.46% of 50 DAV
50 DAV is 556,700
|
$16.22
-0.49%
|
3/4/2013
|
$15.38
|
PP = $15.83
|
|
MB = $16.62
|
Most Recent Note - 3/5/2013 6:37:32 PM
Y - Hit a new 52-week high with today's volume-driven gain above the pivot point clearing the previously noted "double bottom" base pattern. The strong finish clinched a proper technical buy signal, and the major averages' gains confirmed a new rally with a follow-through-day (M criteria).
>>> The latest Featured Stock Update with an annotated graph appeared on 3/4/2013. Click here.
View all notes |
Alert me of new notes |
CANSLIM.net Company Profile |
SEC |
Zacks Reports |
StockTalk |
News |
Chart |
Request a new note
C
A N
S L
I M
|
JAZZ
-
NASDAQ
Jazz Pharmaceuticals Plc
DRUGS - Biotechnology
|
$59.13
|
-0.87
-1.45% |
$60.00
|
1,693,293
363.99% of 50 DAV
50 DAV is 465,200
|
$60.25
-1.86%
|
3/5/2013
|
$59.10
|
PP = $60.10
|
|
MB = $63.11
|
Most Recent Note - 3/5/2013 12:57:49 PM
Y - Color code is changed to yellow with new pivot point cited based on its 10/05/12 high plus 10 cents. Volume-driven gains above the pivot point may trigger a technical buy signal. Found support at its 200 DMA line in recent months and rebounded to its 52-week high before proposing yet another Secondary Offering on the prior session. Fundamentals remain strong (C and A criteria). Based on technical weakness it was dropped from the Featured Stocks list on 5/15/13.
>>> The latest Featured Stock Update with an annotated graph appeared on 4/27/2012. Click here.
View all notes |
Alert me of new notes |
CANSLIM.net Company Profile |
SEC |
Zacks Reports |
StockTalk |
News |
Chart |
Request a new note
C
A N
S L
I M
|
Symbol/Exchange
Company Name
Industry Group |
PRICE |
CHANGE
(%Change) |
Day High |
Volume
(% DAV)
(% 50 day avg vol) |
52 Wk Hi
% From Hi |
Featured
Date |
Price
Featured |
Pivot Featured |
|
Max Buy |
KORS
-
NYSE
Michael Kors Hldgs Ltd
RETAIL - Apparel Stores
|
$60.52
|
+1.25
2.11% |
$60.92
|
5,072,700
92.63% of 50 DAV
50 DAV is 5,476,200
|
$65.10
-7.04%
|
1/23/2013
|
$54.98
|
PP = $58.72
|
|
MB = $61.66
|
Most Recent Note - 3/5/2013 1:43:15 PM
G - Volume totals have cooled since halting its slide above prior highs in the $58 area. Completed another Secondary Offering 2/20/13 while perched near its all-time high.
>>> The latest Featured Stock Update with an annotated graph appeared on 2/7/2013. Click here.
View all notes |
Alert me of new notes |
CANSLIM.net Company Profile |
SEC |
Zacks Reports |
StockTalk |
News |
Chart |
Request a new note
C
A N
S L
I M
|
LNKD
-
NYSE
Linkedin Corp Class A
INTERNET - Internet Information Providers
|
$175.99
|
-1.91
-1.07% |
$179.35
|
2,865,540
123.22% of 50 DAV
50 DAV is 2,325,600
|
$178.23
-1.26%
|
2/8/2013
|
$147.04
|
PP = $127.55
|
|
MB = $133.93
|
Most Recent Note - 3/4/2013 3:51:00 PM
G - Considerable volume-driven gain today for yet another new all-time high, getting very extended from any sound base. Previously noted - "Disciplined investors may watch for secondary buy points or additional bases to possibly form and be noted in the weeks ahead."
>>> The latest Featured Stock Update with an annotated graph appeared on 2/8/2013. Click here.
View all notes |
Alert me of new notes |
CANSLIM.net Company Profile |
SEC |
Zacks Reports |
StockTalk |
News |
Chart |
Request a new note
C
A N
S L
I M
|
LOPE
-
NASDAQ
Grand Canyon Education
DIVERSIFIED SERVICES - Education and; Training Services
|
$23.70
|
+0.66
2.86% |
$23.80
|
459,929
99.40% of 50 DAV
50 DAV is 462,700
|
$27.18
-12.80%
|
2/20/2013
|
$26.44
|
PP = $25.10
|
|
MB = $26.36
|
Most Recent Note - 3/5/2013 6:39:20 PM
G - Rebounded near its 50 DMA line with today's gain on lighter (near average) volume. That short-term average may now act as resistance. It quickly negated its recent technical breakout.
>>> The latest Featured Stock Update with an annotated graph appeared on 2/20/2013. Click here.
View all notes |
Alert me of new notes |
CANSLIM.net Company Profile |
SEC |
Zacks Reports |
StockTalk |
News |
Chart |
Request a new note
C
A N
S L
I M
|
MIDD
-
NASDAQ
Middleby Corp
MANUFACTURING - Diversified Machinery
|
$149.78
|
-0.32
-0.21% |
$152.36
|
109,002
115.59% of 50 DAV
50 DAV is 94,300
|
$154.74
-3.21%
|
10/8/2012
|
$118.46
|
PP = $122.67
|
|
MB = $128.80
|
Most Recent Note - 3/5/2013 1:44:24 PM
G - Hovering near all-time highs today. Fundamental concerns were recently noted and prior reports cautioned members that it is extended from any sound base. Its 50 DMA line defines important near-term chart support above prior highs in the $134-135 area.
>>> The latest Featured Stock Update with an annotated graph appeared on 2/25/2013. Click here.
View all notes |
Alert me of new notes |
CANSLIM.net Company Profile |
SEC |
Zacks Reports |
StockTalk |
News |
Chart |
Request a new note
C
A N
S L
I M
|
MWIV
-
NASDAQ
M W I Veterinary Supply
HEALTH SERVICES - Medical Instruments and; Supplies
|
$135.43
|
+4.11
3.13% |
$136.64
|
142,323
282.95% of 50 DAV
50 DAV is 50,300
|
$132.01
2.59%
|
3/4/2013
|
$130.90
|
PP = $129.45
|
|
MB = $135.92
|
Most Recent Note - 3/5/2013 1:06:51 PM
Y - Gains in the major averages today may help the market (M criteria) to produce a new confirmed rally with a follow-through day. Highlighted in yellow with pivot point based on its 2/05/13 high plus 10 cents in the prior mid-day report (read here) and it is hitting another new 52-week high with today's 6th consecutive gain. Last week it cleared an advanced "3-weeks tight" base pattern formed since it technically broke out of a sound base on 2/04/13. Reported earnings +26% on +24% sales revenues for the quarter ended December 31, 2012 versus the year ago period, continuing its trend of recent quarterly earnings increases near the +25% minimum guideline (C criteria). It has shown resilience in recent months after rebounding impressively from its lows since dropped from the Featured Stocks list on 8/05/11.
>>> The latest Featured Stock Update with an annotated graph appeared on 6/30/2011. Click here.
View all notes |
Alert me of new notes |
CANSLIM.net Company Profile |
SEC |
Zacks Reports |
StockTalk |
News |
Chart |
Request a new note
C
A N
S L
I M
|
Symbol/Exchange
Company Name
Industry Group |
PRICE |
CHANGE
(%Change) |
Day High |
Volume
(% DAV)
(% 50 day avg vol) |
52 Wk Hi
% From Hi |
Featured
Date |
Price
Featured |
Pivot Featured |
|
Max Buy |
N
-
NYSE
Netsuite Inc
DIVERSIFIED SERVICES - Business/Management Services
|
$74.00
|
+0.38
0.52% |
$74.04
|
561,072
166.49% of 50 DAV
50 DAV is 337,000
|
$75.75
-2.31%
|
12/12/2012
|
$64.75
|
PP = $67.12
|
|
MB = $70.48
|
Most Recent Note - 3/4/2013 12:36:15 PM
G - Challenging its 52-week and all-time high with today's 5th consecutive volume-driven gain. See the latest FSU analysis for more details and a new annotated graph.
>>> The latest Featured Stock Update with an annotated graph appeared on 3/1/2013. Click here.
View all notes |
Alert me of new notes |
CANSLIM.net Company Profile |
SEC |
Zacks Reports |
StockTalk |
News |
Chart |
Request a new note
C
A N
S L
I M
|
NSR
-
NYSE
Neustar Inc
TELECOMMUNICATIONS - Diversified Communication Serv
|
$44.26
|
+0.41
0.94% |
$44.40
|
400,640
87.72% of 50 DAV
50 DAV is 456,700
|
$47.24
-6.31%
|
12/11/2012
|
$41.85
|
PP = $41.41
|
|
MB = $43.48
|
Most Recent Note - 3/1/2013 4:02:14 PM
G - Holding is ground just below its 50 DMA line today but enduring more distributional pressure. The damaging loss on 2/21/13 with heavy volume raised concerns and triggered a technical sell signal.
>>> The latest Featured Stock Update with an annotated graph appeared on 2/27/2013. Click here.
View all notes |
Alert me of new notes |
CANSLIM.net Company Profile |
SEC |
Zacks Reports |
StockTalk |
News |
Chart |
Request a new note
C
A N
S L
I M
|
QIHU
-
NYSE
Qihoo 360 Technology Ads
INTERNET - Internet Service Providers
|
$34.82
|
+2.07
6.32% |
$34.90
|
5,449,783
230.66% of 50 DAV
50 DAV is 2,362,700
|
$34.37
1.31%
|
3/5/2013
|
$34.63
|
PP = $34.47
|
|
MB = $36.19
|
Most Recent Note - 3/5/2013 6:36:03 PM
Y - Finished strong after highlighted in yellow with pivot point based on its 1/24/13 high plus 10 cents in the earlier mid-day report. Reported earnings +10% on +65% sales revenues for the Dec '12 quarter, below the +25% minimum earnings guideline (C criteria) raising fundamantal concerns. Volume and volatility often increase near earnings news. Above average volume behind today's 5th consecutive helped it hit a new 52-week high. Prior mid-day reports cautioned - "Deceleration in its sales revenues and earnings growth rate in sequential quarterly comparisons through Sep '12 is cause for concern. Faces additional overhead supply up through the $36 area. Found support at its 200 DMA line in recent weeks This Chinese Computer Software - Security firm's quarterly earnings (C criteria) and sales revenues increases have been strong." See the latest FSU analysis for more details and a new annotated graph.
>>> The latest Featured Stock Update with an annotated graph appeared on 3/5/2013. Click here.
View all notes |
Alert me of new notes |
CANSLIM.net Company Profile |
SEC |
Zacks Reports |
StockTalk |
News |
Chart |
Request a new note
C
A N
S L
I M
|
SFUN
-
NYSE
Soufun Hldgs Ltd Ads A
INTERNET - Internet Information Providers
|
$24.80
|
+1.29
5.49% |
$25.00
|
893,823
262.58% of 50 DAV
50 DAV is 340,400
|
$29.16
-14.95%
|
2/11/2013
|
$27.46
|
PP = $29.26
|
|
MB = $30.72
|
Most Recent Note - 3/5/2013 1:39:04 PM
G - Rebounding with a solid gain today, however it remains below its 50 DMA line which may now act as resistance. It did not trigger any recent technical buy signal.
>>> The latest Featured Stock Update with an annotated graph appeared on 2/11/2013. Click here.
View all notes |
Alert me of new notes |
CANSLIM.net Company Profile |
SEC |
Zacks Reports |
StockTalk |
News |
Chart |
Request a new note
C
A N
S L
I M
|
SLCA
-
NYSE
U S Silica Holdings Inc
CHEMICALS - Specialty Chemicals
|
$24.47
|
+0.06
0.25% |
$26.00
|
658,408
133.28% of 50 DAV
50 DAV is 494,000
|
$26.41
-7.35%
|
2/26/2013
|
$22.23
|
PP = $21.50
|
|
MB = $22.58
|
Most Recent Note - 3/1/2013 12:42:18 PM
G - Gapped down today, pulling back after a spurt of considerable volume-driven gains this week for new 52-week highs. Disciplined investors do not chase stocks extended from their prior base more than +5% above their pivot point or prior chart highs. See the latest FSU analysis for more details and an new annotated weekly graph.
>>> The latest Featured Stock Update with an annotated graph appeared on 2/26/2013. Click here.
View all notes |
Alert me of new notes |
CANSLIM.net Company Profile |
SEC |
Zacks Reports |
StockTalk |
News |
Chart |
Request a new note
C
A N
S L
I M
|
Symbol/Exchange
Company Name
Industry Group |
PRICE |
CHANGE
(%Change) |
Day High |
Volume
(% DAV)
(% 50 day avg vol) |
52 Wk Hi
% From Hi |
Featured
Date |
Price
Featured |
Pivot Featured |
|
Max Buy |
VRX
-
NYSE
Valeant Pharmaceuticals
DRUGS - Drug Manufacturers - Other
|
$69.79
|
+0.38
0.55% |
$70.10
|
1,287,775
94.70% of 50 DAV
50 DAV is 1,359,900
|
$69.41
0.55%
|
12/20/2012
|
$60.24
|
PP = $61.21
|
|
MB = $64.27
|
Most Recent Note - 3/5/2013 1:50:31 PM
Y - Hitting another new 52-week high with today's 5th consecutive gain. A valid secondary buy point exists following the successful test of support at its 10-week moving average up to as high as +5% above the recent high ($67.98 plus 5% or $71.38). Color code is changed to yellow however no new pivot point is cited since a new base was not formed. The 50 DMA line and recent low ($64.05 on 2/21/13) define the next important support area to watch.
>>> The latest Featured Stock Update with an annotated graph appeared on 2/15/2013. Click here.
View all notes |
Alert me of new notes |
CANSLIM.net Company Profile |
SEC |
Zacks Reports |
StockTalk |
News |
Chart |
Request a new note
C
A N
S L
I M
|
|
|
|
THESE ARE NOT BUY RECOMMENDATIONS!
Comments contained in the body of this report are technical
opinions only. The material herein has been obtained
from sources believed to be reliable and accurate, however,
its accuracy and completeness cannot be guaranteed.
This site is not an investment advisor, hence it does
not endorse or recommend any securities or other investments.
Any recommendation contained in this report may not
be suitable for all investors and it is not to be deemed
an offer or solicitation on our part with respect to
the purchase or sale of any securities. All trademarks,
service marks and trade names appearing in this report
are the property of their respective owners, and are
likewise used for identification purposes only.
This report is a service available
only to active Paid Premium Members.
You may opt-out of receiving report notifications
at any time. Questions or comments may be submitted
by writing to Premium Membership Services 665 S.E. 10 Street, Suite 201 Deerfield Beach, FL 33441-5634 or by calling 1-800-965-8307
or 954-785-1121.
|
|
|

