You are not logged in.
This means you
CAN ONLY VIEW reports that were published prior to Monday, April 14, 2025.
You
MUST UPGRADE YOUR MEMBERSHIP if you want to see any current reports.
AFTER MARKET UPDATE - FRIDAY, MARCH 5TH, 2010
Previous After Market Report Next After Market Report >>>
|
|
|
|
DOW |
+122.06 |
10,566.20 |
+1.17% |
|
Volume |
1,048,593,060 |
+10% |
|
Volume |
2,350,978,630 |
+9% |
|
NASDAQ |
+34.04 |
2,326.35 |
+1.48% |
|
Advancers |
2,580 |
82% |
|
Advancers |
2,170 |
77% |
|
S&P 500 |
+15.73 |
1,138.70 |
+1.40% |
|
Decliners |
477 |
15% |
|
Decliners |
561 |
20% |
|
Russell 2000 |
+13.55 |
666.02 |
+2.08% |
|
52 Wk Highs |
457 |
|
|
52 Wk Highs |
245 |
|
|
S&P 600 |
+6.56 |
352.88 |
+1.89% |
|
52 Wk Lows |
1 |
|
|
52 Wk Lows |
9 |
|
|
 |
March Rally Bodes Well For Near Term Market Outlook
Adam Sarhan, Contributing Writer,
Stocks rose after the Labor Department reported a stronger than expected jobs report. Volume, a critical gauge of institutional demand, was reported higher than the prior session on the Nasdaq exchange and on the NYSE, offering a reassuring sign that institutional investors had a heartier appetite for buying stocks again. Advancers trumped decliners by over a 5-to-1 ratio on the NYSE and by nearly a 4-to-1 ratio on the Nasdaq exchange. There were 59 high-ranked companies from the CANSLIM.net Leaders List that made a new 52-week high and appeared on the CANSLIM.net BreakOuts Page, up from the 31 issues that appeared on the prior session. New 52-week highs again overwhelmingly trumped new lows on both exchanges while new lows were in the single digits.
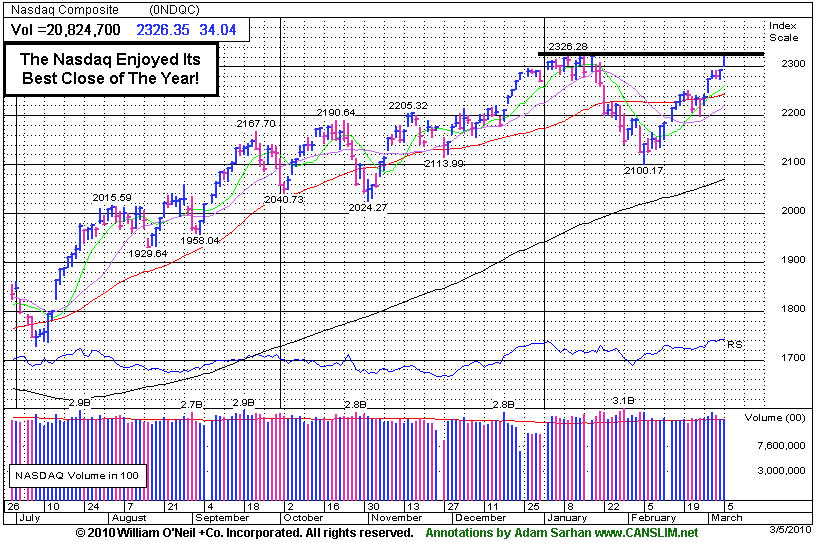
On Monday, the Nasdaq composite confirmed the latest rally attempt when it jumped +1.6% and produced a cautious follow-through day. On Tuesday, stocks edged higher after India said its economy rose last quarter, topping the Street's estimates. On Wednesday, stocks closed little changed after the latest economic data showed improvement in the US job market and service industries. The ADP said employers only cut -20,000 jobs last month which was above the Street's estimate. Elsewhere, the Institute for Supply Management (ISM) said its service index enjoyed the fastest growth rate since October 2007 which bodes well for the economic recovery. So far, over +470 companies in the benchmark index have reported quarterly earnings and approximately +75% have topped analysts' estimates. Barring some unforeseen event, the S&P 500 Index is on track to snap a record 9-quarter earnings slump.
Two important economic reports were released on Thursday: factory orders and pending home sales. Factory orders matched estimates and rose a very solid +1.7% in January. Orders for non-durable goods grew by +0.9% and durable goods orders, already released, were revised lower but still grew by +2.6%. Meanwhile, the National Association of Realtors said pending home sales, plunged by -7.6% to 90.4. The NAR blamed poor weather as the primary culprit for the poor reading. Stocks soared on Friday after the Labor Department said US employers cut 36,000 jobs last month which topped the Street's estimate. The closely watched unemployment rate held steady at 9.7% which was another healthy sign.
Looking at the market, since Monday's follow-through day (FTD), the market and a batch of leading stocks, steadily rallied which is a healthy sign. The fact that we have not seen any serious distribution days show up since Monday's FTD bodes well for this nascent rally. It is also a welcome sign to see the market continue to improve as investors digest the latest round of stronger than expected economic and earnings data. Remember that now that a new rally has been confirmed, the window is open to start buying high quality breakouts. Trade accordingly.
Professional Money Management Services - A Winning System - Inquire today!
Our skilled team of portfolio managers knows how to follow the rules of this fact-based investment system. We do not follow opinion or the "conviction list" of some large Wall Street institution which would have us fully invested even during horrific bear markets. Instead, we remain fluid and only buy the best stocks when they are triggering proper technical buy signals. If you are not completely satisfied with the way your portfolio is being managed, Click here to get connected with one of our portfolio managers. *Accounts over $250,000 please. ** Serious inquires only, please.
PICTURED: The Nasdaq Composite Index ended the week with its best close of the year, reaching a new recovery high!
|
|
|
 |
Financials Among Strong Groups Underpinning Rally
Kenneth J. Gruneisen - Passed the CAN SLIM® Master's Exam
The Biotechnology Index ($BTK +4.16%) was a standout tech sector gainer on Friday while the Networking Index ($NWX +2.07%), Internet Index ($IIX +1.32%), and Semiconductor Index ($SOX +1.44%) also posted gains. It was a widely positive session as the Bank Index ($BKX +2.49% ), Broker/Dealer Index ($XBD +1.99%), and Retail Index ($RLX +1.22%) had a positive influence on the major averages. Defensive groups also rose as the Healthcare Index ($HMO +2.05%), Gold & Silver Index ($XAU +1.65%), Oil Services Index ($OSX +1.46%), and Integrated Oil Index ($XOI +2.05%) finished collectively higher.
Charts courtesy www.stockcharts.com
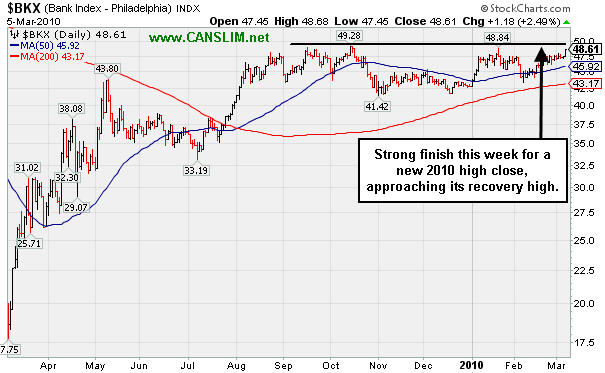
PICTURED 1: The Bank Index ($BKX +2.49%) was among the important influences underpinning the confirmed market rally this this week, rallying strong for a new 2010 high close while approaching its recovery high.
Charts courtesy www.stockcharts.com

PICTURED 2: The Broker/Dealer Index ($XBD +1.99%) rallied above its 50-day moving average (DMA) line, having recently made a stand at its longer term 200 DMA line.
| Oil Services |
$OSX |
210.97 |
+3.04 |
+1.46% |
+8.23% |
| Healthcare |
$HMO |
1,479.06 |
+29.73 |
+2.05% |
+0.42% |
| Integrated Oil |
$XOI |
1,064.54 |
+21.35 |
+2.05% |
-0.34% |
| Semiconductor |
$SOX |
351.53 |
+4.98 |
+1.44% |
-2.33% |
| Networking |
$NWX |
250.06 |
+5.08 |
+2.07% |
+8.22% |
| Internet |
$IIX |
238.98 |
+3.12 |
+1.32% |
+2.19% |
| Broker/Dealer |
$XBD |
117.59 |
+2.29 |
+1.99% |
+2.21% |
| Retail |
$RLX |
435.22 |
+5.23 |
+1.22% |
+5.86% |
| Gold & Silver |
$XAU |
170.81 |
+2.78 |
+1.65% |
+1.52% |
| Bank |
$BKX |
48.61 |
+1.18 |
+2.49% |
+13.81% |
| Biotech |
$BTK |
1,173.33 |
+46.81 |
+4.16% |
+24.54% |
|
|
|
 |
Perched Near Historic Highs Awaiting New Buy Signal
Kenneth J. Gruneisen - Passed the CAN SLIM® Master's Exam
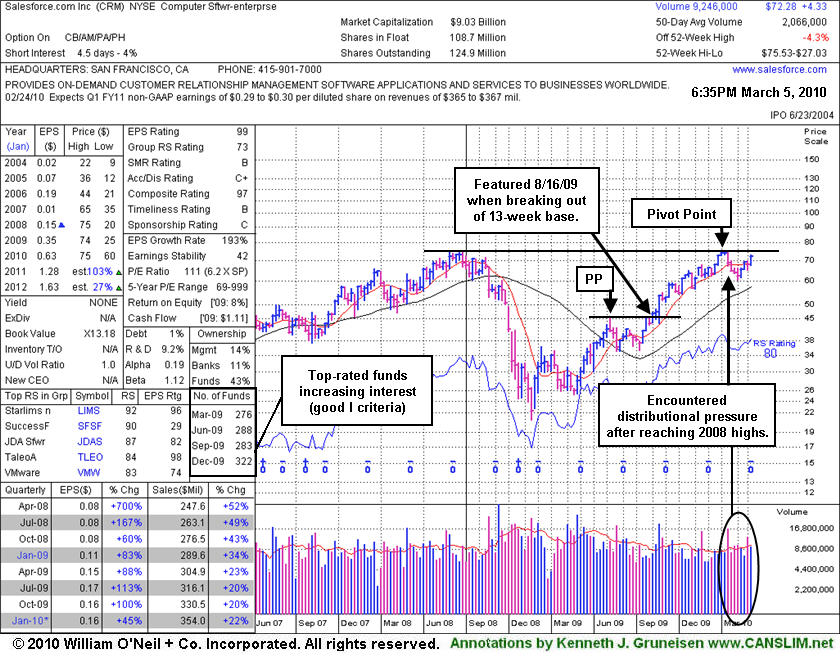
Salesforce.com, Inc. (CRM +$1.39 or +1.96% to $72.28) is continuing its recent rebound above its 50-day moving average (DMA) line and it is perched -4% from its all-time high. It encountered distributional pressure in recent weeks after reaching its 2008 highs. Its color code is changed to yellow with new pivot point cited based on its January 4, 2010 high. Its weekly chart below resembles a giant cup with handle pattern. Ideally it would form the right side of a shorter-term cup-with handle pattern in the weeks ahead before triggering a new buy signal. Patience and discipline are required, and only with a powerful breakout to new highs on heavy volume would new (or add-on) buying efforts be considered appropriate under the investment system guidelines. Meanwhile, the recent chart low ($64.77 on 2/25/10) is now an important support level to watch.
The high-ranked Computer Software - Enterprise firm has seen an increase in institutional (I criteria) ownership, with the number of top-rated funds owning its shares rising from 276 in March '09 to 322 in Dec '09. It has traded up as much as +60.3% since featured in a Stock Bulletin on 8/16/09 under the headline "Forces Have Been Favorable For Software Services Firm."
|
|
|
Color Codes Explained :
Y - Better candidates highlighted by our
staff of experts.
G - Previously featured
in past reports as yellow but may no longer be buyable under the
guidelines.
***Last / Change / Volume quote data in this table corresponds with the timestamp on the note***
Symbol/Exchange
Company Name
Industry Group |
Last |
Chg. |
Vol
% DAV |
Date Featured |
Price Featured |
Latest Pivot Point
Featured |
Status |
| Latest Max Buy Price |
ARST
-
|
$26.67
|
-2.22
|
2,865,845
N/A
|
2/24/2010
(Date
Featured) |
$25.94
(Price
Featured) |
PP = $27.95 |
|
| MB = $29.35 |
Most Recent Note - 3/5/2010
Gapped down today for a considerable loss with 7 times average volume, trading under its 50 DMA line and recent lows intra-day yet closing in the middle of its range above its short-term average. It will be dropped from the Featured Stocks list tonight based on the heavy distribution after the latest quarter ended January 31, 2010 showed earnings per share -29% below the year ago period, raising serious fundamental concerns.
>>> The latest Featured Stock Update with an annotated graph appeared on 2/17/2010. click here.
|
|
C
A
S
I |
News |
Chart |
SEC
View all notes Alert
me of new notes
Company
Profile
|
ARUN
- NASDAQ
Aruba Networks Inc
COMPUTER HARDWARE - Networking & Communication Dev
|
$12.37
|
-0.04
|
1,289,686
92% DAV
1,397,700
|
2/19/2010
(Date
Featured) |
$12.71
(Price
Featured) |
PP = $11.94 |
Y |
| MB = $12.54 |
Most Recent Note - 3/5/2010 6:02:43 PM
Y - Hovering in a tight range near its "max buy" level. It found support above prior chart highs following its 2/19/10 gap up gain on heavy volume. ARUN was featured in the mid-day report on 2/19/10 as it rose from a flat base-on-base pattern above its 50-day moving average line (read here).
>>> The latest Featured Stock Update with an annotated graph appeared on 2/22/2010. click here.
|
|
C
A
S
I |
News |
Chart |
SEC
View all notes Alert
me of new notes
Company
Profile
|
BIDU
- NASDAQ
Baidu Inc Ads
INTERNET - Internet Information Providers
|
$520.75
|
-3.03
|
1,216,678
63% DAV
1,928,600
|
1/13/2010
(Date
Featured) |
$431.25
(Price
Featured) |
PP = $426.75 |
G |
| MB = $448.09 |
Most Recent Note - 3/5/2010 6:06:56 PM
G - In recent weeks it has persistently traded light volume while wedging up to new all-time highs. Its prior chart high near $470 is the nearest support level while it is extended above its mid-January highs. It rose steadily since the 2/10/10 gap up gain with more than 3 times average volume.
>>> The latest Featured Stock Update with an annotated graph appeared on 3/4/2010. click here.
|
|
C
A
S
I |
News |
Chart |
SEC
View all notes Alert
me of new notes
Company
Profile
|
BRLI
- NASDAQ
Bio Reference Labs Inc
HEALTH SERVICES - Medical Laboratories & Researc
|
$43.89
|
+0.92
|
164,037
180% DAV
91,200
|
2/12/2010
(Date
Featured) |
$39.02
(Price
Featured) |
PP = $40.97 |
G |
| MB = $43.02 |
Most Recent Note - 3/5/2010 6:08:22 PM
G - Gain today with above average volume, closing above its max buy level. Color code was changed to green. Breakout gain on 3/04/10 with 2 times average volume confirmed a technical buy signal. With no overhead supply, its weekly chart is marked by many up weeks with above average volume and few down weeks on volume -very bullish characteristics. This high-ranked Medical-Dental - Services firm was featured in yellow in the 2/12/10 mid-day report (read here).
>>> The latest Featured Stock Update with an annotated graph appeared on 3/1/2010. click here.
|
|
C
A
S
I |
News |
Chart |
SEC
View all notes Alert
me of new notes
Company
Profile
|
CACC
- NASDAQ
Credit Acceptance Corp
FINANCIAL SERVICES - Credit Services
|
$43.47
|
+0.38
|
44,517
75% DAV
59,300
|
9/29/2009
(Date
Featured) |
$33.48
(Price
Featured) |
PP = $37.10 |
G |
| MB = $38.96 |
Most Recent Note - 3/5/2010 6:09:19 PM
G - Posted a small gain on light volume today, and its 50 DMA line acted as resistance this week. Recent lows are a nearby chart support level to watch just above its old chart highs in the $37 area.
>>> The latest Featured Stock Update with an annotated graph appeared on 3/2/2010. click here.
|
|
C
A
S
I |
News |
Chart |
SEC
View all notes Alert
me of new notes
Company
Profile
|
CISG
- NASDAQ
Cninsure Inc Ads
INSURANCE - Insurance Brokers
|
$25.83
|
+1.22
|
618,780
331% DAV
186,700
|
3/3/2010
(Date
Featured) |
$24.38
(Price
Featured) |
PP = $23.10 |
G |
| MB = $24.26 |
Most Recent Note - 3/5/2010 6:11:37 PM
G - Posted a 3rd consecutive gain with above average volume, hitting a new 52 week high well above its max buy level. Color code was changed to green. On 3/03/10 broke out with 8 times average volume following its latest earnings report for the quarter ended Dec 31, 2009. It rose from a 20-week double bottom base as it was featured in the 3/03/10 mid-day report (read here).
>>> The latest Featured Stock Update with an annotated graph appeared on 3/3/2010. click here.
|
|
C
A
S
I |
News |
Chart |
SEC
View all notes Alert
me of new notes
Company
Profile
|
CRM
- NYSE
Salesforce.com Inc
INTERNET - Internet Software & Services
|
$72.28
|
+1.39
|
1,749,798
85% DAV
2,066,000
|
3/5/2010
(Date
Featured) |
$72.28
(Price
Featured) |
PP = $75.53 |
Y |
| MB = $79.31 |
Most Recent Note - 3/5/2010 7:09:10 PM
Y - Continuing its recent rebound above its 50 DMA line, it is perched -4% from its all-time high. Color code is changed to yellow with new pivot point cited. Recent chart low ($64.77 on 2/25/10) is now an important support level to watch.
>>> The latest Featured Stock Update with an annotated graph appeared on 3/5/2010. click here.
|
|
C
A
S
I |
News |
Chart |
SEC
View all notes Alert
me of new notes
Company
Profile
|
CTRP
- NASDAQ
Ctrip.com Intl Ltd Adr
LEISURE - Resorts & Casinos
|
$38.63
|
+0.95
|
1,731,575
80% DAV
2,163,000
|
3/1/2010
(Date
Featured) |
$38.23
(Price
Featured) |
PP = $38.50 |
Y |
| MB = $40.43 |
Most Recent Note - 3/5/2010 6:15:27 PM
Y - Gapped up today for a gain on lighter volume and closed just above its pivot point. It promptly reversed after its 3/01/10 gain for a new all-time high. It was noted that the 3/01/10 gain above its pivot point did not meet the minimum volume threshold of +50% above average volume required for a proper technical buy signal. Featured in the new March 2010 issue of CANSLIM.net News (read here).
>>> The latest Featured Stock Update with an annotated graph appeared on 2/28/2010. click here.
|
|
C
A
S
I |
News |
Chart |
SEC
View all notes Alert
me of new notes
Company
Profile
|
EZPW
- NASDAQ
Ezcorp Inc Cl A
SPECIALTY RETAIL - Specialty Retail, Other
|
$20.82
|
+0.58
|
609,530
133% DAV
457,800
|
2/19/2010
(Date
Featured) |
$19.03
(Price
Featured) |
PP = $18.80 |
G |
| MB = $19.74 |
Most Recent Note - 3/5/2010 6:16:49 PM
G - Gain today with above average volume for a new all-time high, getting more extended from any sound base of support. Prior chart highs in the $18 area define an important support level to watch. Featured in yellow in the 2/19/10 mid-day report (read here).
>>> The latest Featured Stock Update with an annotated graph appeared on 2/19/2010. click here.
|
|
C
A
S
I |
News |
Chart |
SEC
View all notes Alert
me of new notes
Company
Profile
|
GMCR
- NASDAQ
Green Mtn Coffee Roastrs
FOOD & BEVERAGE - Processed & Packaged Goods
|
$87.74
|
+0.42
|
592,768
43% DAV
1,374,000
|
2/26/2010
(Date
Featured) |
$84.39
(Price
Featured) |
PP = $88.75 |
Y |
| MB = $93.19 |
Most Recent Note - 3/5/2010 6:18:13 PM
Y - Hovering quietly near its pivot point. A big gain on 3/02/10 had heavy volume, but it did not close above its pivot point cited. Keep in mind that GMCR has formed a "late-stage" base after showing up as a fresh buy candidate long ago in CANSLIM.net reports. Important initial support level to watch is its 50 DMA line and recent lows near the $80 area.
>>> The latest Featured Stock Update with an annotated graph appeared on 2/23/2010. click here.
|
|
C
A
S
I |
News |
Chart |
SEC
View all notes Alert
me of new notes
Company
Profile
|
ISRG
- NASDAQ
Intuitive Surgical Inc
HEALTH SERVICES - Medical Appliances & Equipment
|
$358.40
|
+3.91
|
341,021
66% DAV
519,800
|
1/22/2010
(Date
Featured) |
$340.40
(Price
Featured) |
PP = $314.00 |
G |
| MB = $329.70 |
Most Recent Note - 3/5/2010 6:22:31 PM
G - After wedging to near 52-week highs in recent week it is perched within close striking distance of its $359 all-time high. ISRG was featured at $340.40 in the 1/22/10 mid-day report following a powerful breakaway gap (read here).
>>> The latest Featured Stock Update with an annotated graph appeared on 2/24/2010. click here.
|
|
C
A
S
I |
News |
Chart |
SEC
View all notes Alert
me of new notes
Company
Profile
|
PCLN
- NASDAQ
Priceline.com Inc
INTERNET - Internet Software & Services
|
$399.55
|
-4.72
|
584,812
N/A
|
11/1/2002
(Date
Featured) |
$399.55
(Price
Featured) |
PP = $428.20 |
Y |
| MB = $449.61 |
Most Recent Note - 1/2/2011
Y - Returns to Featured Stocks list with its appearance in the January 2011 CANSLIM.net News including detailed analysis and annotated daily and weekly graphs.
>>> The latest Featured Stock Update with an annotated graph appeared on 2/18/2010. click here.
|
|
C
A
S
I |
News |
Chart |
SEC
View all notes Alert
me of new notes
Company
Profile
|
PEGA
- NASDAQ
Pegasystems Inc
COMPUTER SOFTWARE & SERVICES - Business Software & Services
|
$35.86
|
+0.84
|
130,132
64% DAV
202,300
|
2/26/2010
(Date
Featured) |
$36.00
(Price
Featured) |
PP = $38.55 |
Y |
| MB = $40.48 |
Most Recent Note - 3/5/2010 6:24:56 PM
Y - Gain today on light volume, finding support this week while testing its 50 DMA line. Positively reversed on 2/23/10 after a brief 50 DMA line violation, finding prompt support near prior chart lows in the $32 area.
>>> The latest Featured Stock Update with an annotated graph appeared on 2/26/2010. click here.
|
|
C
A
S
I |
News |
Chart |
SEC
View all notes Alert
me of new notes
Company
Profile
|
ROVI
- NASDAQ
Rovi Corp
COMPUTER SOFTWARE & SERVICES - Security Software & Services
|
$35.02
|
+0.01
|
734,817
71% DAV
1,031,300
|
2/25/2010
(Date
Featured) |
$33.54
(Price
Featured) |
PP = $34.87 |
Y |
| MB = $36.61 |
Most Recent Note - 3/5/2010 6:27:45 PM
Y - Ended the week with a new high close. Considerable 3/02/10 gain with volume more than 2 times average triggered a technical buy signal as it rallied above its pivot point. It announced news after the 3/01/10 close about an expansion of its relationship with Comcast (read here). Featured on 2/25/10 in yellow in the mid-day report (read here).
>>> The latest Featured Stock Update with an annotated graph appeared on 2/25/2010. click here.
|
|
C
A
S
I |
News |
Chart |
SEC
View all notes Alert
me of new notes
Company
Profile
|
SIRO
- NASDAQ
Sirona Dental Systems
HEALTH SERVICES - Medical Instruments & Supplies
|
$37.25
|
+0.50
|
429,798
78% DAV
551,900
|
2/16/2010
(Date
Featured) |
$36.43
(Price
Featured) |
PP = $36.15 |
Y |
| MB = $37.96 |
Most Recent Note - 3/5/2010 6:28:37 PM
Y - Posted a small gain on light volume today, still perched above its pivot point but below its max buy level. It was featured in yellow in the 2/16/10 mid-day report (read here) as it broke out from a 10-week flat base.
>>> The latest Featured Stock Update with an annotated graph appeared on 2/16/2010. click here.
|
|
C
A
S
I |
News |
Chart |
SEC
View all notes Alert
me of new notes
Company
Profile
|
VPRT
- NASDAQ
Vistaprint Nv
DIVERSIFIED SERVICES - Business/Management Services
|
$61.08
|
+1.38
|
376,911
77% DAV
488,200
|
3/1/2010
(Date
Featured) |
$57.72
(Price
Featured) |
PP = $59.70 |
Y |
| MB = $62.69 |
Most Recent Note - 3/5/2010 6:31:38 PM
Y - Gain today on below average volume for a new all-time high above its pivot point. Its gain on 3/02/10 was below the volume guidelines for buyable breakouts under the investment system. Featured in the March 2010 CANSLIM.net News monthly newsletter (read here).
>>> The latest Featured Stock Update with an annotated graph appeared on 2/28/2010. click here.
|
|
C
A
S
I |
News |
Chart |
SEC
View all notes Alert
me of new notes
Company
Profile
|
|
|
|
THESE ARE NOT BUY RECOMMENDATIONS!
Comments contained in the body of this report are technical
opinions only. The material herein has been obtained
from sources believed to be reliable and accurate, however,
its accuracy and completeness cannot be guaranteed.
This site is not an investment advisor, hence it does
not endorse or recommend any securities or other investments.
Any recommendation contained in this report may not
be suitable for all investors and it is not to be deemed
an offer or solicitation on our part with respect to
the purchase or sale of any securities. All trademarks,
service marks and trade names appearing in this report
are the property of their respective owners, and are
likewise used for identification purposes only.
This report is a service available
only to active Paid Premium Members.
You may opt-out of receiving report notifications
at any time. Questions or comments may be submitted
by writing to Premium Membership Services 665 S.E. 10 Street, Suite 201 Deerfield Beach, FL 33441-5634 or by calling 1-800-965-8307
or 954-785-1121.
|
|
|


