You are not logged in.
This means you
CAN ONLY VIEW reports that were published prior to Monday, April 14, 2025.
You
MUST UPGRADE YOUR MEMBERSHIP if you want to see any current reports.
AFTER MARKET UPDATE - MONDAY, MARCH 4TH, 2013
Previous After Market Report Next After Market Report >>>
|
|
|
|
DOW |
+38.16 |
14,127.82 |
+0.27% |
|
Volume |
693,224,860 |
-7% |
|
Volume |
1,685,938,330 |
-7% |
|
NASDAQ |
+12.29 |
3,182.03 |
+0.39% |
|
Advancers |
1,665 |
53% |
|
Advancers |
1,330 |
52% |
|
S&P 500 |
+7.00 |
1,525.20 |
+0.46% |
|
Decliners |
1,311 |
42% |
|
Decliners |
1,135 |
44% |
|
Russell 2000 |
+1.95 |
916.68 |
+0.21% |
|
52 Wk Highs |
238 |
|
|
52 Wk Highs |
156 |
|
|
S&P 600 |
-0.66 |
511.74 |
-0.13% |
|
52 Wk Lows |
40 |
|
|
52 Wk Lows |
39 |
|
|
 |
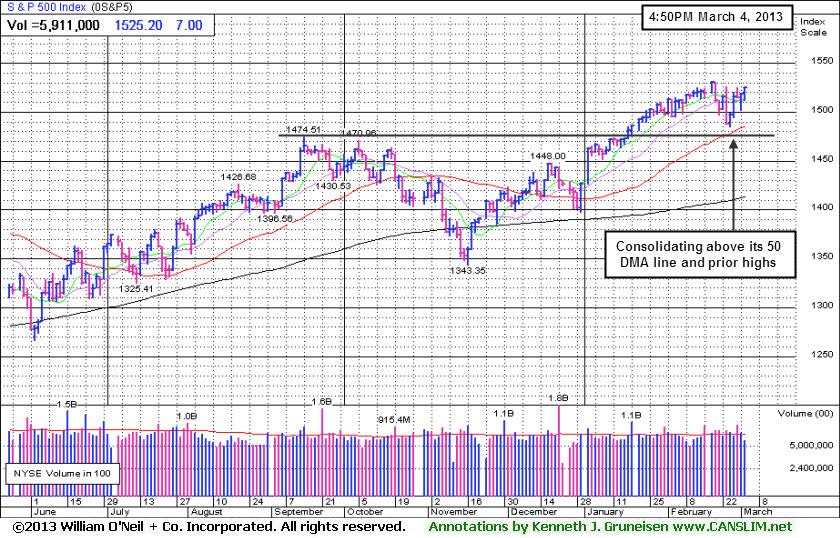
Major Averages Rose With Lighter Volume Totals
Kenneth J. Gruneisen - Passed the CAN SLIM® Master's Exam
Monday's small gains for the major averages were backed up by volume totals that were reported lighter than the prior session on the NYSE and on the Nasdaq exchange. Breadth was slightly positive as advancers led decliners by an 8-7 margin on the NYSE and 7-6 on the Nasdaq exchange. The total number of stocks hitting new 52-week highs still outnumbered new 52-week lows on the NYSE and on the Nasdaq exchange. There were 80 high-ranked companies from the CANSLIM.net Leaders List making new 52-week highs and appearing on the CANSLIM.net BreakOuts Page, up nicely from the prior session's total of 47 stocks. There were gains for 9 of the 14 high-ranked companies currently included on the Featured Stocks Page.
The market was able to rally despite concerns as China's services industries expanded last month at the slowest pace since September 2012. The nation's government also ordered fresh measures to curb property prices. On our shores, the ISM's reading on New York business activity increased in February to its best level since April of last year. Washington also remained in focus. House Speaker Boehner said no headway was made over the weekend with President Obama on a deal to avoid automatic budget cuts that went into effect last Friday. Europe also garnered attention as EU leaders are meeting in Brussels to discuss the planned bailout for Cyprus.
Earnings results were limited. Transocean Ltd (RIG +0.8%) edged higher after topping profit expectations and reinstating its dividend payment. Industrial and material stocks weighed on the market as Cliffs Natural Resources Inc (CLF -5.82%) fell.
Any sustainable rally requires a healthy crop of companies hitting new 52-week highs, so it is always essential to see meaningful leadership (stocks hitting new 52-week highs). New buying efforts are to be avoided under the fact-based system since the market's (M criteria) weak action and damaging distribution was recognized as a correction earlier this week. Individual holdings should be watched closely while investors have a bias toward reducing market exposure until there is a new confirmed rally with a follow-through day noted.
Watch for an announcement via email concerning the next WEBCAST. The webcast will also be available via an updated link highlighted at the top of the Premium Member Homepage.
PICTURED: The S&P 500 Index is consolidating above its 50-day moving average (DMA) line and prior highs.
|
 Kenneth J. Gruneisen started out as a licensed stockbroker in August 1987, a couple of months prior to the historic stock market crash that took the Dow Jones Industrial Average down -22.6% in a single day. He has published daily fact-based fundamental and technical analysis on high-ranked stocks online for two decades. Through FACTBASEDINVESTING.COM, Kenneth provides educational articles, news, market commentary, and other information regarding proven investment systems that work in good times and bad.
Comments contained in the body of this report are technical opinions only and are not necessarily those of Gruneisen Growth Corp. The material herein has been obtained from sources believed to be reliable and accurate, however, its accuracy and completeness cannot be guaranteed. Our firm, employees, and customers may effect transactions, including transactions contrary to any recommendation herein, or have positions in the securities mentioned herein or options with respect thereto. Any recommendation contained in this report may not be suitable for all investors and it is not to be deemed an offer or solicitation on our part with respect to the purchase or sale of any securities. |
|
 |
Gold & Silver Index Slumping to Multi-Year Lows
Kenneth J. Gruneisen - Passed the CAN SLIM® Master's Exam
The Retail Index ($RLX +1.49%) posted a solid gain on Monday while strength from financial shares underpinned the major averages as the Bank Index ($BKX +1.18%) and the Broker/Dealer Index ($XBD +0.61%) posted gains. The tech sector was mixed as the Networking Index ($NWX -0.50%) and Semiconductor Index ($SOX -0.25%) edged lower and the Internet Index ($IIX +0.46%) and the Biotechnology Index ($BTK +1.05%) tallied gains. Energy-related shares were also mixed as the Integrated Oil Index ($XOI +0.50%) edged higher while the Oil Services Index ($OSX -1.23%) lost ground. The Healthcare Index ($HMO -0.93%) also edged lower, not rewarding defensively positioned investors.
Charts courtesy www.stockcharts.com
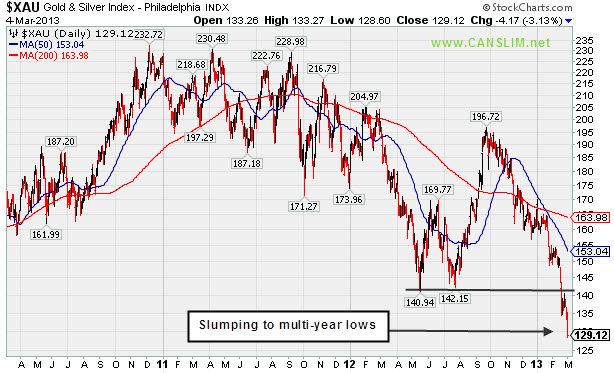
PICTURED: The Gold & Silver Index ($XAU -3.13%) was a standout decliner on Monday, slumping to new multi-year lows.
| Oil Services |
$OSX |
238.60 |
-2.97 |
-1.23% |
+8.38% |
| Healthcare |
$HMO |
2,651.38 |
-25.02 |
-0.93% |
+5.46% |
| Integrated Oil |
$XOI |
1,332.98 |
+6.63 |
+0.50% |
+7.34% |
| Semiconductor |
$SOX |
424.01 |
-1.08 |
-0.25% |
+10.40% |
| Networking |
$NWX |
232.55 |
-1.17 |
-0.50% |
+2.65% |
| Internet |
$IIX |
359.93 |
+1.66 |
+0.46% |
+10.07% |
| Broker/Dealer |
$XBD |
106.52 |
+0.65 |
+0.61% |
+12.92% |
| Retail |
$RLX |
720.37 |
+10.55 |
+1.49% |
+10.31% |
| Gold & Silver |
$XAU |
129.12 |
-4.17 |
-3.13% |
-22.03% |
| Bank |
$BKX |
54.79 |
+0.64 |
+1.18% |
+6.84% |
| Biotech |
$BTK |
1,746.84 |
+18.20 |
+1.05% |
+12.92% |
|
|
|
 |
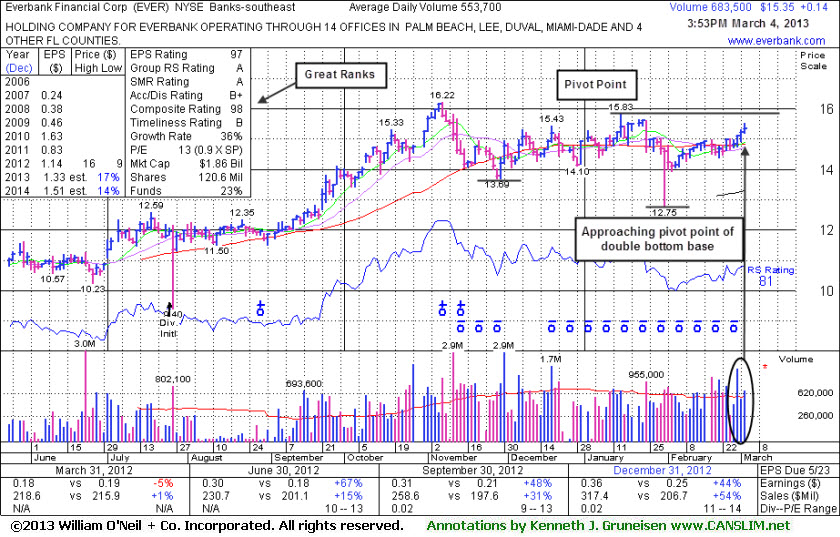
Financial Firm Has Formed Ideal Base But Needs Confirming Gains
Kenneth J. Gruneisen - Passed the CAN SLIM® Master's Exam
Often, when a leading stock is setting up to breakout of a solid base it is highlighted in CANSLIM.net's Mid-Day Breakouts Report. The most relevant factors are noted in the report which alerts prudent CANSLIM oriented investors to place the issue in their watch list. After doing any necessary backup research, the investor is prepared to act after the stock triggers a technical buy signal (breaks above its pivot point on more than +50% average turnover) but before it gets too extended from a sound base. In the event the stock fails to trigger a technical buy signal and its price declines then it will simply be removed from the watch list. Disciplined investors know to buy as near as possible to the pivot point and avoid chasing stocks after they have rallied more than +5% above their pivot point. It is crucial to always limit losses whenever any stock heads the wrong direction, and disciplined investors sell if a struggling stock ever falls more than -7% from their purchase price.
Everbank Financial Corp (EVER +$0.16 or +1.05% to $15.37) was highlighted in yellow with pivot point cited based on its 1/15/13 high while building on a "double bottom" base pattern in the earlier mid-day report (read here). It needs subsequent volume-driven gains above its pivot point to trigger a technical buy signal, meanwhile the market (M criteria) also needs to confirm a new rally to signal that odds are favorable for investors.
It reported earnings +44% on +54% sales revenues for the Dec '12 quarter satisfying the C criteria with its 3rd quarter with earnings above the +25% minimum guideline (C criteria)." The number of top-rated funds owning its shatres rose from 101 in Jun '12 to 147 in Dec '12 a reassuring sign concerning the I criteria. The Banks - Southeast industry group has a high 88 Relative Strength Rating while other strong leadership in the group also helps in satisfying the L criteria.
|
|
|
Color Codes Explained :
Y - Better candidates highlighted by our
staff of experts.
G - Previously featured
in past reports as yellow but may no longer be buyable under the
guidelines.
***Last / Change / Volume data in this table is the closing quote data***
Symbol/Exchange
Company Name
Industry Group |
PRICE |
CHANGE
(%Change) |
Day High |
Volume
(% DAV)
(% 50 day avg vol) |
52 Wk Hi
% From Hi |
Featured
Date |
Price
Featured |
Pivot Featured |
|
Max Buy |
CELG
-
NASDAQ
Celgene Corp
DRUGS - Drug Manufacturers - Major
|
$105.56
|
-0.06
-0.06% |
$105.66
|
4,861,339
127.59% of 50 DAV
50 DAV is 3,810,200
|
$105.82
-0.25%
|
12/11/2012
|
$82.24
|
PP = $81.34
|
|
MB = $85.41
|
Most Recent Note - 2/28/2013 2:14:59 PM
G - Held its ground in a tight range in recent weeks but did not form a sound base pattern before spiking to a new all-time high with today's volume-driven gain. Recent lows in the $96 area define near-term support above its 50 DMA line.
>>> The latest Featured Stock Update with an annotated graph appeared on 2/28/2013. Click here.
View all notes |
Alert me of new notes |
CANSLIM.net Company Profile |
SEC |
Zacks Reports |
StockTalk |
News |
Chart |
Request a new note
C
A N
S L
I M


|
CFNL
-
NASDAQ
Cardinal Financial Corp
BANKING - Regional - Southeast Banks
|
$16.54
|
+0.09
0.55% |
$16.59
|
242,581
125.89% of 50 DAV
50 DAV is 192,700
|
$16.90
-2.13%
|
12/3/2012
|
$15.20
|
PP = $16.31
|
|
MB = $17.13
|
Most Recent Note - 3/1/2013 3:59:51 PM
Y - Rebounding above its 50 DMA line and its color code is changed to yellow with today's gain helping its outlook improve.
>>> The latest Featured Stock Update with an annotated graph appeared on 2/21/2013. Click here.
View all notes |
Alert me of new notes |
CANSLIM.net Company Profile |
SEC |
Zacks Reports |
StockTalk |
News |
Chart |
Request a new note
C
A N
S L
I M
|
CMCSA
-
NASDAQ
Comcast Corp Cl A
MEDIA - CATV Systems
|
$40.38
|
+0.35
0.87% |
$40.48
|
9,771,221
69.44% of 50 DAV
50 DAV is 14,072,400
|
$42.00
-3.86%
|
12/3/2012
|
$37.08
|
PP = $38.06
|
|
MB = $39.96
|
Most Recent Note - 2/26/2013 1:55:07 PM
G - Endured mild distributional pressure while recently consolidating near its 52-week high. Reported earnings +11% on +6% sales revenues for the Dec '12 quarter, below the +25% minimum earnings guideline (C criteria), raising fundamental concerns
>>> The latest Featured Stock Update with an annotated graph appeared on 2/19/2013. Click here.
View all notes |
Alert me of new notes |
CANSLIM.net Company Profile |
SEC |
Zacks Reports |
StockTalk |
News |
Chart |
Request a new note
C
A N
S L
I M
|
EVER
-
NYSE
Everbank Financial Corp
BANKING
|
$15.37
|
+0.16
1.05% |
$15.53
|
784,369
141.66% of 50 DAV
50 DAV is 553,700
|
$16.22
-5.24%
|
3/4/2013
|
$15.38
|
PP = $15.83
|
|
MB = $16.62
|
 Most Recent Note - 3/4/2013 5:02:14 PM
Y - Highlighted in yellow with pivot point cited based on its 1/15/13 high while building on a "double bottom" base pattern in the earlier mid-day report. Needs subsequent volume-driven gains to trigger a technical buy signal, while the market (M criteria) also needs to confirm a new rally to signal odds are favorable. Reported earnings +44% on +54% sales revenues for the Dec '12 quarter satisfying the C criteria. Rebounding toward its 52-week high after slumping below its 50 DMA line during its choppy consolidation since last noted in the 12/07/12 mid-day report with caution - "Limited history remains a concern, meanwhile it rallied since its 5/03/12 IPO at $10. Reported earnings +48% on +31% sales revenues for the Sep '12 quarter, marking only its 2nd quarter with earnings above the +25% minimum guideline (C criteria)." See the latest FSU analysis for more details and a new annotated graph.
>>> The latest Featured Stock Update with an annotated graph appeared on 3/4/2013. Click here.
View all notes |
Alert me of new notes |
CANSLIM.net Company Profile |
SEC |
Zacks Reports |
StockTalk |
News |
Chart |
Request a new note
C
A N
S L
I M
|
KORS
-
NYSE
Michael Kors Hldgs Ltd
RETAIL - Apparel Stores
|
$59.27
|
+0.04
0.07% |
$59.61
|
3,211,499
58.38% of 50 DAV
50 DAV is 5,501,200
|
$65.10
-8.96%
|
1/23/2013
|
$54.98
|
PP = $58.72
|
|
MB = $61.66
|
Most Recent Note - 2/26/2013 2:04:43 PM
G - Rebounded from early losses today, halting its slide near prior highs in the $58 area. Tallied 3 losses on heavy volume in the span of the prior 4 sessions since completing another Secondary Offering 2/20/13 while perched near its all-time high.
>>> The latest Featured Stock Update with an annotated graph appeared on 2/7/2013. Click here.
View all notes |
Alert me of new notes |
CANSLIM.net Company Profile |
SEC |
Zacks Reports |
StockTalk |
News |
Chart |
Request a new note
C
A N
S L
I M
|
Symbol/Exchange
Company Name
Industry Group |
PRICE |
CHANGE
(%Change) |
Day High |
Volume
(% DAV)
(% 50 day avg vol) |
52 Wk Hi
% From Hi |
Featured
Date |
Price
Featured |
Pivot Featured |
|
Max Buy |
LNKD
-
NYSE
Linkedin Corp Class A
INTERNET - Internet Information Providers
|
$177.90
|
+7.44
4.36% |
$178.23
|
3,116,915
135.55% of 50 DAV
50 DAV is 2,299,400
|
$171.82
3.54%
|
2/8/2013
|
$147.04
|
PP = $127.55
|
|
MB = $133.93
|
Most Recent Note - 3/4/2013 3:51:00 PM
G - Considerable volume-driven gain today for yet another new all-time high, getting very extended from any sound base. Previously noted - "Disciplined investors may watch for secondary buy points or additional bases to possibly form and be noted in the weeks ahead."
>>> The latest Featured Stock Update with an annotated graph appeared on 2/8/2013. Click here.
View all notes |
Alert me of new notes |
CANSLIM.net Company Profile |
SEC |
Zacks Reports |
StockTalk |
News |
Chart |
Request a new note
C
A N
S L
I M
|
LOPE
-
NASDAQ
Grand Canyon Education
DIVERSIFIED SERVICES - Education and; Training Services
|
$23.04
|
-0.98
-4.08% |
$24.10
|
564,650
122.75% of 50 DAV
50 DAV is 460,000
|
$27.18
-15.23%
|
2/20/2013
|
$26.44
|
PP = $25.10
|
|
MB = $26.36
|
Most Recent Note - 3/4/2013 3:48:28 PM
G - Slumping further below its 50 DMA line with today's damaging loss. It quickly negated its recent technical breakout.
>>> The latest Featured Stock Update with an annotated graph appeared on 2/20/2013. Click here.
View all notes |
Alert me of new notes |
CANSLIM.net Company Profile |
SEC |
Zacks Reports |
StockTalk |
News |
Chart |
Request a new note
C
A N
S L
I M
|
MIDD
-
NASDAQ
Middleby Corp
MANUFACTURING - Diversified Machinery
|
$150.10
|
-0.09
-0.06% |
$150.20
|
73,455
74.88% of 50 DAV
50 DAV is 98,100
|
$154.74
-3.00%
|
10/8/2012
|
$118.46
|
PP = $122.67
|
|
MB = $128.80
|
Most Recent Note - 2/27/2013 12:51:03 PM
G - Rallied to a new all-time high today with a 2nd consecutive gain backed by above average volume. Fundamental concerns were recently noted and prior reports cautioned members that it is extended from any sound base. Its 50 DMA line defines important near-term chart support above prior highs in the $134-135 area.
>>> The latest Featured Stock Update with an annotated graph appeared on 2/25/2013. Click here.
View all notes |
Alert me of new notes |
CANSLIM.net Company Profile |
SEC |
Zacks Reports |
StockTalk |
News |
Chart |
Request a new note
C
A N
S L
I M
|
MWIV
-
NASDAQ
M W I Veterinary Supply
HEALTH SERVICES - Medical Instruments and; Supplies
|
$131.32
|
+0.43
0.33% |
$132.01
|
147,285
303.68% of 50 DAV
50 DAV is 48,500
|
$131.90
-0.44%
|
3/4/2013
|
$130.90
|
PP = $129.45
|
|
MB = $135.92
|
Most Recent Note - 3/4/2013 12:35:14 PM
Y - Patient investors may watch for the market (M criteria) to produce a new confirmed rally with a follow-through day from at least one of the major averages before the stock gets too extended. Color code is changed to yellow with pivot point based on its 2/05/13 high plus 10 cents. Spiked to another new 52-week high last week clearing an advanced "3-weeks tight" base pattern formed since it technically broke out of a sound base on 2/04/13. Reported earnings +26% on +24% sales revenues for the quarter ended December 31, 2012 versus the year ago period, continuing its trend of recent quarterly earnings increases near the +25% minimum guideline (C criteria). It has shown resilience in recent months after rebounding impressively from its lows since dropped from the Featured Stocks list on 8/05/11.
>>> The latest Featured Stock Update with an annotated graph appeared on 6/30/2011. Click here.
View all notes |
Alert me of new notes |
CANSLIM.net Company Profile |
SEC |
Zacks Reports |
StockTalk |
News |
Chart |
Request a new note
C
A N
S L
I M
|
N
-
NYSE
Netsuite Inc
DIVERSIFIED SERVICES - Business/Management Services
|
$73.62
|
+0.95
1.31% |
$74.99
|
980,806
300.77% of 50 DAV
50 DAV is 326,100
|
$75.75
-2.81%
|
12/12/2012
|
$64.75
|
PP = $67.12
|
|
MB = $70.48
|
Most Recent Note - 3/4/2013 12:36:15 PM
G - Challenging its 52-week and all-time high with today's 5th consecutive volume-driven gain. See the latest FSU analysis for more details and a new annotated graph.
>>> The latest Featured Stock Update with an annotated graph appeared on 3/1/2013. Click here.
View all notes |
Alert me of new notes |
CANSLIM.net Company Profile |
SEC |
Zacks Reports |
StockTalk |
News |
Chart |
Request a new note
C
A N
S L
I M
|
Symbol/Exchange
Company Name
Industry Group |
PRICE |
CHANGE
(%Change) |
Day High |
Volume
(% DAV)
(% 50 day avg vol) |
52 Wk Hi
% From Hi |
Featured
Date |
Price
Featured |
Pivot Featured |
|
Max Buy |
NSR
-
NYSE
Neustar Inc
TELECOMMUNICATIONS - Diversified Communication Serv
|
$43.85
|
-0.02
-0.05% |
$44.07
|
431,565
93.88% of 50 DAV
50 DAV is 459,700
|
$47.24
-7.18%
|
12/11/2012
|
$41.85
|
PP = $41.41
|
|
MB = $43.48
|
Most Recent Note - 3/1/2013 4:02:14 PM
G - Holding is ground just below its 50 DMA line today but enduring more distributional pressure. The damaging loss on 2/21/13 with heavy volume raised concerns and triggered a technical sell signal.
>>> The latest Featured Stock Update with an annotated graph appeared on 2/27/2013. Click here.
View all notes |
Alert me of new notes |
CANSLIM.net Company Profile |
SEC |
Zacks Reports |
StockTalk |
News |
Chart |
Request a new note
C
A N
S L
I M
|
SFUN
-
NYSE
Soufun Hldgs Ltd Ads A
INTERNET - Internet Information Providers
|
$23.51
|
-2.14
-8.34% |
$25.00
|
911,690
275.27% of 50 DAV
50 DAV is 331,200
|
$29.16
-19.38%
|
2/11/2013
|
$27.46
|
PP = $29.26
|
|
MB = $30.72
|
Most Recent Note - 3/4/2013 9:59:40 AM
G - Gapped down again today slumping further below its 50 DMA line raising greater concerns. Prior low on 1/30/13 of $23.52 defines the next important near-term support level. It did not trigger any recent technical buy signal. The market (M criteria) needs to produce a follow-through day to confirm a new rally after recent weakness raised concerns.
>>> The latest Featured Stock Update with an annotated graph appeared on 2/11/2013. Click here.
View all notes |
Alert me of new notes |
CANSLIM.net Company Profile |
SEC |
Zacks Reports |
StockTalk |
News |
Chart |
Request a new note
C
A N
S L
I M
|
SLCA
-
NYSE
U S Silica Holdings Inc
CHEMICALS - Specialty Chemicals
|
$24.41
|
+0.41
1.71% |
$24.80
|
752,272
153.09% of 50 DAV
50 DAV is 491,400
|
$26.41
-7.57%
|
2/26/2013
|
$22.23
|
PP = $21.50
|
|
MB = $22.58
|
Most Recent Note - 3/1/2013 12:42:18 PM
G - Gapped down today, pulling back after a spurt of considerable volume-driven gains this week for new 52-week highs. Disciplined investors do not chase stocks extended from their prior base more than +5% above their pivot point or prior chart highs. See the latest FSU analysis for more details and an new annotated weekly graph.
>>> The latest Featured Stock Update with an annotated graph appeared on 2/26/2013. Click here.
View all notes |
Alert me of new notes |
CANSLIM.net Company Profile |
SEC |
Zacks Reports |
StockTalk |
News |
Chart |
Request a new note
C
A N
S L
I M
|
VRX
-
NYSE
Valeant Pharmaceuticals
DRUGS - Drug Manufacturers - Other
|
$69.41
|
+1.78
2.63% |
$69.41
|
2,528,480
188.17% of 50 DAV
50 DAV is 1,343,700
|
$68.50
1.33%
|
12/20/2012
|
$60.24
|
PP = $61.21
|
|
MB = $64.27
|
Most Recent Note - 2/27/2013 6:33:42 PM
G - Rallied with higher volume to finish just -1.8% off its 52-week high today. The 50 DMA line and recent low ($64.05 on 2/21/13) define the next important support area to watch.
>>> The latest Featured Stock Update with an annotated graph appeared on 2/15/2013. Click here.
View all notes |
Alert me of new notes |
CANSLIM.net Company Profile |
SEC |
Zacks Reports |
StockTalk |
News |
Chart |
Request a new note
C
A N
S L
I M
|
|
|
|
THESE ARE NOT BUY RECOMMENDATIONS!
Comments contained in the body of this report are technical
opinions only. The material herein has been obtained
from sources believed to be reliable and accurate, however,
its accuracy and completeness cannot be guaranteed.
This site is not an investment advisor, hence it does
not endorse or recommend any securities or other investments.
Any recommendation contained in this report may not
be suitable for all investors and it is not to be deemed
an offer or solicitation on our part with respect to
the purchase or sale of any securities. All trademarks,
service marks and trade names appearing in this report
are the property of their respective owners, and are
likewise used for identification purposes only.
This report is a service available
only to active Paid Premium Members.
You may opt-out of receiving report notifications
at any time. Questions or comments may be submitted
by writing to Premium Membership Services 665 S.E. 10 Street, Suite 201 Deerfield Beach, FL 33441-5634 or by calling 1-800-965-8307
or 954-785-1121.
|
|
|

