You are not logged in.
This means you
CAN ONLY VIEW reports that were published prior to Monday, April 14, 2025.
You
MUST UPGRADE YOUR MEMBERSHIP if you want to see any current reports.
AFTER MARKET UPDATE - THURSDAY, MARCH 4TH, 2010
Previous After Market Report Next After Market Report >>>
|
|
|
|
DOW |
+47.38 |
10,444.14 |
+0.46% |
|
Volume |
949,853,810 |
+1% |
|
Volume |
2,150,727,340 |
-17% |
|
NASDAQ |
+11.63 |
2,292.31 |
+0.51% |
|
Advancers |
1,778 |
56% |
|
Advancers |
1,567 |
56% |
|
S&P 500 |
+4.18 |
1,122.97 |
+0.37% |
|
Decliners |
1,254 |
40% |
|
Decliners |
1,104 |
39% |
|
Russell 2000 |
+3.21 |
652.47 |
+0.49% |
|
52 Wk Highs |
227 |
|
|
52 Wk Highs |
124 |
|
|
S&P 600 |
+1.53 |
346.32 |
+0.44% |
|
52 Wk Lows |
2 |
|
|
52 Wk Lows |
5 |
|
|
 |
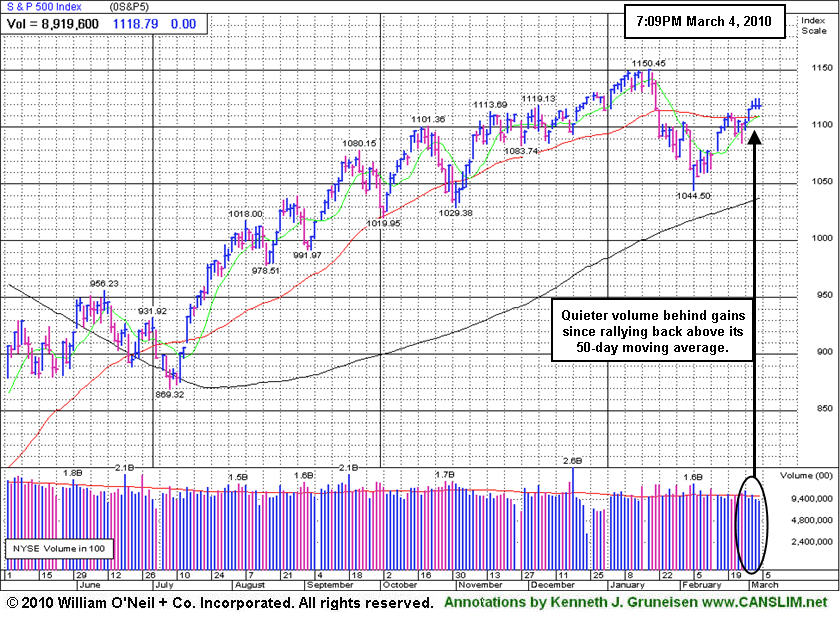
Volume Cools As Indices Hold Ground
Adam Sarhan, Contributing Writer,
Stocks traded between positive and negative territory and closed higher as investors digested the latest round of economic data. Volume, a critical gauge of institutional demand, was reported lower than the prior session on the Nasdaq exchange but slightly higher on the NYSE. Advancers led decliners by about a 3-to-2 ratio on the NYSE and on the Nasdaq exchange. There were 31 high-ranked companies from the CANSLIM.net Leaders List that made a new 52-week high and appeared on the CANSLIM.net BreakOuts Page, down from the 46 issues that appeared on the prior session. New 52-week highs still overwhelmingly trumped new lows on both exchanges.
At 8:30am EST, the Labor Department said weekly jobless claims slid by - 29,000 to 469,000 which fell short of the Street's estimate for 475,000. It was encouraging to see claims fall after rising for most of February. The four-week average, which helps smooth out volatility, slid by -3,500 in the week to 470,750,which was close to late January's reading. Investors are now waiting for Friday's official non farm payrolls report to be released. Analysts believe that the US economy shed -50,000 jobs last month.
Two important reports were released at 10AM EST, factory orders and pending home sales. Factory orders matched estimates and rose a very solid +1.7% in January. Orders for non-durable goods grew by +0.9% and durable goods orders, already released, were revised lower but still grew by +2.6%. Elsewhere, the National Association of Realtors said pending home sales, plunged by -7.6% to 90.4. The NAR blamed poor weather as the primary culprit for the poor reading.
Looking at the market, the latest rally attempt was confirmed when a "cautious follow-through day" was produced by the Nasdaq Composite Index's +1.6% on Monday, March 1st. Weighing into the decision to label the day a follow-through-day (FTD) was the strong action in leading stocks along with a great expansion noted in the new highs list. That action suggests that there is a healthy crop of strong stocks capable of fueling a substantial rally higher for the major averages. We will be looking out for any near-term distribution days (high volume declines) which would hurt the chances for this nascent rally. Until then, the bulls deserve the bullish benefit of the doubt as the major averages continue edging higher.
It is a welcome sign to see the market continue to improve as investors digest the latest round of stronger than expected economic and earnings data. Remember that now that a new rally has been confirmed, the window is open to start buying high quality breakouts. Trade accordingly.
Professional Money Management Services - A Winning System - Inquire today!
Our skilled team of portfolio managers knows how to follow the rules of this fact-based investment system. We do not follow opinion or the "conviction list" of some large Wall Street institution which would have us fully invested even during horrific bear markets. Instead, we remain fluid and only buy the best stocks when they are triggering proper technical buy signals. If you are not completely satisfied with the way your portfolio is being managed, Click here to get connected with one of our portfolio managers. *Accounts over $250,000 please. ** Serious inquires only, please.
PICTURED: The S&P 500 Index has had quieter volume behind gains since rallying back above its 50-day moving average.
|
|
|
 |
Internet Index Rallying Toward Recovery Highs
Kenneth J. Gruneisen - Passed the CAN SLIM® Master's Exam
The Retail Index ($RLX +1.32%) was among the session's best gainers having a positive influence on the major averages while the Broker/Dealer Index ($XBD +0.71%) and Bank Index ($BKX +0.15%) also posted small gains. The Internet Index ($IIX +0.70%) led the tech sector higher while the Networking Index ($NWX +0.04%) and Semiconductor Index ($SOX +0.05%) were virtually unchanged. Commodity-linked areas edged lower on Thursday as the Gold & Silver Index ($XAU -1.32%) and Oil Services Index ($OSX -0.57%) lost ground and the Integrated Oil Index ($XOI -0.01%) ended flat. The Healthcare Index ($HMO -1.29%) and Biotechnology Index ($BTK -0.62%) also traded with a slightly negative bias.
Charts courtesy www.stockcharts.com
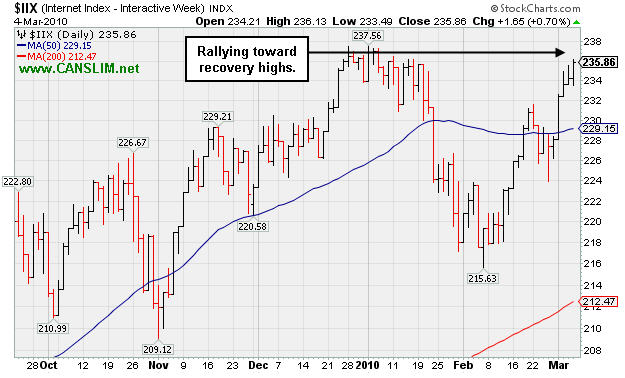
PICTURED: The Internet Index ($IIX +0.70%) is rallying toward recovery highs.
| Oil Services |
$OSX |
207.93 |
-1.19 |
-0.57% |
+6.67% |
| Healthcare |
$HMO |
1,449.33 |
-18.97 |
-1.29% |
-1.60% |
| Integrated Oil |
$XOI |
1,043.19 |
-0.07 |
-0.01% |
-2.34% |
| Semiconductor |
$SOX |
346.55 |
+0.18 |
+0.05% |
-3.71% |
| Networking |
$NWX |
244.98 |
+0.10 |
+0.04% |
+6.02% |
| Internet |
$IIX |
235.86 |
+1.65 |
+0.70% |
+0.86% |
| Broker/Dealer |
$XBD |
115.30 |
+0.81 |
+0.71% |
+0.22% |
| Retail |
$RLX |
429.99 |
+5.61 |
+1.32% |
+4.59% |
| Gold & Silver |
$XAU |
168.03 |
-2.25 |
-1.32% |
-0.13% |
| Bank |
$BKX |
47.43 |
+0.07 |
+0.15% |
+11.05% |
| Biotech |
$BTK |
1,126.52 |
-6.99 |
-0.62% |
+19.57% |
|
|
|
 |
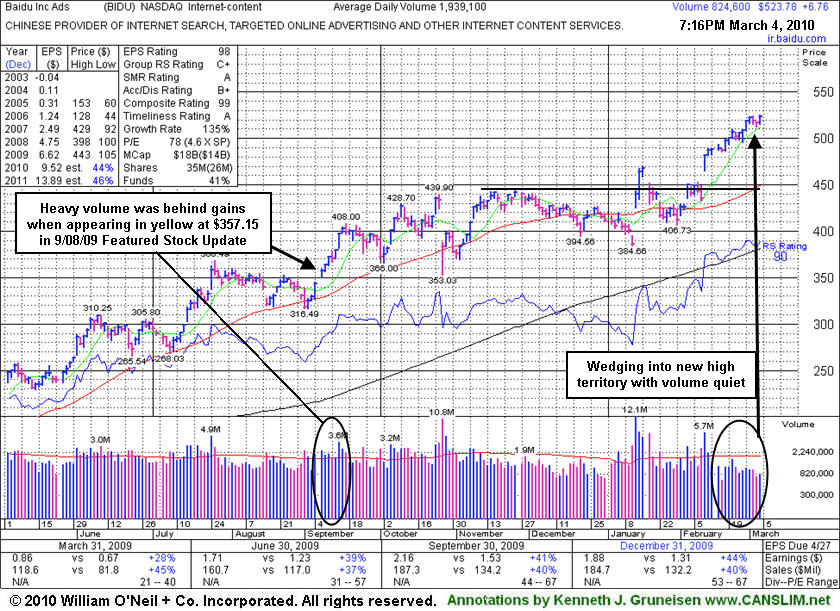
Quiet Ascent Leaves Stock Extended From Base
Kenneth J. Gruneisen - Passed the CAN SLIM® Master's Exam
Baidu.com, Inc. (BIDU +$6.76 or +1.31% to $523.78) posted another gain today on below average volume. It has been continuing a quiet climb into new high ground since reporting earnings and raising guidance on 2/10/10 when its considerable gain was backed by volume more than 3 times average. No overhead supply exists to hinder its progress, but it is too extended from any sound base to be bought within the guidelines now. It has risen from $357 when appearing in this FSU section on 9/08/09 under the headline Baidu Near Multi-Year Highs, But Decelerating Growth Is A Concern.
Compelling proof that institutional investors are accumulating the high-ranked Internet- Content firm's shares is that the number of top-rated funds owning BIDU's shares rose from 103 in Dec '08 to 206 in Dec '09. That is solid evidence its shares were being accumulated by the institutional (I criteria) crowd. It has a stellar sales and earnings history that satisfies the C & A criteria. However it has not formed any recent sound base and is extended from an earlier "double bottom" base pattern that was identified based upon its December low and January's lower low. Technically it triggered a technical buy signal and was featured in yellow on 1/13/10 as it cleared the 12/29/09 high mentioned in the 1/12/10 note. (See the "view all notes" links to review prior analysis on any stock.)
|
|
|
Color Codes Explained :
Y - Better candidates highlighted by our
staff of experts.
G - Previously featured
in past reports as yellow but may no longer be buyable under the
guidelines.
***Last / Change / Volume quote data in this table corresponds with the timestamp on the note***
Symbol/Exchange
Company Name
Industry Group |
Last |
Chg. |
Vol
% DAV |
Date Featured |
Price Featured |
Latest Pivot Point
Featured |
Status |
| Latest Max Buy Price |
ARST
-
|
$28.89
|
+1.56
|
778,829
205% DAV
380,200
|
2/24/2010
(Date
Featured) |
$25.94
(Price
Featured) |
PP = $27.95 |
Y |
| MB = $29.35 |
Most Recent Note - 3/4/2010 5:27:31 PM
Y - Latest quarter ended January 31, 2010 showed earnings per share -29% below the year ago period, raising serious fundamental concerns. However, it gapped up today and triggered a technical buy signal with a solid gain on 2 times average volume, closing above its pivot point and ending just 2 cents under its best ever close. Support to watch is at its 50 DMA line. The recent chart low defines an important support level to watch.
>>> The latest Featured Stock Update with an annotated graph appeared on 2/17/2010. click here.
|
|
C
A
S
I |
News |
Chart |
SEC
View all notes Alert
me of new notes
Company
Profile
|
ARUN
- NASDAQ
Aruba Networks Inc
COMPUTER HARDWARE - Networking & Communication Dev
|
$12.41
|
-0.02
|
916,630
65% DAV
1,407,200
|
2/19/2010
(Date
Featured) |
$12.71
(Price
Featured) |
PP = $11.94 |
Y |
| MB = $12.54 |
Most Recent Note - 3/4/2010 5:28:38 PM
Y - Held its ground today after 4 consecutive gains, perched near its "max buy" level. It found support above prior chart highs following its 2/19/10 gap up gain on heavy volume. ARUN was featured in the mid-day report on 2/19/10 as it rose from a flat base-on-base pattern above its 50-day moving average line (read here).
>>> The latest Featured Stock Update with an annotated graph appeared on 2/22/2010. click here.
|
|
C
A
S
I |
News |
Chart |
SEC
View all notes Alert
me of new notes
Company
Profile
|
BIDU
- NASDAQ
Baidu Inc Ads
INTERNET - Internet Information Providers
|
$523.78
|
+6.76
|
825,592
43% DAV
1,939,100
|
1/13/2010
(Date
Featured) |
$431.25
(Price
Featured) |
PP = $426.75 |
G |
| MB = $448.09 |
Most Recent Note - 3/4/2010 5:38:59 PM
G - Small gain today with light volume for a new all-time high. Extended above its mid-January highs now, it rose steadily since the 2/10/10 gap up gain with more than 3 times average volume.
>>> The latest Featured Stock Update with an annotated graph appeared on 3/4/2010. click here.
|
|
C
A
S
I |
News |
Chart |
SEC
View all notes Alert
me of new notes
Company
Profile
|
BRLI
- NASDAQ
Bio Reference Labs Inc
HEALTH SERVICES - Medical Laboratories & Researc
|
$42.97
|
+1.76
|
199,213
218% DAV
91,200
|
2/12/2010
(Date
Featured) |
$39.02
(Price
Featured) |
PP = $40.97 |
Y |
| MB = $43.02 |
Most Recent Note - 3/4/2010 5:41:08 PM
Y - Spiked to another new high with today's gain on 2 times average volume lifting it back above its pivot point confirming a technical buy signal. With no overhead supply, its weekly chart is marked by many up weeks with above average volume and few down weeks on volume -very bullish characteristics. This high-ranked Medical-Dental - Services firm was featured in yellow in the 2/12/10 mid-day report (read here).
>>> The latest Featured Stock Update with an annotated graph appeared on 3/1/2010. click here.
|
|
C
A
S
I |
News |
Chart |
SEC
View all notes Alert
me of new notes
Company
Profile
|
CACC
- NASDAQ
Credit Acceptance Corp
FINANCIAL SERVICES - Credit Services
|
$43.09
|
-0.64
|
45,991
76% DAV
60,600
|
9/29/2009
(Date
Featured) |
$33.48
(Price
Featured) |
PP = $37.10 |
G |
| MB = $38.96 |
Most Recent Note - 3/4/2010 5:42:43 PM
G - Loss on lighter volume today. Its 50 DMA line acted as resistance this week. Recent lows are a nearby chart support level to watch just above its old chart highs in the $37 area.
>>> The latest Featured Stock Update with an annotated graph appeared on 3/2/2010. click here.
|
|
C
A
S
I |
News |
Chart |
SEC
View all notes Alert
me of new notes
Company
Profile
|
CISG
- NASDAQ
Cninsure Inc Ads
INSURANCE - Insurance Brokers
|
$24.61
|
+0.16
|
535,941
291% DAV
184,400
|
3/3/2010
(Date
Featured) |
$24.38
(Price
Featured) |
PP = $23.10 |
Y |
| MB = $24.26 |
Most Recent Note - 3/4/2010 5:44:14 PM
Y - Hit a new 52 week high today, trading above its max buy level. On 3/03/10 it spiked higher with 8 times average volume following its latest earnings report for the quarter ended Dec 31, 2009, rising from a 20-week double bottom base. It was featured in the mid-day report (read here) color coded yellow with pivot point cited based on its 11/18/09 high. This China-based insurance broker has shown strong earnings and sales growth above the +25% guideline but generally decelerating over the course of recent years. The lack of leadership in the Insurance-Brokers industry group also remains a concern with respect to the investment system's L criteria.
>>> The latest Featured Stock Update with an annotated graph appeared on 3/3/2010. click here.
|
|
C
A
S
I |
News |
Chart |
SEC
View all notes Alert
me of new notes
Company
Profile
|
CRM
- NYSE
Salesforce.com Inc
INTERNET - Internet Software & Services
|
$70.89
|
+0.32
|
1,379,795
65% DAV
2,107,700
|
12/18/2009
(Date
Featured) |
$67.32
(Price
Featured) |
PP = $67.82 |
G |
| MB = $71.21 |
Most Recent Note - 3/4/2010 5:53:20 PM
G - Quietly consolidating after its recent rebound above its 50 DMA line. Trading -6% from its all-time high now, but it has not formed a new sound base. Recent chart low ($64.77 on 2/25/10) is now an important support level to watch.
>>> The latest Featured Stock Update with an annotated graph appeared on 2/10/2010. click here.
|
|
C
A
S
I |
News |
Chart |
SEC
View all notes Alert
me of new notes
Company
Profile
|
CTRP
- NASDAQ
Ctrip.com Intl Ltd Adr
LEISURE - Resorts & Casinos
|
$37.68
|
+1.26
|
3,693,176
174% DAV
2,128,500
|
3/1/2010
(Date
Featured) |
$38.23
(Price
Featured) |
PP = $38.50 |
Y |
| MB = $40.43 |
Most Recent Note - 3/4/2010 6:00:29 PM
Y - Gapped up today for a gain on above average volume, but it remains below its pivot point. It promptly reversed after its 3/01/10 gain for a new all-time high. It was noted that the 3/01/10 gain above its pivot point did not meet the minimum volume threshold of +50% above average volume required for a proper technical buy signal. Featured in the new March 2010 issue of CANSLIM.net News (read here).
>>> The latest Featured Stock Update with an annotated graph appeared on 2/28/2010. click here.
|
|
C
A
S
I |
News |
Chart |
SEC
View all notes Alert
me of new notes
Company
Profile
|
EZPW
- NASDAQ
Ezcorp Inc Cl A
SPECIALTY RETAIL - Specialty Retail, Other
|
$20.24
|
+0.32
|
310,656
67% DAV
466,700
|
2/19/2010
(Date
Featured) |
$19.03
(Price
Featured) |
PP = $18.80 |
G |
| MB = $19.74 |
Most Recent Note - 3/4/2010 6:08:21 PM
G - Small gain today with light volume after hitting a new all-time high on 3/03/10 and negatively reversing. Prior chart highs in the $18 area define an important support level to watch. Featured in yellow in the 2/19/10 mid-day report (read here).
>>> The latest Featured Stock Update with an annotated graph appeared on 2/19/2010. click here.
|
|
C
A
S
I |
News |
Chart |
SEC
View all notes Alert
me of new notes
Company
Profile
|
GMCR
- NASDAQ
Green Mtn Coffee Roastrs
FOOD & BEVERAGE - Processed & Packaged Goods
|
$87.32
|
+0.09
|
626,336
42% DAV
1,477,400
|
2/26/2010
(Date
Featured) |
$84.39
(Price
Featured) |
PP = $88.75 |
Y |
| MB = $93.19 |
Most Recent Note - 3/4/2010 6:25:23 PM
Y - Perched near its pivot point. A big gain on 3/02/10 had heavy volume, but it did not close above its pivot point cited. Keep in mind that GMCR has formed a "late-stage" base after showing up as a fresh buy candidate long ago in CANSLIM.net reports. Important initial support level to watch is its 50 DMA line and recent lows near the $80 area.
>>> The latest Featured Stock Update with an annotated graph appeared on 2/23/2010. click here.
|
|
C
A
S
I |
News |
Chart |
SEC
View all notes Alert
me of new notes
Company
Profile
|
ISRG
- NASDAQ
Intuitive Surgical Inc
HEALTH SERVICES - Medical Appliances & Equipment
|
$354.49
|
-8.31
|
580,268
111% DAV
521,100
|
1/22/2010
(Date
Featured) |
$340.40
(Price
Featured) |
PP = $314.00 |
G |
| MB = $329.70 |
Most Recent Note - 3/4/2010 6:27:23 PM
G - Gapped down today after 4 consecutive gains for new all-time highs, pulling back toward its prior chart highs. ISRG was featured at $340.40 in the 1/22/10 mid-day report following a powerful breakaway gap (read here).
>>> The latest Featured Stock Update with an annotated graph appeared on 2/24/2010. click here.
|
|
C
A
S
I |
News |
Chart |
SEC
View all notes Alert
me of new notes
Company
Profile
|
PCLN
- NASDAQ
Priceline.com Inc
INTERNET - Internet Software & Services
|
$399.55
|
-4.72
|
584,812
N/A
|
11/1/2002
(Date
Featured) |
$399.55
(Price
Featured) |
PP = $428.20 |
Y |
| MB = $449.61 |
Most Recent Note - 1/2/2011
Y - Returns to Featured Stocks list with its appearance in the January 2011 CANSLIM.net News including detailed analysis and annotated daily and weekly graphs.
>>> The latest Featured Stock Update with an annotated graph appeared on 2/18/2010. click here.
|
|
C
A
S
I |
News |
Chart |
SEC
View all notes Alert
me of new notes
Company
Profile
|
PEGA
- NASDAQ
Pegasystems Inc
COMPUTER SOFTWARE & SERVICES - Business Software & Services
|
$35.02
|
-0.41
|
129,469
63% DAV
204,000
|
2/26/2010
(Date
Featured) |
$36.00
(Price
Featured) |
PP = $38.55 |
Y |
| MB = $40.48 |
Most Recent Note - 3/4/2010 6:31:41 PM
Y - Loss today on light volume, testing its 50 DMA line. Positively reversed on 2/23/10 after a brief 50 DMA line violation, finding prompt support near prior chart lows in the $32 area.
>>> The latest Featured Stock Update with an annotated graph appeared on 2/26/2010. click here.
|
|
C
A
S
I |
News |
Chart |
SEC
View all notes Alert
me of new notes
Company
Profile
|
ROVI
- NASDAQ
Rovi Corp
COMPUTER SOFTWARE & SERVICES - Security Software & Services
|
$35.01
|
+0.38
|
997,712
95% DAV
1,054,400
|
2/25/2010
(Date
Featured) |
$33.54
(Price
Featured) |
PP = $34.87 |
Y |
| MB = $36.61 |
Most Recent Note - 3/4/2010 6:33:46 PM
Y - Gain today for a new high close. Considerable 3/02/10 gain with volume more than 2 times average triggered a technical buy signal as it rallied above its pivot point. Announced news after Monday's close about an expansion of its relationship with Comcast (read here). Featured on 2/25/10 in yellow in the mid-day report (read here).
>>> The latest Featured Stock Update with an annotated graph appeared on 2/25/2010. click here.
|
|
C
A
S
I |
News |
Chart |
SEC
View all notes Alert
me of new notes
Company
Profile
|
SIRO
- NASDAQ
Sirona Dental Systems
HEALTH SERVICES - Medical Instruments & Supplies
|
$36.75
|
+0.08
|
246,623
44% DAV
559,900
|
2/16/2010
(Date
Featured) |
$36.43
(Price
Featured) |
PP = $36.15 |
Y |
| MB = $37.96 |
Most Recent Note - 3/4/2010 6:38:31 PM
Y - Pulled back on light volume today, still perched above its pivot point but below its max buy level. It was featured in yellow in the 2/16/10 mid-day report (read here) as it broke out from a 10-week flat base.
>>> The latest Featured Stock Update with an annotated graph appeared on 2/16/2010. click here.
|
|
C
A
S
I |
News |
Chart |
SEC
View all notes Alert
me of new notes
Company
Profile
|
VPRT
- NASDAQ
Vistaprint Nv
DIVERSIFIED SERVICES - Business/Management Services
|
$59.70
|
+0.81
|
308,910
63% DAV
487,800
|
3/1/2010
(Date
Featured) |
$57.72
(Price
Featured) |
PP = $59.70 |
Y |
| MB = $62.69 |
Most Recent Note - 3/4/2010 6:42:57 PM
Y - Small gain today on very light volume for a new high close right at its pivot point. Perched near its all-time high after gain on 3/02/10 lacked great volume conviction. Featured in the March 2010 CANSLIM.net News monthly newsletter (read here).
>>> The latest Featured Stock Update with an annotated graph appeared on 2/28/2010. click here.
|
|
C
A
S
I |
News |
Chart |
SEC
View all notes Alert
me of new notes
Company
Profile
|
|
|
|
THESE ARE NOT BUY RECOMMENDATIONS!
Comments contained in the body of this report are technical
opinions only. The material herein has been obtained
from sources believed to be reliable and accurate, however,
its accuracy and completeness cannot be guaranteed.
This site is not an investment advisor, hence it does
not endorse or recommend any securities or other investments.
Any recommendation contained in this report may not
be suitable for all investors and it is not to be deemed
an offer or solicitation on our part with respect to
the purchase or sale of any securities. All trademarks,
service marks and trade names appearing in this report
are the property of their respective owners, and are
likewise used for identification purposes only.
This report is a service available
only to active Paid Premium Members.
You may opt-out of receiving report notifications
at any time. Questions or comments may be submitted
by writing to Premium Membership Services 665 S.E. 10 Street, Suite 201 Deerfield Beach, FL 33441-5634 or by calling 1-800-965-8307
or 954-785-1121.
|
|
|


