You are not logged in.
This means you
CAN ONLY VIEW reports that were published prior to Monday, April 14, 2025.
You
MUST UPGRADE YOUR MEMBERSHIP if you want to see any current reports.
AFTER MARKET UPDATE - FRIDAY, MARCH 1ST, 2013
Previous After Market Report Next After Market Report >>>
|
|
|
|
DOW |
+35.17 |
14,089.66 |
+0.25% |
|
Volume |
743,401,920 |
-26% |
|
Volume |
1,815,344,400 |
-5% |
|
NASDAQ |
+9.55 |
3,169.74 |
+0.30% |
|
Advancers |
1,673 |
53% |
|
Advancers |
1,393 |
54% |
|
S&P 500 |
+3.52 |
1,518.20 |
+0.23% |
|
Decliners |
1,319 |
42% |
|
Decliners |
1,055 |
41% |
|
Russell 2000 |
+3.62 |
914.73 |
+0.40% |
|
52 Wk Highs |
161 |
|
|
52 Wk Highs |
107 |
|
|
S&P 600 |
+1.97 |
512.40 |
+0.39% |
|
52 Wk Lows |
45 |
|
|
52 Wk Lows |
36 |
|
|
 |
Major Averages Rose Again With Less Volume Conviction
Kenneth J. Gruneisen - Passed the CAN SLIM® Master's Exam
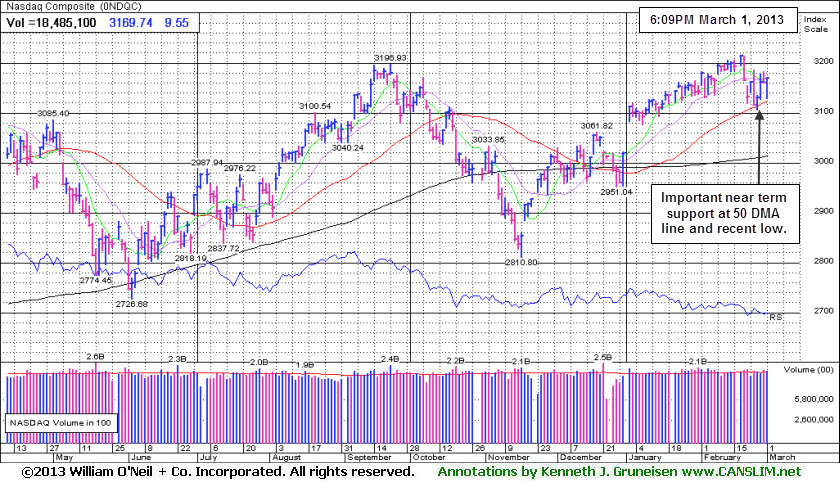
For the week, the Nasdaq Composite Index advanced +0.3% and the S&P 500 Index gained +0.2%, and the Dow Jones Industrial Average led the way with a gain of +0.6%. Behind Friday's small gains for the major averages the volume totals reported were lighter than the prior session on the NYSE and on the Nasdaq exchange. Breadth was slightly positive as advancers led decliners by an 8-7 margin on the NYSE and 7-5 on the Nasdaq exchange. The total number of stocks hitting new 52-week highs still outnumbered new 52-week lows on the NYSE and on the Nasdaq exchange. There were 47 high-ranked companies from the CANSLIM.net Leaders List making new 52-week highs and appearing on the CANSLIM.net BreakOuts Page, near the prior session's total of 49 stocks. There were gains for 9 of the 12 high-ranked companies currently included on the Featured Stocks Page.
The major averages rebounded from an early retreat as positive manufacturing and consumer sentiment reports offset a decline in personal income. The ISM survey revealed manufacturing activity in February expanded at its fastest pace in almost two years. The University of Michigan consumer confidence report increased to 77.6 in February from the previous reading of 76.3. Personal income unexpectedly fell -3.6% in January. The market also advanced ahead of the $85 billion in federal spending cuts expected to take effect at midnight.
Health care was the best performing sector. Intuitive Surgical (ISRG +8.53%) rallied as analysts defended the stock after the prior session's -11.0% drop. Consumer discretionary also outperformed with retailer The Gap Inc (GPS +2.89%) after announcing positive quarterly results and a dividend increase. Energy and materials were the laggards on the session. Halliburton Co (HAL -2.12%) and coal producer Consol Energy (CNX -4.70%) fell.
The 10-year note rose a 1/4 of a point to yield 1.84%.
An expansion in leadership was reassuring after Tuesday's new 52-week high totals were notably thin at 62 on the NYSE and 38 on the Nasdaq exchange, down drastically versus the totals reported in the 2/19/13 after-market report (read here) when there were 400 new 52-week highs on the NYSE and 240 new highs on the Nasdaq exchange. Any sustainable rally requires a healthy crop of companies hitting new 52-week highs, so it is always essential to see meaningful leadership (stocks hitting new 52-week highs).
New buying efforts are to be avoided under the fact-based system since the market's (M criteria) weak action and damaging distribution was recognized as a correction earlier this week. Individual holdings should be watched closely while investors have a bias toward reducing market exposure until there is a new confirmed rally with a follow-through day noted.
Watch for an announcement via email concerning the next WEBCAST. The webcast will also be available via an updated link highlighted at the top of the Premium Member Homepage.
PICTURED: The Nasdaq Composite Index recently found support at its 50-day moving average (DMA) line. That important short-term average and its recent low define near-term support where any further deterioration would bode poorly for the broader market outlook.
|
 Kenneth J. Gruneisen started out as a licensed stockbroker in August 1987, a couple of months prior to the historic stock market crash that took the Dow Jones Industrial Average down -22.6% in a single day. He has published daily fact-based fundamental and technical analysis on high-ranked stocks online for two decades. Through FACTBASEDINVESTING.COM, Kenneth provides educational articles, news, market commentary, and other information regarding proven investment systems that work in good times and bad.
Comments contained in the body of this report are technical opinions only and are not necessarily those of Gruneisen Growth Corp. The material herein has been obtained from sources believed to be reliable and accurate, however, its accuracy and completeness cannot be guaranteed. Our firm, employees, and customers may effect transactions, including transactions contrary to any recommendation herein, or have positions in the securities mentioned herein or options with respect thereto. Any recommendation contained in this report may not be suitable for all investors and it is not to be deemed an offer or solicitation on our part with respect to the purchase or sale of any securities. |
|
 |
Biotech, Retail, and Bank Indexes' Gains Offset Commodity-Linked Weakness
Kenneth J. Gruneisen - Passed the CAN SLIM® Master's Exam
The Biotechnology Index ($BTK +1.54%) was a standout gainer in the tech sector while the Networking Index ($NWX -0.41%) and the Semiconductor Index ($SOX -0.36%) edged lower and the Internet Index ($IIX +0.32%) edged higher. The Retail Index ($RLX +0.65%) and the Bank Index ($BKX +0.31%) helped give the major averages a boost while the Broker/Dealer Index ($XBD -0.04%) finished flat. The Healthcare Index ($HMO +0.07%) also flat lined for the day. The Integrated Oil Index ($XOI +0.27%) posted a small gain but commodity-linked groups encountered pressure as the Oil Services Index ($OSX -0.85%) and Gold & Silver Index ($XAU -0.71%) lost ground.
Charts courtesy www.stockcharts.com
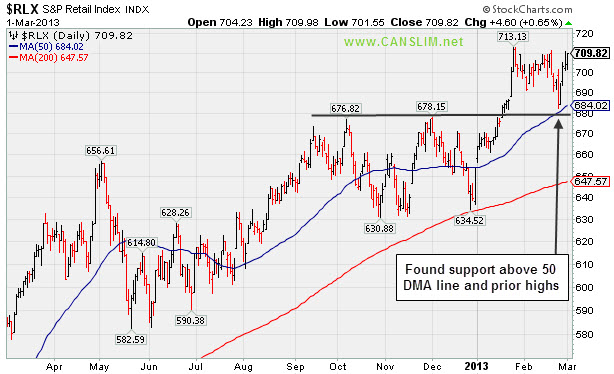
PICTURED: The Retail Index ($RLX +0.65%) found support above its 50-day moving average (DMA) line and above its prior highs during its recent consolidation.
| Oil Services |
$OSX |
241.57 |
-2.06 |
-0.85% |
+9.72% |
| Healthcare |
$HMO |
2,676.40 |
+1.82 |
+0.07% |
+6.45% |
| Integrated Oil |
$XOI |
1,326.34 |
+3.51 |
+0.27% |
+6.81% |
| Semiconductor |
$SOX |
425.09 |
-1.54 |
-0.36% |
+10.68% |
| Networking |
$NWX |
233.71 |
-0.96 |
-0.41% |
+3.16% |
| Internet |
$IIX |
358.27 |
+1.13 |
+0.32% |
+9.56% |
| Broker/Dealer |
$XBD |
105.87 |
-0.04 |
-0.04% |
+12.24% |
| Retail |
$RLX |
709.82 |
+4.60 |
+0.65% |
+8.69% |
| Gold & Silver |
$XAU |
133.29 |
-0.95 |
-0.71% |
-19.51% |
| Bank |
$BKX |
54.15 |
+0.17 |
+0.31% |
+5.60% |
| Biotech |
$BTK |
1,728.64 |
+26.28 |
+1.54% |
+11.74% |
|
|
|
 |
New High Close After Finding Solid Support
Kenneth J. Gruneisen - Passed the CAN SLIM® Master's Exam
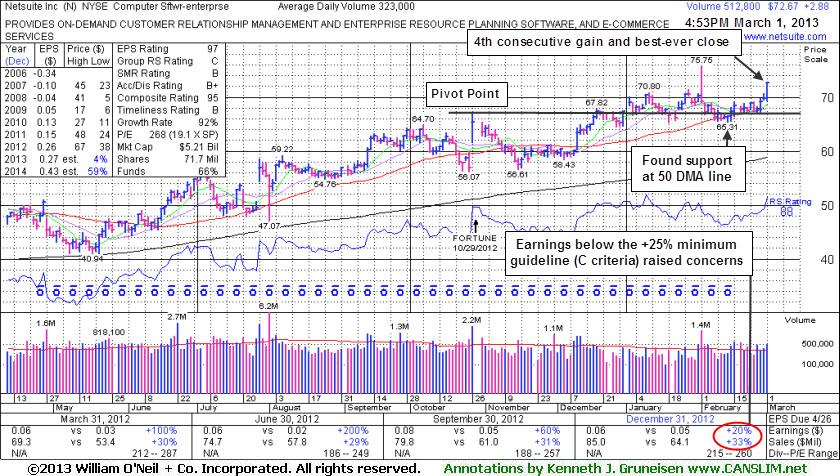
Netsuite Inc (N +$2.88 or +4.13% to $72.67) rallied to its best-ever close with today's 4th consecutive gain. It held its ground near its 50-day moving average (DMA) line recently and fought to stay above prior highs, showing good signs that institutional owners were supporting the stock. The latest action indicates that its shares are being accumulated and bid up.
The number of top-rated funds owning its shares rose from 201 in Jun '11 to 317 in Dec '12, a reassuring sign concerning the I criteria. However, it reported earnings +20% on +33% sales revenues for the Dec '12 quarter, below the +25% minimum earnings guideline (C criteria) raising fundamental concerns for followers of the fact-based investment system.
The company had reported earnings increases above the +25% minimum earnings guideline (C criteria) in the 5 prior quarterly comparisons. Its annual earnings (A criteria) history improved from losses prior to FY '09. Today the Computer Software -Enterprise group has a Group Relative Strength Rating of C, down from a B rating when Netsuite was last shown in this FSU section on 2/05/13 with an annotated graph under the headline, "Fundamental Flaw and Negative Reversal at High Raised Concerns". The stock made limited progress since it was highlighted in yellow in the 12/12/12 mid-day report with a pivot point cited based on its 10/26/12 high plus 10 cents (read here), however it seems to be rewarding patient investors even while the broader market (M criteria) entered a correction.
|
|
|
Color Codes Explained :
Y - Better candidates highlighted by our
staff of experts.
G - Previously featured
in past reports as yellow but may no longer be buyable under the
guidelines.
***Last / Change / Volume data in this table is the closing quote data***
Symbol/Exchange
Company Name
Industry Group |
PRICE |
CHANGE
(%Change) |
Day High |
Volume
(% DAV)
(% 50 day avg vol) |
52 Wk Hi
% From Hi |
Featured
Date |
Price
Featured |
Pivot Featured |
|
Max Buy |
CELG
-
NASDAQ
Celgene Corp
DRUGS - Drug Manufacturers - Major
|
$105.62
|
+2.35
2.28% |
$105.82
|
3,988,687
105.36% of 50 DAV
50 DAV is 3,785,800
|
$105.14
0.46%
|
12/11/2012
|
$82.24
|
PP = $81.34
|
|
MB = $85.41
|
Most Recent Note - 2/28/2013 2:14:59 PM
G - Held its ground in a tight range in recent weeks but did not form a sound base pattern before spiking to a new all-time high with today's volume-driven gain. Recent lows in the $96 area define near-term support above its 50 DMA line.
>>> The latest Featured Stock Update with an annotated graph appeared on 2/28/2013. Click here.
View all notes |
Alert me of new notes |
CANSLIM.net Company Profile |
SEC |
Zacks Reports |
StockTalk |
News |
Chart |
Request a new note
C
A N
S L
I M


|
CFNL
-
NASDAQ
Cardinal Financial Corp
BANKING - Regional - Southeast Banks
|
$16.45
|
+0.52
3.26% |
$16.54
|
156,642
80.12% of 50 DAV
50 DAV is 195,500
|
$16.90
-2.66%
|
12/3/2012
|
$15.20
|
PP = $16.31
|
|
MB = $17.13
|
 Most Recent Note - 3/1/2013 3:59:51 PM
Y - Rebounding above its 50 DMA line and its color code is changed to yellow with today's gain helping its outlook improve.
>>> The latest Featured Stock Update with an annotated graph appeared on 2/21/2013. Click here.
View all notes |
Alert me of new notes |
CANSLIM.net Company Profile |
SEC |
Zacks Reports |
StockTalk |
News |
Chart |
Request a new note
C
A N
S L
I M
|
CMCSA
-
NASDAQ
Comcast Corp Cl A
MEDIA - CATV Systems
|
$40.03
|
+0.24
0.60% |
$40.06
|
12,229,950
86.56% of 50 DAV
50 DAV is 14,128,200
|
$42.00
-4.69%
|
12/3/2012
|
$37.08
|
PP = $38.06
|
|
MB = $39.96
|
Most Recent Note - 2/26/2013 1:55:07 PM
G - Endured mild distributional pressure while recently consolidating near its 52-week high. Reported earnings +11% on +6% sales revenues for the Dec '12 quarter, below the +25% minimum earnings guideline (C criteria), raising fundamental concerns
>>> The latest Featured Stock Update with an annotated graph appeared on 2/19/2013. Click here.
View all notes |
Alert me of new notes |
CANSLIM.net Company Profile |
SEC |
Zacks Reports |
StockTalk |
News |
Chart |
Request a new note
C
A N
S L
I M
|
KORS
-
NYSE
Michael Kors Hldgs Ltd
RETAIL - Apparel Stores
|
$59.23
|
-0.05
-0.08% |
$59.60
|
3,229,349
58.84% of 50 DAV
50 DAV is 5,488,200
|
$65.10
-9.02%
|
1/23/2013
|
$54.98
|
PP = $58.72
|
|
MB = $61.66
|
Most Recent Note - 2/26/2013 2:04:43 PM
G - Rebounded from early losses today, halting its slide near prior highs in the $58 area. Tallied 3 losses on heavy volume in the span of the prior 4 sessions since completing another Secondary Offering 2/20/13 while perched near its all-time high.
>>> The latest Featured Stock Update with an annotated graph appeared on 2/7/2013. Click here.
View all notes |
Alert me of new notes |
CANSLIM.net Company Profile |
SEC |
Zacks Reports |
StockTalk |
News |
Chart |
Request a new note
C
A N
S L
I M
|
LNKD
-
NYSE
Linkedin Corp Class A
INTERNET - Internet Information Providers
|
$170.46
|
+2.28
1.36% |
$171.82
|
2,359,237
103.48% of 50 DAV
50 DAV is 2,279,900
|
$169.85
0.36%
|
2/8/2013
|
$147.04
|
PP = $127.55
|
|
MB = $133.93
|
Most Recent Note - 2/27/2013 12:48:55 PM
G - Considerable volume-driven gain today for another new all-time high, getting very extended from any sound base. Previously noted - "Disciplined investors may watch for secondary buy points or additional bases to possibly form and be noted in the weeks ahead."
>>> The latest Featured Stock Update with an annotated graph appeared on 2/8/2013. Click here.
View all notes |
Alert me of new notes |
CANSLIM.net Company Profile |
SEC |
Zacks Reports |
StockTalk |
News |
Chart |
Request a new note
C
A N
S L
I M
|
Symbol/Exchange
Company Name
Industry Group |
PRICE |
CHANGE
(%Change) |
Day High |
Volume
(% DAV)
(% 50 day avg vol) |
52 Wk Hi
% From Hi |
Featured
Date |
Price
Featured |
Pivot Featured |
|
Max Buy |
LOPE
-
NASDAQ
Grand Canyon Education
DIVERSIFIED SERVICES - Education and; Training Services
|
$24.02
|
+0.07
0.29% |
$24.11
|
419,761
91.45% of 50 DAV
50 DAV is 459,000
|
$27.18
-11.63%
|
2/20/2013
|
$26.44
|
PP = $25.10
|
|
MB = $26.36
|
Most Recent Note - 2/26/2013 12:30:57 PM
G - Down considerably today, raising concerns while slumping below its 50 DMA line, and its color code is changed to green. It quickly negated its recent technical breakout.
>>> The latest Featured Stock Update with an annotated graph appeared on 2/20/2013. Click here.
View all notes |
Alert me of new notes |
CANSLIM.net Company Profile |
SEC |
Zacks Reports |
StockTalk |
News |
Chart |
Request a new note
C
A N
S L
I M
|
MIDD
-
NASDAQ
Middleby Corp
MANUFACTURING - Diversified Machinery
|
$150.19
|
+0.88
0.59% |
$150.96
|
165,514
171.70% of 50 DAV
50 DAV is 96,400
|
$154.74
-2.94%
|
10/8/2012
|
$118.46
|
PP = $122.67
|
|
MB = $128.80
|
Most Recent Note - 2/27/2013 12:51:03 PM
G - Rallied to a new all-time high today with a 2nd consecutive gain backed by above average volume. Fundamental concerns were recently noted and prior reports cautioned members that it is extended from any sound base. Its 50 DMA line defines important near-term chart support above prior highs in the $134-135 area.
>>> The latest Featured Stock Update with an annotated graph appeared on 2/25/2013. Click here.
View all notes |
Alert me of new notes |
CANSLIM.net Company Profile |
SEC |
Zacks Reports |
StockTalk |
News |
Chart |
Request a new note
C
A N
S L
I M
|
N
-
NYSE
Netsuite Inc
DIVERSIFIED SERVICES - Business/Management Services
|
$72.67
|
+2.88
4.13% |
$72.83
|
512,806
158.76% of 50 DAV
50 DAV is 323,000
|
$75.75
-4.07%
|
12/12/2012
|
$64.75
|
PP = $67.12
|
|
MB = $70.48
|
Most Recent Note - 3/1/2013 5:24:28 PM
G - Best-ever close with today's 4th consecutive gain. See the latest FSU analysis for more details and a new annotated graph.
>>> The latest Featured Stock Update with an annotated graph appeared on 3/1/2013. Click here.
View all notes |
Alert me of new notes |
CANSLIM.net Company Profile |
SEC |
Zacks Reports |
StockTalk |
News |
Chart |
Request a new note
C
A N
S L
I M
|
NSR
-
NYSE
Neustar Inc
TELECOMMUNICATIONS - Diversified Communication Serv
|
$43.87
|
+0.02
0.05% |
$44.02
|
607,383
132.13% of 50 DAV
50 DAV is 459,700
|
$47.24
-7.13%
|
12/11/2012
|
$41.85
|
PP = $41.41
|
|
MB = $43.48
|
Most Recent Note - 3/1/2013 4:02:14 PM
G - Holding is ground just below its 50 DMA line today but enduring more distributional pressure. The damaging loss on 2/21/13 with heavy volume raised concerns and triggered a technical sell signal.
>>> The latest Featured Stock Update with an annotated graph appeared on 2/27/2013. Click here.
View all notes |
Alert me of new notes |
CANSLIM.net Company Profile |
SEC |
Zacks Reports |
StockTalk |
News |
Chart |
Request a new note
C
A N
S L
I M
|
SFUN
-
NYSE
Soufun Hldgs Ltd Ads A
INTERNET - Internet Information Providers
|
$25.65
|
-1.20
-4.47% |
$26.30
|
639,216
197.90% of 50 DAV
50 DAV is 323,000
|
$29.16
-12.04%
|
2/11/2013
|
$27.46
|
PP = $29.26
|
|
MB = $30.72
|
Most Recent Note - 3/1/2013 12:39:14 PM
G - Gapped down today slumping back below its 50 DMA line with a loss on higher volume and its color code is changed to green again. It still needs to produce gains above its pivot point before buying efforts may be justified under the fact-based system. The market (M criteria) also needs to produce a follow-through day to confirm a new rally after recent weakness raised concerns.
>>> The latest Featured Stock Update with an annotated graph appeared on 2/11/2013. Click here.
View all notes |
Alert me of new notes |
CANSLIM.net Company Profile |
SEC |
Zacks Reports |
StockTalk |
News |
Chart |
Request a new note
C
A N
S L
I M
|
Symbol/Exchange
Company Name
Industry Group |
PRICE |
CHANGE
(%Change) |
Day High |
Volume
(% DAV)
(% 50 day avg vol) |
52 Wk Hi
% From Hi |
Featured
Date |
Price
Featured |
Pivot Featured |
|
Max Buy |
SLCA
-
NYSE
U S Silica Holdings Inc
CHEMICALS - Specialty Chemicals
|
$24.00
|
-0.59
-2.40% |
$25.33
|
1,064,817
223.37% of 50 DAV
50 DAV is 476,700
|
$26.41
-9.13%
|
2/26/2013
|
$22.23
|
PP = $21.50
|
|
MB = $22.58
|
Most Recent Note - 3/1/2013 12:42:18 PM
G - Gapped down today, pulling back after a spurt of considerable volume-driven gains this week for new 52-week highs. Disciplined investors do not chase stocks extended from their prior base more than +5% above their pivot point or prior chart highs. See the latest FSU analysis for more details and an new annotated weekly graph.
>>> The latest Featured Stock Update with an annotated graph appeared on 2/26/2013. Click here.
View all notes |
Alert me of new notes |
CANSLIM.net Company Profile |
SEC |
Zacks Reports |
StockTalk |
News |
Chart |
Request a new note
C
A N
S L
I M
|
VRX
-
NYSE
Valeant Pharmaceuticals
DRUGS - Drug Manufacturers - Other
|
$67.63
|
+0.17
0.25% |
$68.50
|
2,114,309
158.39% of 50 DAV
50 DAV is 1,334,900
|
$67.98
-0.51%
|
12/20/2012
|
$60.24
|
PP = $61.21
|
|
MB = $64.27
|
Most Recent Note - 2/27/2013 6:33:42 PM
G - Rallied with higher volume to finish just -1.8% off its 52-week high today. The 50 DMA line and recent low ($64.05 on 2/21/13) define the next important support area to watch.
>>> The latest Featured Stock Update with an annotated graph appeared on 2/15/2013. Click here.
View all notes |
Alert me of new notes |
CANSLIM.net Company Profile |
SEC |
Zacks Reports |
StockTalk |
News |
Chart |
Request a new note
C
A N
S L
I M
|
|
|
|
THESE ARE NOT BUY RECOMMENDATIONS!
Comments contained in the body of this report are technical
opinions only. The material herein has been obtained
from sources believed to be reliable and accurate, however,
its accuracy and completeness cannot be guaranteed.
This site is not an investment advisor, hence it does
not endorse or recommend any securities or other investments.
Any recommendation contained in this report may not
be suitable for all investors and it is not to be deemed
an offer or solicitation on our part with respect to
the purchase or sale of any securities. All trademarks,
service marks and trade names appearing in this report
are the property of their respective owners, and are
likewise used for identification purposes only.
This report is a service available
only to active Paid Premium Members.
You may opt-out of receiving report notifications
at any time. Questions or comments may be submitted
by writing to Premium Membership Services 665 S.E. 10 Street, Suite 201 Deerfield Beach, FL 33441-5634 or by calling 1-800-965-8307
or 954-785-1121.
|
|
|

