You are not logged in.
This means you
CAN ONLY VIEW reports that were published prior to Monday, April 14, 2025.
You
MUST UPGRADE YOUR MEMBERSHIP if you want to see any current reports.
AFTER MARKET UPDATE - THURSDAY, FEBRUARY 28TH, 2013
Previous After Market Report Next After Market Report >>>
|
|
|
|
DOW |
-20.88 |
14,054.49 |
-0.15% |
|
Volume |
1,004,862,960 |
+49% |
|
Volume |
1,906,281,430 |
+14% |
|
NASDAQ |
-2.07 |
3,160.19 |
-0.07% |
|
Advancers |
1,538 |
49% |
|
Advancers |
1,204 |
47% |
|
S&P 500 |
-1.31 |
1,514.68 |
-0.09% |
|
Decliners |
1,455 |
47% |
|
Decliners |
1,247 |
49% |
|
Russell 2000 |
+1.19 |
911.11 |
+0.13% |
|
52 Wk Highs |
214 |
|
|
52 Wk Highs |
105 |
|
|
S&P 600 |
+1.17 |
510.43 |
+0.23% |
|
52 Wk Lows |
28 |
|
|
52 Wk Lows |
19 |
|
|
 |
Major Averages Erased Early Gains
Kenneth J. Gruneisen - Passed the CAN SLIM® Master's Exam
Leadership improved on Thursday but the major indices erased early gains and ended near the session low with small losses. The volume totals were reported higher than the prior session on the NYSE and on the Nasdaq exchange. Advancers and decliners were evenly mixed on the NYSE and on the Nasdaq exchange. New highs easily outnumbered new 52-week lows on the NYSE and on the Nasdaq exchange. There were 49 high-ranked companies from the CANSLIM.net Leaders List which hit new 52-week highs and appeared on the CANSLIM.net BreakOuts Page, up from Wednesday's total of 41 stocks. There were gains for 11 of the 12 high-ranked companies currently included on the Featured Stocks Page.

The expansion in leadership was reassuring. Tuesday's new 52-week high totals were "thin" at 62 on the NYSE and 38 on the Nasdaq exchange, down drastically versus the totals reported in the 2/19/13 after-market report (read here) when there were 400 new 52-week highs on the NYSE and 240 new highs on the Nasdaq exchange. Any sustainable rally requires a healthy crop of companies hitting new 52-week highs, so it is always essential to see meaningful leadership (stocks hitting new 52-week highs).
Before the open, fourth-quarter GDP was revised up to +0.1%, less than the consensus estimate for +0.5% growth. Weekly jobless claims unexpectedly declined to 344,000 from a revised prior reading of 366,000.The Chicago PMI report showed Midwest manufacturing activity rose to 56.8 in February, above the consensus estimate of 54.0. In addition to the data, attention was on Washington as to whether lawmakers would reach a last minute deal to avoid the $85 billion automatic spending cuts set to go into effect on Friday.
On the earnings front, retailer Sears Holdings (SHLD -5.20%) despite quarterly results beating projections. The J.C. Penney Company Inc (JCP -16.97%) fell after posting a wider-than-expected loss. Tech was among the best performing sectors as shares of Facebook Inc (FB +1.41%) offset weakness elsewhere.
New buying efforts are to be avoided under the fact-based system since the market's (M criteria) weak action and damaging distribution was recognized as a correction earlier this week. Individual holdings should be watched closely while investors have a bias toward reducing market exposure until there is a new confirmed rally with a follow-through day noted.
Watch for an announcement via email concerning the next WEBCAST. The webcast will also be available via an updated link highlighted at the top of the Premium Member Homepage.
PICTURED: The Dow Jones Industrial Average traded within less than 50 points of its October 2007 high before reversing early gains and closing the session with a small loss.
|
 Kenneth J. Gruneisen started out as a licensed stockbroker in August 1987, a couple of months prior to the historic stock market crash that took the Dow Jones Industrial Average down -22.6% in a single day. He has published daily fact-based fundamental and technical analysis on high-ranked stocks online for two decades. Through FACTBASEDINVESTING.COM, Kenneth provides educational articles, news, market commentary, and other information regarding proven investment systems that work in good times and bad.
Comments contained in the body of this report are technical opinions only and are not necessarily those of Gruneisen Growth Corp. The material herein has been obtained from sources believed to be reliable and accurate, however, its accuracy and completeness cannot be guaranteed. Our firm, employees, and customers may effect transactions, including transactions contrary to any recommendation herein, or have positions in the securities mentioned herein or options with respect thereto. Any recommendation contained in this report may not be suitable for all investors and it is not to be deemed an offer or solicitation on our part with respect to the purchase or sale of any securities. |
|
 |
Retail and Tech Areas Rose While Defensive Groups Fell
Kenneth J. Gruneisen - Passed the CAN SLIM® Master's Exam
The Retail Index ($RLX +0.27%) posted a small gain and the Biotechnology Index ($BTK +0.78%) led the tech sector while the Internet Index ($IIX +0.23%) edged higher and the Semiconductor Index ($SOX +0.04%) finished flat, but the Networking Index ($NWX -0.62%) lost ground. Financial groups also had a slightly negative bias as the Broker/Dealer Index ($XBD -0.31%) and Bank Index ($BKX -0.09%) edged lower. Energy-related groups had little conviction as the Oil Services Index ($OSX -0.17%) inched lower and the Integrated Oil Index ($XOI +0.01%) finished flat. Defensive groups were clearly laggards on Thursday as the Gold & Silver Index ($XAU -2.18%) led decliners and the Healthcare Index ($HMO -0.72%) edged lower.
Charts courtesy www.stockcharts.com

PICTURED: The Internet Index ($IIX +0.23%) is consolidating well above its 50-day moving average (DMA) line. A strong start helped it rally +9.41% since January 1st as of the close on 2/20/13, before its latest pullback.
| Oil Services |
$OSX |
243.63 |
-0.42 |
-0.17% |
+10.66% |
| Healthcare |
$HMO |
2,674.58 |
-19.49 |
-0.72% |
+6.38% |
| Integrated Oil |
$XOI |
1,322.83 |
+0.16 |
+0.01% |
+6.52% |
| Semiconductor |
$SOX |
426.63 |
+0.17 |
+0.04% |
+11.08% |
| Networking |
$NWX |
234.67 |
-1.45 |
-0.62% |
+3.58% |
| Internet |
$IIX |
357.13 |
+0.84 |
+0.23% |
+9.22% |
| Broker/Dealer |
$XBD |
105.92 |
-0.33 |
-0.31% |
+12.28% |
| Retail |
$RLX |
705.22 |
+1.89 |
+0.27% |
+7.99% |
| Gold & Silver |
$XAU |
134.24 |
-2.99 |
-2.18% |
-18.94% |
| Bank |
$BKX |
53.98 |
-0.05 |
-0.09% |
+5.27% |
| Biotech |
$BTK |
1,702.36 |
+13.22 |
+0.78% |
+10.04% |
|
|
|
 |
Extending Gains After Holding Firm Ground
Kenneth J. Gruneisen - Passed the CAN SLIM® Master's Exam
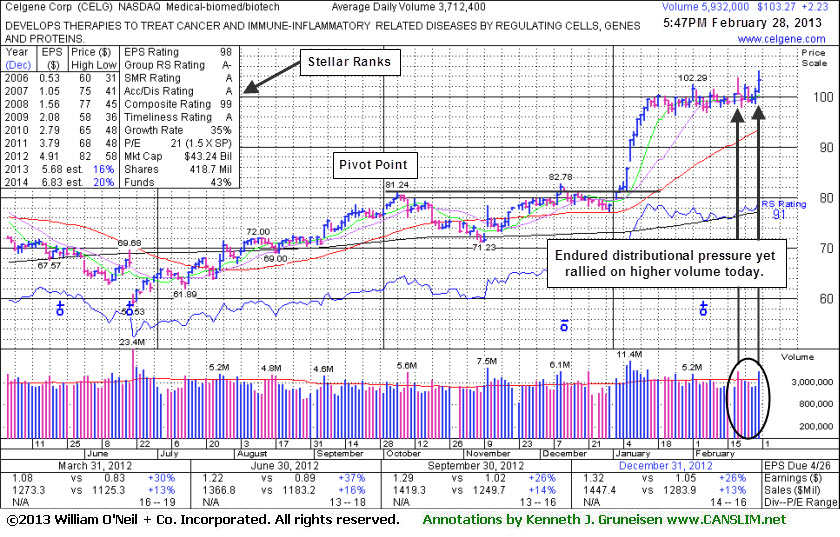
Celgene Corp (CELG +$2.23 or +2.21% to $103.27) held its ground in a tight range in recent weeks but did not form a sound base pattern before spiking to a new all-time high with today's volume-driven gain. Recent lows in the $96 area define near-term support above its 50-day moving average (DMA) line. The Medical -Biomed/Biotech firm's last appearance in this FSU section was on 2/04/13 with an annotated graph under the headline, "Extended From Prior Base Following Bullish Action."
Technically, it is very extended from its prior base. It has rewarded patient investors since they were reminded on 1/17/13 with an annotated graph under the headline, "Rule Suggests Letting Explosive Winners Have Time For Greater Gains", as it was noted - "Having quickly rallied more than +20% in the first 2-3 weeks after its technical breakout, the investment system rules suggest holding such explosive winners for a minimum of 8 weeks to allow for potentially greater gains. Disciplined investors never hold any stock if it fails badly however, or if it falls more than -7% from their purchase price."
CELG has maintained a strong earnings history (C and A criteria), and it recently reported earnings +26% on +13% sales revenues for the Dec '12 quarter. The number of top-rated funds owning its shares rose from 1,623 in Dec '11 to 1,733 in Dec '12, a reassuring trend concerning the I criteria. Its current Up/Down Volume Ratio of 1.4 also still offers an unbiased indication its shares have been under accumulation over the past 50 days. However, the company is already well-known by the institutional crowd.
|
|
|
Color Codes Explained :
Y - Better candidates highlighted by our
staff of experts.
G - Previously featured
in past reports as yellow but may no longer be buyable under the
guidelines.
***Last / Change / Volume data in this table is the closing quote data***
Symbol/Exchange
Company Name
Industry Group |
PRICE |
CHANGE
(%Change) |
Day High |
Volume
(% DAV)
(% 50 day avg vol) |
52 Wk Hi
% From Hi |
Featured
Date |
Price
Featured |
Pivot Featured |
|
Max Buy |
CELG
-
NASDAQ
Celgene Corp
DRUGS - Drug Manufacturers - Major
|
$103.27
|
+2.23
2.21% |
$105.14
|
6,017,129
162.08% of 50 DAV
50 DAV is 3,712,400
|
$103.69
-0.41%
|
12/11/2012
|
$82.24
|
PP = $81.34
|
|
MB = $85.41
|
 Most Recent Note - 2/28/2013 2:14:59 PM
G - Held its ground in a tight range in recent weeks but did not form a sound base pattern before spiking to a new all-time high with today's volume-driven gain. Recent lows in the $96 area define near-term support above its 50 DMA line.
>>> The latest Featured Stock Update with an annotated graph appeared on 2/28/2013. Click here.
View all notes |
Alert me of new notes |
CANSLIM.net Company Profile |
SEC |
Zacks Reports |
StockTalk |
News |
Chart |
Request a new note
C
A N
S L
I M


|
CFNL
-
NASDAQ
Cardinal Financial Corp
BANKING - Regional - Southeast Banks
|
$15.93
|
+0.18
1.14% |
$16.09
|
193,785
99.94% of 50 DAV
50 DAV is 193,900
|
$16.90
-5.74%
|
12/3/2012
|
$15.20
|
PP = $16.31
|
|
MB = $17.13
|
Most Recent Note - 2/26/2013 2:00:47 PM
G - Still sputtering below its 50 DMA line today. A prompt rebound above that short-term average is needed to help its outlook improve. Endured a loss on heavier volume on the prior session, raising more serious concerns.
>>> The latest Featured Stock Update with an annotated graph appeared on 2/21/2013. Click here.
View all notes |
Alert me of new notes |
CANSLIM.net Company Profile |
SEC |
Zacks Reports |
StockTalk |
News |
Chart |
Request a new note
C
A N
S L
I M
|
CMCSA
-
NASDAQ
Comcast Corp Cl A
MEDIA - CATV Systems
|
$39.79
|
-0.36
-0.90% |
$40.38
|
12,346,892
87.39% of 50 DAV
50 DAV is 14,127,900
|
$42.00
-5.26%
|
12/3/2012
|
$37.08
|
PP = $38.06
|
|
MB = $39.96
|
Most Recent Note - 2/26/2013 1:55:07 PM
G - Endured mild distributional pressure while recently consolidating near its 52-week high. Reported earnings +11% on +6% sales revenues for the Dec '12 quarter, below the +25% minimum earnings guideline (C criteria), raising fundamental concerns
>>> The latest Featured Stock Update with an annotated graph appeared on 2/19/2013. Click here.
View all notes |
Alert me of new notes |
CANSLIM.net Company Profile |
SEC |
Zacks Reports |
StockTalk |
News |
Chart |
Request a new note
C
A N
S L
I M
|
KORS
-
NYSE
Michael Kors Hldgs Ltd
RETAIL - Apparel Stores
|
$59.28
|
-0.18
-0.30% |
$60.37
|
5,628,707
104.10% of 50 DAV
50 DAV is 5,407,100
|
$65.10
-8.94%
|
1/23/2013
|
$54.98
|
PP = $58.72
|
|
MB = $61.66
|
Most Recent Note - 2/26/2013 2:04:43 PM
G - Rebounded from early losses today, halting its slide near prior highs in the $58 area. Tallied 3 losses on heavy volume in the span of the prior 4 sessions since completing another Secondary Offering 2/20/13 while perched near its all-time high.
>>> The latest Featured Stock Update with an annotated graph appeared on 2/7/2013. Click here.
View all notes |
Alert me of new notes |
CANSLIM.net Company Profile |
SEC |
Zacks Reports |
StockTalk |
News |
Chart |
Request a new note
C
A N
S L
I M
|
LNKD
-
NYSE
Linkedin Corp Class A
INTERNET - Internet Information Providers
|
$168.18
|
-0.37
-0.22% |
$169.67
|
2,846,871
126.88% of 50 DAV
50 DAV is 2,243,800
|
$169.85
-0.98%
|
2/8/2013
|
$147.04
|
PP = $127.55
|
|
MB = $133.93
|
Most Recent Note - 2/27/2013 12:48:55 PM
G - Considerable volume-driven gain today for another new all-time high, getting very extended from any sound base. Previously noted - "Disciplined investors may watch for secondary buy points or additional bases to possibly form and be noted in the weeks ahead."
>>> The latest Featured Stock Update with an annotated graph appeared on 2/8/2013. Click here.
View all notes |
Alert me of new notes |
CANSLIM.net Company Profile |
SEC |
Zacks Reports |
StockTalk |
News |
Chart |
Request a new note
C
A N
S L
I M
|
Symbol/Exchange
Company Name
Industry Group |
PRICE |
CHANGE
(%Change) |
Day High |
Volume
(% DAV)
(% 50 day avg vol) |
52 Wk Hi
% From Hi |
Featured
Date |
Price
Featured |
Pivot Featured |
|
Max Buy |
LOPE
-
NASDAQ
Grand Canyon Education
DIVERSIFIED SERVICES - Education and; Training Services
|
$23.95
|
-0.40
-1.64% |
$24.63
|
583,923
128.90% of 50 DAV
50 DAV is 453,000
|
$27.18
-11.88%
|
2/20/2013
|
$26.44
|
PP = $25.10
|
|
MB = $26.36
|
Most Recent Note - 2/26/2013 12:30:57 PM
G - Down considerably today, raising concerns while slumping below its 50 DMA line, and its color code is changed to green. It quickly negated its recent technical breakout.
>>> The latest Featured Stock Update with an annotated graph appeared on 2/20/2013. Click here.
View all notes |
Alert me of new notes |
CANSLIM.net Company Profile |
SEC |
Zacks Reports |
StockTalk |
News |
Chart |
Request a new note
C
A N
S L
I M
|
MIDD
-
NASDAQ
Middleby Corp
MANUFACTURING - Diversified Machinery
|
$149.31
|
+1.21
0.82% |
$150.49
|
129,516
135.90% of 50 DAV
50 DAV is 95,300
|
$154.74
-3.51%
|
10/8/2012
|
$118.46
|
PP = $122.67
|
|
MB = $128.80
|
Most Recent Note - 2/27/2013 12:51:03 PM
G - Rallied to a new all-time high today with a 2nd consecutive gain backed by above average volume. Fundamental concerns were recently noted and prior reports cautioned members that it is extended from any sound base. Its 50 DMA line defines important near-term chart support above prior highs in the $134-135 area.
>>> The latest Featured Stock Update with an annotated graph appeared on 2/25/2013. Click here.
View all notes |
Alert me of new notes |
CANSLIM.net Company Profile |
SEC |
Zacks Reports |
StockTalk |
News |
Chart |
Request a new note
C
A N
S L
I M
|
N
-
NYSE
Netsuite Inc
DIVERSIFIED SERVICES - Business/Management Services
|
$69.79
|
+0.57
0.82% |
$70.68
|
376,264
116.35% of 50 DAV
50 DAV is 323,400
|
$75.75
-7.87%
|
12/12/2012
|
$64.75
|
PP = $67.12
|
|
MB = $70.48
|
Most Recent Note - 2/26/2013 2:06:28 PM
G - Still quietly consolidating near its 50 DMA line. Damaging losses below that short-term average or the recent low ($65.31 on 2/13/13) may trigger technical sell signals. Concerns were raised following a worrisome "negative reversal" on 2/01/13 after initially gapping up for a new 52-week high, and recent notes have repeatedly cautioned - "Reported earnings +20% on +33% sales revenues for the Dec '12 quarter, below the +25% minimum earnings guideline (C criteria) raising fundamental concerns."
>>> The latest Featured Stock Update with an annotated graph appeared on 2/5/2013. Click here.
View all notes |
Alert me of new notes |
CANSLIM.net Company Profile |
SEC |
Zacks Reports |
StockTalk |
News |
Chart |
Request a new note
C
A N
S L
I M
|
NSR
-
NYSE
Neustar Inc
TELECOMMUNICATIONS - Diversified Communication Serv
|
$43.85
|
-0.21
-0.48% |
$44.20
|
347,834
75.67% of 50 DAV
50 DAV is 459,700
|
$47.24
-7.18%
|
12/11/2012
|
$41.85
|
PP = $41.41
|
|
MB = $43.48
|
Most Recent Note - 2/27/2013 6:26:34 PM
G - Holding is ground near its 50 DMA line after a damaging loss on 2/21/13 with heavy volume raised concerns and triggered a technical sell signal. See latest FSU analysis for more details and a new annotated graph.
>>> The latest Featured Stock Update with an annotated graph appeared on 2/27/2013. Click here.
View all notes |
Alert me of new notes |
CANSLIM.net Company Profile |
SEC |
Zacks Reports |
StockTalk |
News |
Chart |
Request a new note
C
A N
S L
I M
|
SFUN
-
NYSE
Soufun Hldgs Ltd Ads A
INTERNET - Internet Information Providers
|
$26.85
|
+0.18
0.67% |
$26.95
|
254,887
79.50% of 50 DAV
50 DAV is 320,600
|
$29.16
-7.92%
|
2/11/2013
|
$27.46
|
PP = $29.26
|
|
MB = $30.72
|
Most Recent Note - 2/27/2013 6:30:27 PM
Y - Rebounded back above its 50 DMA line today with a gain on higher volume and its color code is changed to yellow. It still needs to produce gains above its pivot point before buying efforts may be justified under the fact-based system. The market (M criteria) also needs to produce a follow-through day to confirm a new rally after recent weakness raised concerns.
>>> The latest Featured Stock Update with an annotated graph appeared on 2/11/2013. Click here.
View all notes |
Alert me of new notes |
CANSLIM.net Company Profile |
SEC |
Zacks Reports |
StockTalk |
News |
Chart |
Request a new note
C
A N
S L
I M
|
Symbol/Exchange
Company Name
Industry Group |
PRICE |
CHANGE
(%Change) |
Day High |
Volume
(% DAV)
(% 50 day avg vol) |
52 Wk Hi
% From Hi |
Featured
Date |
Price
Featured |
Pivot Featured |
|
Max Buy |
SLCA
-
NYSE
U S Silica Holdings Inc
CHEMICALS - Specialty Chemicals
|
$24.59
|
+0.62
2.59% |
$26.41
|
1,122,557
244.62% of 50 DAV
50 DAV is 458,900
|
$24.63
-0.16%
|
2/26/2013
|
$22.23
|
PP = $21.50
|
|
MB = $22.58
|
Most Recent Note - 2/28/2013 1:12:48 PM
G - Holding its ground after considerable volume-driven gains this week for new 52-week highs. Disciplined investors do not chase stocks extended from their prior base more than +5% above their pivot point or prior chart highs. See the latest FSU analysis for more details and an new annotated weekly graph.
>>> The latest Featured Stock Update with an annotated graph appeared on 2/26/2013. Click here.
View all notes |
Alert me of new notes |
CANSLIM.net Company Profile |
SEC |
Zacks Reports |
StockTalk |
News |
Chart |
Request a new note
C
A N
S L
I M
|
VRX
-
NYSE
Valeant Pharmaceuticals
DRUGS - Drug Manufacturers - Other
|
$67.46
|
+0.72
1.08% |
$67.67
|
1,176,547
87.72% of 50 DAV
50 DAV is 1,341,300
|
$67.98
-0.76%
|
12/20/2012
|
$60.24
|
PP = $61.21
|
|
MB = $64.27
|
Most Recent Note - 2/27/2013 6:33:42 PM
G - Rallied with higher volume to finish just -1.8% off its 52-week high today. The 50 DMA line and recent low ($64.05 on 2/21/13) define the next important support area to watch.
>>> The latest Featured Stock Update with an annotated graph appeared on 2/15/2013. Click here.
View all notes |
Alert me of new notes |
CANSLIM.net Company Profile |
SEC |
Zacks Reports |
StockTalk |
News |
Chart |
Request a new note
C
A N
S L
I M
|
|
|
|
THESE ARE NOT BUY RECOMMENDATIONS!
Comments contained in the body of this report are technical
opinions only. The material herein has been obtained
from sources believed to be reliable and accurate, however,
its accuracy and completeness cannot be guaranteed.
This site is not an investment advisor, hence it does
not endorse or recommend any securities or other investments.
Any recommendation contained in this report may not
be suitable for all investors and it is not to be deemed
an offer or solicitation on our part with respect to
the purchase or sale of any securities. All trademarks,
service marks and trade names appearing in this report
are the property of their respective owners, and are
likewise used for identification purposes only.
This report is a service available
only to active Paid Premium Members.
You may opt-out of receiving report notifications
at any time. Questions or comments may be submitted
by writing to Premium Membership Services 665 S.E. 10 Street, Suite 201 Deerfield Beach, FL 33441-5634 or by calling 1-800-965-8307
or 954-785-1121.
|
|
|

