You are not logged in.
This means you
CAN ONLY VIEW reports that were published prior to Monday, April 14, 2025.
You
MUST UPGRADE YOUR MEMBERSHIP if you want to see any current reports.
AFTER MARKET UPDATE - WEDNESDAY, FEBRUARY 27TH, 2013
Previous After Market Report Next After Market Report >>>
|
|
|
|
DOW |
+175.24 |
14,075.37 |
+1.26% |
|
Volume |
673,269,730 |
-13% |
|
Volume |
1,673,225,920 |
-6% |
|
NASDAQ |
+32.61 |
3,162.26 |
+1.04% |
|
Advancers |
2,313 |
74% |
|
Advancers |
1,648 |
64% |
|
S&P 500 |
+19.05 |
1,515.99 |
+1.27% |
|
Decliners |
704 |
23% |
|
Decliners |
814 |
32% |
|
Russell 2000 |
+9.87 |
909.92 |
+1.10% |
|
52 Wk Highs |
153 |
|
|
52 Wk Highs |
99 |
|
|
S&P 600 |
+5.59 |
509.26 |
+1.11% |
|
52 Wk Lows |
15 |
|
|
52 Wk Lows |
23 |
|
|
 |
Major Averages Posted Gains With Lighter Volume Again
Kenneth J. Gruneisen - Passed the CAN SLIM® Master's Exam
The Dow closed at a level not seen since 2007 as it again pulled within striking distance of an all-time high. Leadership improved on Wednesday as the major indices posted solid gains, however the volume totals behind the gains were reported lighter than the prior session on the NYSE and on the Nasdaq exchange, again indicating lackluster institutional buying demand. Breadth was positive as advancers led decliners by more than 3-1 on the NYSE and by nearly 3-1 on the Nasdaq exchange. New highs easily outnumbered new 52-week lows on the NYSE and on the Nasdaq exchange. There were 41 high-ranked companies from the CANSLIM.net Leaders List which hit new 52-week highs and appeared on the CANSLIM.net BreakOuts Page, up solidly from Tuesday's total of 12 stocks. There were gains for 11 of the 12 high-ranked companies currently included on the Featured Stocks Page.
The expansion in leadership was reassuring. Tuesday's new 52-week high totals were "thin" at 62 on the NYSE and 38 on the Nasdaq exchange, down drastically versus the totals reported in the 2/19/13 after-market report (read here) when there were 400 new 52-week highs on the NYSE and 240 new highs on the Nasdaq exchange. Any sustainable rally requires a healthy crop of companies hitting new 52-week highs, so it is always essential to see meaningful leadership (stocks hitting new 52-week highs).
Stocks rose on Wednesday, with major indexes posting their best daily gains since early January, as Federal Reserve Chairman Ben Bernanke remained steadfast in supporting the Fed's stimulus policy and data pointed to economic improvement.
Pending home sales jumped +4.5% in January, three times the rate of growth that had been expected. While orders for durable goods fell more than expected in January, non-defense capital goods orders excluding aircraft - a closely watched proxy for business spending plans - showed the biggest gain since December 2011.
In earnings news, Priceline.com (PCLN +2.57%) rallied after reporting adjusted earnings that beat expectations. TJX Cos Inc (TJX +2.47%) rose after the retail chain operator posted higher fourth-quarter results. Target Corp (TGT -1.45%) fell after offering a cautious outlook for consumer spending in 2013 following a weak holiday quarter.
First Solar Inc (FSLR -13.78%) tumbled after failing to give a full-year earnings and sales outlook, though it also swung to a quarterly profit. Groupon Inc (GRPN +7.79%) tallied a gain bit its shares traded substantially lower -25% after the bell after reporting its fourth-quarter results.
With 93 percent of the S&P 500 companies having reported results so far, 69.5% beat profit expectations, compared with a 62% average since 1994 and 65% over the past four quarters, according to Thomson Reuters data.
New buying efforts are to be avoided under the fact-based system since the market's (M criteria) weak action and damaging distribution was recognized as a correction earlier this week. Individual holdings should be watched closely while investors have a bias toward reducing market exposure until there is a new confirmed rally with a follow-through day noted.
Watch for an announcement via email concerning the next WEBCAST. The webcast will also be available via an updated link highlighted at the top of the Premium Member Homepage.
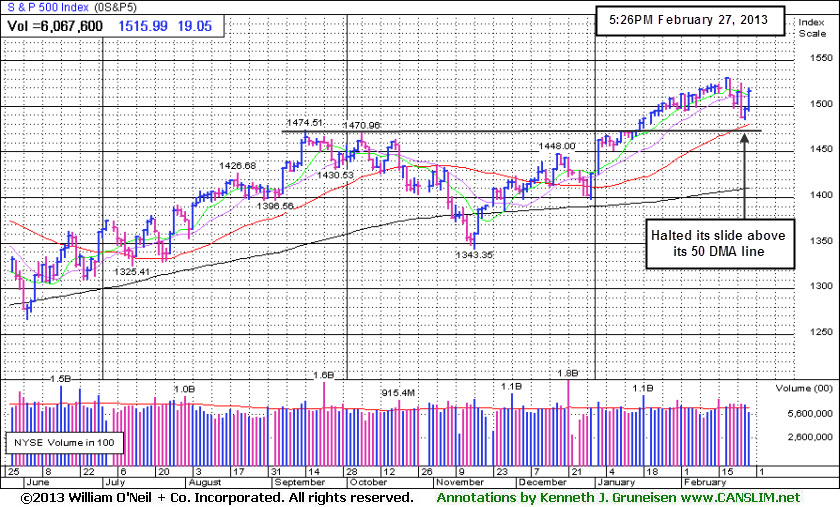
PICTURED: The market rebound from its worst decline since November put the S&P 500 Index back above 1,500. That closely watched level is more significant psychologically than it is chart-wise. Technically, it made a stand this week well above its prior highs and above its 50-day moving average (DMA) line. Further technical deterioration below the recent lows and the 50 DMA line would not bode well for the broader market outlook.
|
 Kenneth J. Gruneisen started out as a licensed stockbroker in August 1987, a couple of months prior to the historic stock market crash that took the Dow Jones Industrial Average down -22.6% in a single day. He has published daily fact-based fundamental and technical analysis on high-ranked stocks online for two decades. Through FACTBASEDINVESTING.COM, Kenneth provides educational articles, news, market commentary, and other information regarding proven investment systems that work in good times and bad.
Comments contained in the body of this report are technical opinions only and are not necessarily those of Gruneisen Growth Corp. The material herein has been obtained from sources believed to be reliable and accurate, however, its accuracy and completeness cannot be guaranteed. Our firm, employees, and customers may effect transactions, including transactions contrary to any recommendation herein, or have positions in the securities mentioned herein or options with respect thereto. Any recommendation contained in this report may not be suitable for all investors and it is not to be deemed an offer or solicitation on our part with respect to the purchase or sale of any securities. |
|
 |
Tech, Retail, Financial, and Energy Groups Gained
Kenneth J. Gruneisen - Passed the CAN SLIM® Master's Exam
The Gold & Silver Index ($XAU -1.78%) was a clear laggard as it lost ground. Meanwhile the Healthcare Index ($HMO +1.33%) rose and strength in energy-related shares boosted the Integrated Oil Index ($XOI +1.39%) and the Oil Services Index ($OSX +1.70%). The Retail Index ($RLX +1.57%) was a positive influence on the major averages along with gains in the financial groups which gave the Bank Index ($BKX +1.41%) and the Broker/Dealer Index ($XBD +0.88%) a lift. The tech sector saw unanimous gains from the Networking Index ($NWX +1.13%), Internet Index ($IIX +1.26%), Semiconductor Index ($SOX +1.56%), and the Biotechnology Index ($BTK +1.96%).
Charts courtesy www.stockcharts.com
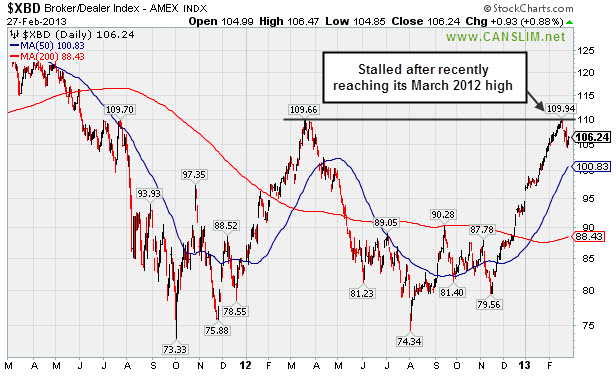
PICTURED: The Broker/Dealer Index ($XBD +0.88%) stalled after recently reaching its March 2012 high.
| Oil Services |
$OSX |
244.05 |
+4.08 |
+1.70% |
+10.85% |
| Healthcare |
$HMO |
2,694.07 |
+35.40 |
+1.33% |
+7.16% |
| Integrated Oil |
$XOI |
1,322.67 |
+18.13 |
+1.39% |
+6.51% |
| Semiconductor |
$SOX |
426.46 |
+6.57 |
+1.56% |
+11.04% |
| Networking |
$NWX |
236.12 |
+2.64 |
+1.13% |
+4.23% |
| Internet |
$IIX |
356.30 |
+4.44 |
+1.26% |
+8.96% |
| Broker/Dealer |
$XBD |
106.24 |
+0.93 |
+0.88% |
+12.63% |
| Retail |
$RLX |
703.33 |
+10.86 |
+1.57% |
+7.70% |
| Gold & Silver |
$XAU |
137.23 |
-2.48 |
-1.78% |
-17.13% |
| Bank |
$BKX |
54.03 |
+0.75 |
+1.41% |
+5.36% |
| Biotech |
$BTK |
1,689.14 |
+32.39 |
+1.96% |
+9.19% |
|
|
|
 |
Finding Support Near 50-Day Average After Recent Damaging Loss
Kenneth J. Gruneisen - Passed the CAN SLIM® Master's Exam
Neustar Inc (NSR +$0.05 or +0.11% to $44.06) is hovering near its 50-day moving average (DMA) line. It has been holding its ground near that important short-term average line since a damaging loss on 2/21/13 with heavy volume raised concerns and triggered a technical sell signal. More damaging losses below the recent lows would raise greater concerns and could lead to testing near its prior highs in the $41 area which define the next important support level.
It was last shown in this FSU section on 2/01/13 with an annotated graph under the headline, "Getting Extended After Volume-Driven Gains To New Highs". While rallying with above average volume behind its gains while we then cautioned members - "Disciplined investors know to avoid chasing extended stocks more than +5% above their pivot point, and they always sell if ever any stock falls more than -7% from their purchase price to properly manage risk under the fact-based system's guidelines."
Leadership from other high-ranked leaders in the Telecom - Infrastructure group is still a reassuring sign (concerning the L criteria). It has traded up as much as +12.9%since highlighted in yellow in the 12/11/12 mid-day report (read here) as it rose from a 10-week base. Quarterly comparisons through Dec '12 showed 4 consecutive increases of more than the +25% minimum earnings guideline (C criteria). The number of top-rated funds owning its shares rose from 400 in Mar '12 to 414 in Dec '12, a slightly reassuring trend concerning the I criteria. Its Return On Equity is reported at 29%, well above the 17% minimum guideline. Its small supply of 66 million shares (S criteria) outstanding can lead to greater price volatility if the institutional crowd rushes to accumulate shares, or if they decide to leave.

|
|
|
Color Codes Explained :
Y - Better candidates highlighted by our
staff of experts.
G - Previously featured
in past reports as yellow but may no longer be buyable under the
guidelines.
***Last / Change / Volume data in this table is the closing quote data***
Symbol/Exchange
Company Name
Industry Group |
PRICE |
CHANGE
(%Change) |
Day High |
Volume
(% DAV)
(% 50 day avg vol) |
52 Wk Hi
% From Hi |
Featured
Date |
Price
Featured |
Pivot Featured |
|
Max Buy |
CELG
-
NASDAQ
Celgene Corp
DRUGS - Drug Manufacturers - Major
|
$101.04
|
+1.59
1.60% |
$101.64
|
2,461,683
66.16% of 50 DAV
50 DAV is 3,720,600
|
$103.69
-2.56%
|
12/11/2012
|
$82.24
|
PP = $81.34
|
|
MB = $85.41
|
Most Recent Note - 2/26/2013 1:57:46 PM
G - Holding its ground near its all-time high after a "negative reversal" on 2/20/13. Its 50 DMA line (now $92.69) defines important support to watch on pullbacks.
>>> The latest Featured Stock Update with an annotated graph appeared on 2/4/2013. Click here.
View all notes |
Alert me of new notes |
CANSLIM.net Company Profile |
SEC |
Zacks Reports |
StockTalk |
News |
Chart |
Request a new note
C
A N
S L
I M


|
CFNL
-
NASDAQ
Cardinal Financial Corp
BANKING - Regional - Southeast Banks
|
$15.75
|
-0.07
-0.44% |
$15.86
|
183,440
95.69% of 50 DAV
50 DAV is 191,700
|
$16.90
-6.80%
|
12/3/2012
|
$15.20
|
PP = $16.31
|
|
MB = $17.13
|
Most Recent Note - 2/26/2013 2:00:47 PM
G - Still sputtering below its 50 DMA line today. A prompt rebound above that short-term average is needed to help its outlook improve. Endured a loss on heavier volume on the prior session, raising more serious concerns.
>>> The latest Featured Stock Update with an annotated graph appeared on 2/21/2013. Click here.
View all notes |
Alert me of new notes |
CANSLIM.net Company Profile |
SEC |
Zacks Reports |
StockTalk |
News |
Chart |
Request a new note
C
A N
S L
I M
|
CMCSA
-
NASDAQ
Comcast Corp Cl A
MEDIA - CATV Systems
|
$40.15
|
+0.46
1.16% |
$40.33
|
9,323,155
65.87% of 50 DAV
50 DAV is 14,154,600
|
$42.00
-4.40%
|
12/3/2012
|
$37.08
|
PP = $38.06
|
|
MB = $39.96
|
Most Recent Note - 2/26/2013 1:55:07 PM
G - Endured mild distributional pressure while recently consolidating near its 52-week high. Reported earnings +11% on +6% sales revenues for the Dec '12 quarter, below the +25% minimum earnings guideline (C criteria), raising fundamental concerns
>>> The latest Featured Stock Update with an annotated graph appeared on 2/19/2013. Click here.
View all notes |
Alert me of new notes |
CANSLIM.net Company Profile |
SEC |
Zacks Reports |
StockTalk |
News |
Chart |
Request a new note
C
A N
S L
I M
|
KORS
-
NYSE
Michael Kors Hldgs Ltd
RETAIL - Apparel Stores
|
$59.46
|
+0.22
0.37% |
$59.98
|
6,823,267
128.48% of 50 DAV
50 DAV is 5,310,900
|
$65.10
-8.66%
|
1/23/2013
|
$54.98
|
PP = $58.72
|
|
MB = $61.66
|
Most Recent Note - 2/26/2013 2:04:43 PM
G - Rebounded from early losses today, halting its slide near prior highs in the $58 area. Tallied 3 losses on heavy volume in the span of the prior 4 sessions since completing another Secondary Offering 2/20/13 while perched near its all-time high.
>>> The latest Featured Stock Update with an annotated graph appeared on 2/7/2013. Click here.
View all notes |
Alert me of new notes |
CANSLIM.net Company Profile |
SEC |
Zacks Reports |
StockTalk |
News |
Chart |
Request a new note
C
A N
S L
I M
|
LNKD
-
NYSE
Linkedin Corp Class A
INTERNET - Internet Information Providers
|
$168.55
|
+10.78
6.83% |
$169.85
|
4,313,018
197.84% of 50 DAV
50 DAV is 2,180,000
|
$165.20
2.03%
|
2/8/2013
|
$147.04
|
PP = $127.55
|
|
MB = $133.93
|
 Most Recent Note - 2/27/2013 12:48:55 PM
G - Considerable volume-driven gain today for another new all-time high, getting very extended from any sound base. Previously noted - "Disciplined investors may watch for secondary buy points or additional bases to possibly form and be noted in the weeks ahead."
>>> The latest Featured Stock Update with an annotated graph appeared on 2/8/2013. Click here.
View all notes |
Alert me of new notes |
CANSLIM.net Company Profile |
SEC |
Zacks Reports |
StockTalk |
News |
Chart |
Request a new note
C
A N
S L
I M
|
Symbol/Exchange
Company Name
Industry Group |
PRICE |
CHANGE
(%Change) |
Day High |
Volume
(% DAV)
(% 50 day avg vol) |
52 Wk Hi
% From Hi |
Featured
Date |
Price
Featured |
Pivot Featured |
|
Max Buy |
LOPE
-
NASDAQ
Grand Canyon Education
DIVERSIFIED SERVICES - Education and; Training Services
|
$24.35
|
+0.55
2.31% |
$24.76
|
455,105
100.33% of 50 DAV
50 DAV is 453,600
|
$27.18
-10.41%
|
2/20/2013
|
$26.44
|
PP = $25.10
|
|
MB = $26.36
|
Most Recent Note - 2/26/2013 12:30:57 PM
G - Down considerably today, raising concerns while slumping below its 50 DMA line, and its color code is changed to green. It quickly negated its recent technical breakout.
>>> The latest Featured Stock Update with an annotated graph appeared on 2/20/2013. Click here.
View all notes |
Alert me of new notes |
CANSLIM.net Company Profile |
SEC |
Zacks Reports |
StockTalk |
News |
Chart |
Request a new note
C
A N
S L
I M
|
MIDD
-
NASDAQ
Middleby Corp
MANUFACTURING - Diversified Machinery
|
$148.10
|
+3.22
2.22% |
$154.74
|
263,089
286.59% of 50 DAV
50 DAV is 91,800
|
$152.10
-2.63%
|
10/8/2012
|
$118.46
|
PP = $122.67
|
|
MB = $128.80
|
Most Recent Note - 2/27/2013 12:51:03 PM
G - Rallied to a new all-time high today with a 2nd consecutive gain backed by above average volume. Fundamental concerns were recently noted and prior reports cautioned members that it is extended from any sound base. Its 50 DMA line defines important near-term chart support above prior highs in the $134-135 area.
>>> The latest Featured Stock Update with an annotated graph appeared on 2/25/2013. Click here.
View all notes |
Alert me of new notes |
CANSLIM.net Company Profile |
SEC |
Zacks Reports |
StockTalk |
News |
Chart |
Request a new note
C
A N
S L
I M
|
N
-
NYSE
Netsuite Inc
DIVERSIFIED SERVICES - Business/Management Services
|
$69.22
|
+1.42
2.09% |
$69.82
|
323,772
99.59% of 50 DAV
50 DAV is 325,100
|
$75.75
-8.62%
|
12/12/2012
|
$64.75
|
PP = $67.12
|
|
MB = $70.48
|
Most Recent Note - 2/26/2013 2:06:28 PM
G - Still quietly consolidating near its 50 DMA line. Damaging losses below that short-term average or the recent low ($65.31 on 2/13/13) may trigger technical sell signals. Concerns were raised following a worrisome "negative reversal" on 2/01/13 after initially gapping up for a new 52-week high, and recent notes have repeatedly cautioned - "Reported earnings +20% on +33% sales revenues for the Dec '12 quarter, below the +25% minimum earnings guideline (C criteria) raising fundamental concerns."
>>> The latest Featured Stock Update with an annotated graph appeared on 2/5/2013. Click here.
View all notes |
Alert me of new notes |
CANSLIM.net Company Profile |
SEC |
Zacks Reports |
StockTalk |
News |
Chart |
Request a new note
C
A N
S L
I M
|
NSR
-
NYSE
Neustar Inc
TELECOMMUNICATIONS - Diversified Communication Serv
|
$44.06
|
+0.05
0.11% |
$44.24
|
439,624
96.07% of 50 DAV
50 DAV is 457,600
|
$47.24
-6.73%
|
12/11/2012
|
$41.85
|
PP = $41.41
|
|
MB = $43.48
|
Most Recent Note - 2/27/2013 6:26:34 PM
G - Holding is ground near its 50 DMA line after a damaging loss on 2/21/13 with heavy volume raised concerns and triggered a technical sell signal. See latest FSU analysis for more details and a new annotated graph.
>>> The latest Featured Stock Update with an annotated graph appeared on 2/1/2013. Click here.
View all notes |
Alert me of new notes |
CANSLIM.net Company Profile |
SEC |
Zacks Reports |
StockTalk |
News |
Chart |
Request a new note
C
A N
S L
I M
|
SFUN
-
NYSE
Soufun Hldgs Ltd Ads A
INTERNET - Internet Information Providers
|
$26.67
|
+0.71
2.73% |
$27.20
|
414,004
131.22% of 50 DAV
50 DAV is 315,500
|
$29.16
-8.54%
|
2/11/2013
|
$27.46
|
PP = $29.26
|
|
MB = $30.72
|
Most Recent Note - 2/27/2013 6:30:27 PM
Y - Rebounded back above its 50 DMA line today with a gain on higher volume and its color code is changed to yellow. It still needs to produce gains above its pivot point before buying efforts may be justified under the fact-based system. The market (M criteria) also needs to produce a follow-through day to confirm a new rally after recent weakness raised concerns.
>>> The latest Featured Stock Update with an annotated graph appeared on 2/11/2013. Click here.
View all notes |
Alert me of new notes |
CANSLIM.net Company Profile |
SEC |
Zacks Reports |
StockTalk |
News |
Chart |
Request a new note
C
A N
S L
I M
|
Symbol/Exchange
Company Name
Industry Group |
PRICE |
CHANGE
(%Change) |
Day High |
Volume
(% DAV)
(% 50 day avg vol) |
52 Wk Hi
% From Hi |
Featured
Date |
Price
Featured |
Pivot Featured |
|
Max Buy |
SLCA
-
NYSE
U S Silica Holdings Inc
CHEMICALS - Specialty Chemicals
|
$23.97
|
+2.35
10.87% |
$24.63
|
1,530,113
351.83% of 50 DAV
50 DAV is 434,900
|
$23.56
1.72%
|
2/26/2013
|
$22.23
|
PP = $21.50
|
|
MB = $22.58
|
Most Recent Note - 2/27/2013 1:01:21 PM
G - Considerable volume-driven gain today for a new 52-week high, trading well above it's "max buy" level. Color code is changed to green while quickly getting extended. Finished near the middle of its intra-day range and just above its pivot point with a volume-driven gain on the prior session after highlighted in yellow with pivot point based on its 2/11/13 high. See the latest FSU analysis for more details and an new annotated weekly graph.
>>> The latest Featured Stock Update with an annotated graph appeared on 2/26/2013. Click here.
View all notes |
Alert me of new notes |
CANSLIM.net Company Profile |
SEC |
Zacks Reports |
StockTalk |
News |
Chart |
Request a new note
C
A N
S L
I M
|
VRX
-
NYSE
Valeant Pharmaceuticals
DRUGS - Drug Manufacturers - Other
|
$66.74
|
+1.58
2.42% |
$67.19
|
1,174,151
87.17% of 50 DAV
50 DAV is 1,346,900
|
$67.98
-1.82%
|
12/20/2012
|
$60.24
|
PP = $61.21
|
|
MB = $64.27
|
Most Recent Note - 2/27/2013 6:33:42 PM
G - Rallied with higher volume to finish just -1.8% off its 52-week high today. The 50 DMA line and recent low ($64.05 on 2/21/13) define the next important support area to watch.
>>> The latest Featured Stock Update with an annotated graph appeared on 2/15/2013. Click here.
View all notes |
Alert me of new notes |
CANSLIM.net Company Profile |
SEC |
Zacks Reports |
StockTalk |
News |
Chart |
Request a new note
C
A N
S L
I M
|
|
|
|
THESE ARE NOT BUY RECOMMENDATIONS!
Comments contained in the body of this report are technical
opinions only. The material herein has been obtained
from sources believed to be reliable and accurate, however,
its accuracy and completeness cannot be guaranteed.
This site is not an investment advisor, hence it does
not endorse or recommend any securities or other investments.
Any recommendation contained in this report may not
be suitable for all investors and it is not to be deemed
an offer or solicitation on our part with respect to
the purchase or sale of any securities. All trademarks,
service marks and trade names appearing in this report
are the property of their respective owners, and are
likewise used for identification purposes only.
This report is a service available
only to active Paid Premium Members.
You may opt-out of receiving report notifications
at any time. Questions or comments may be submitted
by writing to Premium Membership Services 665 S.E. 10 Street, Suite 201 Deerfield Beach, FL 33441-5634 or by calling 1-800-965-8307
or 954-785-1121.
|
|
|

