***Last / Change / Volume data in this table is the closing quote data***
Symbol/Exchange
Company Name
Industry Group |
PRICE |
CHANGE
(%Change) |
Day High |
Volume
(% DAV)
(% 50 day avg vol) |
52 Wk Hi
% From Hi |
Featured
Date |
Price
Featured |
Pivot Featured |
|
Max Buy |
ADS
-
NYSE
Alliance Data Sys Corp
COMPUTER SOFTWARE and SERVICES - Information and Delivery Service
|
$122.08
|
+0.20
0.16% |
$122.53
|
391,701
55.50% of 50 DAV
50 DAV is 705,800
|
$122.62
-0.44%
|
1/17/2012
|
$108.24
|
PP = $107.43
|
|
MB = $112.80
|
Most Recent Note - 2/24/2012 3:58:41 PM
G - Inching higher on below average volume this week, wedging into new high territory. Its 50 DMA line defines support to watch on pullbacks while it is now extended from its latest base.
>>> The latest Featured Stock Update with an annotated graph appeared on 1/17/2012. Click here.
View all notes |
Alert me of new notes |
CANSLIM.net Company Profile |
SEC |
Zacks Reports |
StockTalk |
News |
Chart |
Request a new note
C
A N
S L
I M


|
ALXN
-
NASDAQ
Alexion Pharmaceuticals
DRUGS - Drug Manufacturers - Other
|
$83.76
|
-0.87
-1.03% |
$84.60
|
1,036,394
83.49% of 50 DAV
50 DAV is 1,241,400
|
$87.63
-4.42%
|
11/30/2011
|
$68.66
|
PP = $70.52
|
|
MB = $74.05
|
Most Recent Note - 2/24/2012 4:00:35 PM
G - After volume-driven gains for new all-time highs this week it is more extended from its prior base. Support to watch is its 50 DMA line.
>>> The latest Featured Stock Update with an annotated graph appeared on 2/24/2012. Click here.
View all notes |
Alert me of new notes |
CANSLIM.net Company Profile |
SEC |
Zacks Reports |
StockTalk |
News |
Chart |
Request a new note
C
A N
S L
I M
|
BODY
-
NASDAQ
Body Central Corp
RETAIL - Catalog andamp; Mail Order Houses
|
$28.84
|
-0.21
-0.72% |
$29.49
|
217,094
126.51% of 50 DAV
50 DAV is 171,600
|
$29.07
-0.79%
|
1/27/2012
|
$26.69
|
PP = $25.46
|
|
MB = $26.73
|
Most Recent Note - 2/24/2012 4:02:00 PM
G - Up today for a 3rd consecutive small gain with light volume, getting more extended from its prior base. Prior highs in the $25-26 area recently acted as support after encountering some distributional pressure.
>>> The latest Featured Stock Update with an annotated graph appeared on 1/27/2012. Click here.
View all notes |
Alert me of new notes |
CANSLIM.net Company Profile |
SEC |
Zacks Reports |
StockTalk |
News |
Chart |
Request a new note
C
A N
S L
I M
|
CATM
-
NASDAQ
Cardtronics Inc
DIVERSIFIED SERVICES - Business/Management Services
|
$26.96
|
-0.98
-3.51% |
$27.74
|
328,687
79.57% of 50 DAV
50 DAV is 413,100
|
$28.74
-6.19%
|
2/24/2012
|
$27.94
|
PP = $28.30
|
|
MB = $29.72
|
 Most Recent Note - 2/27/2012 5:26:39 PM
Y - Gapped down today for a damaging loss on light volume, finishing near the session low. Color code was changed to yellow with new pivot point cited based on its 1/19/12 high. Formed a "double bottom" base over the past 9 weeks during which it found prompt support at its 200 DMA line.
>>> The latest Featured Stock Update with an annotated graph appeared on 1/30/2012. Click here.
View all notes |
Alert me of new notes |
CANSLIM.net Company Profile |
SEC |
Zacks Reports |
StockTalk |
News |
Chart |
Request a new note
C
A N
S L
I M
|
CDNS
-
NASDAQ
Cadence Design Systems
COMPUTER SOFTWARE and SERVICES - Technical and System Software
|
$11.82
|
+0.01
0.08% |
$11.90
|
2,561,004
85.37% of 50 DAV
50 DAV is 3,000,000
|
$12.11
-2.39%
|
2/3/2012
|
$11.66
|
PP = $11.15
|
|
MB = $11.71
|
Most Recent Note - 2/24/2012 4:13:06 PM
G - Its Relative Strength rating has slumped to 81, near the minimum 80+ guideline. Recently making limited progress while churning above average volume, a sign of distributional pressure while no resistance remains due to overhead supply.
>>> The latest Featured Stock Update with an annotated graph appeared on 2/3/2012. Click here.
View all notes |
Alert me of new notes |
CANSLIM.net Company Profile |
SEC |
Zacks Reports |
StockTalk |
News |
Chart |
Request a new note
C
A N
S L
I M
|
Symbol/Exchange
Company Name
Industry Group |
PRICE |
CHANGE
(%Change) |
Day High |
Volume
(% DAV)
(% 50 day avg vol) |
52 Wk Hi
% From Hi |
Featured
Date |
Price
Featured |
Pivot Featured |
|
Max Buy |
CELG
-
NASDAQ
Celgene Corp
DRUGS - Drug Manufacturers - Major
|
$74.08
|
-0.81
-1.08% |
$74.53
|
2,687,344
81.75% of 50 DAV
50 DAV is 3,287,200
|
$76.09
-2.64%
|
2/2/2012
|
$74.16
|
PP = $75.21
|
|
MB = $78.97
|
Most Recent Note - 2/21/2012 1:52:48 PM
Y - Stalled and slumped below the pivot point after recently rising from an advanced "3-weeks tight" base pattern previously noted. Still perched within close striking distance of its all-time high ($77.39 in Aug '08). Its 50 DMA line defines initial support above its prior highs in the $68 area.
>>> The latest Featured Stock Update with an annotated graph appeared on 2/2/2012. Click here.
View all notes |
Alert me of new notes |
CANSLIM.net Company Profile |
SEC |
Zacks Reports |
StockTalk |
News |
Chart |
Request a new note
C
A N
S L
I M
|
ECHO
-
NASDAQ
Echo Global Logistics
DIVERSIFIED SERVICES - Business/Management Services
|
$18.70
|
-0.07
-0.37% |
$18.86
|
49,497
78.94% of 50 DAV
50 DAV is 62,700
|
$19.38
-3.51%
|
2/22/2012
|
$18.50
|
PP = $18.63
|
|
MB = $19.56
|
Most Recent Note - 2/24/2012 4:37:03 PM
Y - Volume totals have been cooling while forming a high handle following volume-driven gains from a large cup shaped base. See the latest FSU analysis for more details and a new annotated graph.
>>> The latest Featured Stock Update with an annotated graph appeared on 2/23/2012. Click here.
View all notes |
Alert me of new notes |
CANSLIM.net Company Profile |
SEC |
Zacks Reports |
StockTalk |
News |
Chart |
Request a new note
C
A N
S L
I M
|
FEIC
-
NASDAQ
F E I Co
ELECTRONICS - Diversified Electronics
|
$45.35
|
+0.95
2.14% |
$45.90
|
284,567
103.07% of 50 DAV
50 DAV is 276,100
|
$48.31
-6.13%
|
12/7/2011
|
$41.41
|
PP = $42.35
|
|
MB = $44.47
|
Most Recent Note - 2/27/2012 5:28:49 PM
G - Solid gain today on near average volume. Its 50 DMA line and prior highs in the $43 area recently acted as support, whereas violations may trigger technical sell signals. Reported earnings +21% on +14% sales revenues for the latest quarter ended December 31, 2011 versus the year ago period (below the +25% minimum guideline for earnings growth).
>>> The latest Featured Stock Update with an annotated graph appeared on 1/25/2012. Click here.
View all notes |
Alert me of new notes |
CANSLIM.net Company Profile |
SEC |
Zacks Reports |
StockTalk |
News |
Chart |
Request a new note
C
A N
S L
I M
|
GNC
-
NYSE
G N C Holdings Inc
RETAIL - Drug Stores
|
$32.73
|
+0.49
1.52% |
$33.20
|
700,127
65.81% of 50 DAV
50 DAV is 1,063,800
|
$33.70
-2.88%
|
1/19/2012
|
$28.99
|
PP = $29.60
|
|
MB = $31.08
|
Most Recent Note - 2/24/2012 3:50:59 PM
G - Pulling back on light volume today. Prior highs in the $29.50 area define support to watch on pullbacks.
>>> The latest Featured Stock Update with an annotated graph appeared on 1/19/2012. Click here.
View all notes |
Alert me of new notes |
CANSLIM.net Company Profile |
SEC |
Zacks Reports |
StockTalk |
News |
Chart |
Request a new note
C
A N
S L
I M
|
GOLD
-
NASDAQ
Randgold Resources Adr
METALS and MINING - Gold
|
$114.86
|
-0.87
-0.75% |
$116.11
|
291,037
57.31% of 50 DAV
50 DAV is 507,800
|
$120.73
-4.86%
|
2/7/2012
|
$116.21
|
PP = $120.83
|
|
MB = $126.87
|
Most Recent Note - 2/21/2012 1:55:28 PM
Y - Found support at its 50 DMA line as it formed a downward sloping "handle" with losses on light volume following the previously noted base pattern. Subsequent volume-driven gains into new high territory may trigger a technical buy signal.
>>> The latest Featured Stock Update with an annotated graph appeared on 2/8/2012. Click here.
View all notes |
Alert me of new notes |
CANSLIM.net Company Profile |
SEC |
Zacks Reports |
StockTalk |
News |
Chart |
Request a new note
C
A N
S L
I M
|
Symbol/Exchange
Company Name
Industry Group |
PRICE |
CHANGE
(%Change) |
Day High |
Volume
(% DAV)
(% 50 day avg vol) |
52 Wk Hi
% From Hi |
Featured
Date |
Price
Featured |
Pivot Featured |
|
Max Buy |
HLF
-
NYSE
Herbalife Ltd
DRUGS - Nutrition and Weight Management
|
$66.50
|
+0.05
0.08% |
$66.93
|
1,482,698
119.74% of 50 DAV
50 DAV is 1,238,300
|
$67.40
-1.34%
|
2/22/2012
|
$65.90
|
PP = $63.50
|
|
MB = $66.68
|
Most Recent Note - 2/22/2012 7:45:08 PM
Y - Gapped up today and triggered a technical buy signal with a considerable volume-driven gain for a new 52-week high (N criteria). Reported earnings +25% on +20% sales revenues for the quarter ended December 31, 2011 versus the year ago period. Ownership by top-rated funds rose from 560 in Jun '11 to 627 in Dec '11, a reassuring trend concerning institutional interest (I criteria). See the latest FSU analysis for more details and a new annotated graph.
>>> The latest Featured Stock Update with an annotated graph appeared on 2/22/2012. Click here.
View all notes |
Alert me of new notes |
CANSLIM.net Company Profile |
SEC |
Zacks Reports |
StockTalk |
News |
Chart |
Request a new note
C
A N
S L
I M
|
HMSY
-
NASDAQ
H M S Holdings Corp
COMPUTER SOFTWARE and SERVICES - Healthcare Information Service
|
$33.05
|
-0.45
-1.34% |
$33.57
|
1,172,898
127.93% of 50 DAV
50 DAV is 916,800
|
$34.98
-5.51%
|
10/27/2011
|
$26.44
|
PP = $28.37
|
|
MB = $29.79
|
Most Recent Note - 2/21/2012 1:56:58 PM
G - Reported earnings +29% on +14% sales revenues for the quarter ended Dec 31,2011 versus the year ago period. Down today, and further deterioration below its 50 DMA line would raise more serious concerns.
>>> The latest Featured Stock Update with an annotated graph appeared on 2/9/2012. Click here.
View all notes |
Alert me of new notes |
CANSLIM.net Company Profile |
SEC |
Zacks Reports |
StockTalk |
News |
Chart |
Request a new note
C
A N
S L
I M
|
ISRG
-
NASDAQ
Intuitive Surgical Inc
HEALTH SERVICES - Medical Appliances and Equipment
|
$514.24
|
+1.48
0.29% |
$518.47
|
282,398
76.08% of 50 DAV
50 DAV is 371,200
|
$515.61
-0.27%
|
12/20/2011
|
$442.43
|
PP = $449.16
|
|
MB = $471.62
|
Most Recent Note - 2/21/2012 2:04:36 PM
G - Perched near its all-time high, stubbornly holding its ground extended from prior highs in the $475 area that define support to watch on pullbacks. Reported earnings +24% on +28% sales revenues for the quarter ended December 31, 2011 versus the year ago period.
>>> The latest Featured Stock Update with an annotated graph appeared on 1/18/2012. Click here.
View all notes |
Alert me of new notes |
CANSLIM.net Company Profile |
SEC |
Zacks Reports |
StockTalk |
News |
Chart |
Request a new note
C
A N
S L
I M
|
LULU
-
NASDAQ
Lululemon Athletica
MANUFACTURING - Textile Manufacturing
|
$67.35
|
+0.76
1.14% |
$67.56
|
1,308,649
52.03% of 50 DAV
50 DAV is 2,515,000
|
$67.57
-0.33%
|
1/10/2012
|
$60.97
|
PP = $59.46
|
|
MB = $62.43
|
Most Recent Note - 2/21/2012 7:24:55 PM
G - Hovering near its all-time high, stubbornly holding its ground with cooling volume totals in recent weeks suggesting that very few are exiting. See the latest FSU analysis for more details and a new annotated weekly graph.
>>> The latest Featured Stock Update with an annotated graph appeared on 2/21/2012. Click here.
View all notes |
Alert me of new notes |
CANSLIM.net Company Profile |
SEC |
Zacks Reports |
StockTalk |
News |
Chart |
Request a new note
C
A N
S L
I M
|
MA
-
NYSE
Mastercard Inc Cl A
DIVERSIFIED SERVICES - Business/Management Services
|
$421.40
|
+5.79
1.39% |
$422.08
|
873,607
79.53% of 50 DAV
50 DAV is 1,098,400
|
$418.76
0.63%
|
2/2/2012
|
$379.05
|
PP = $381.32
|
|
MB = $400.39
|
Most Recent Note - 2/22/2012 4:18:01 PM
G - Quietly rose to a new all-time high today and rallied beyond its "max buy" level. Color code is changed to green while getting extended from its prior highs. See the latest FSU analysis for more details and a new annotated graph.
>>> The latest Featured Stock Update with an annotated graph appeared on 2/17/2012. Click here.
View all notes |
Alert me of new notes |
CANSLIM.net Company Profile |
SEC |
Zacks Reports |
StockTalk |
News |
Chart |
Request a new note
C
A N
S L
I M
|
Symbol/Exchange
Company Name
Industry Group |
PRICE |
CHANGE
(%Change) |
Day High |
Volume
(% DAV)
(% 50 day avg vol) |
52 Wk Hi
% From Hi |
Featured
Date |
Price
Featured |
Pivot Featured |
|
Max Buy |
MELI
-
NASDAQ
Mercadolibre Inc
INTERNET - Internet Software and; Services
|
$102.75
|
+4.03
4.08% |
$104.50
|
864,381
167.58% of 50 DAV
50 DAV is 515,800
|
$101.88
0.85%
|
2/6/2012
|
$97.09
|
PP = $95.58
|
|
MB = $100.36
|
Most Recent Note - 2/27/2012 1:10:55 PM
G - Considerable gain today with above average volume helped it rally to a new all-time high above its "max buy" level. Color code is changed to green after getting extended from its prior base. Reported earnings +31% on +39% sales revenues for the quarter ended December 31, 2011 versus the year ago period.
>>> The latest Featured Stock Update with an annotated graph appeared on 2/6/2012. Click here.
View all notes |
Alert me of new notes |
CANSLIM.net Company Profile |
SEC |
Zacks Reports |
StockTalk |
News |
Chart |
Request a new note
C
A N
S L
I M
|
MKTX
-
NASDAQ
Marketaxess Holdings Inc
FINANCIAL SERVICES - Investment Brokerage - Nationa
|
$33.45
|
+0.38
1.15% |
$33.53
|
183,443
75.87% of 50 DAV
50 DAV is 241,800
|
$35.42
-5.56%
|
10/28/2011
|
$29.79
|
PP = $31.05
|
|
MB = $32.60
|
Most Recent Note - 2/24/2012 12:38:26 PM
G - Consolidating near its all-time high, extended from any sound base. Found prompt support near its 50 DMA line after it completed a Secondary Offering of 3.6 million shares of common stock by selling stockholders on 2/22/12.
>>> The latest Featured Stock Update with an annotated graph appeared on 1/24/2012. Click here.
View all notes |
Alert me of new notes |
CANSLIM.net Company Profile |
SEC |
Zacks Reports |
StockTalk |
News |
Chart |
Request a new note
C
A N
S L
I M
|
RAX
-
NYSE
Rackspace Hosting Inc
INTERNET - Internet Software and; Services
|
$53.38
|
-0.10
-0.19% |
$54.24
|
1,411,952
71.40% of 50 DAV
50 DAV is 1,977,500
|
$56.94
-6.25%
|
2/2/2012
|
$46.69
|
PP = $45.55
|
|
MB = $47.83
|
Most Recent Note - 2/22/2012 4:08:16 PM
G - Up today with below average volume, still consolidating following a considerable 2/14/12 gap up gain with very heavy volume following strong earnings news. Now it is too extended from the previous base to be considered an ideal buy candidate under the fact-based investment system's guidelines.
>>> The latest Featured Stock Update with an annotated graph appeared on 2/16/2012. Click here.
View all notes |
Alert me of new notes |
CANSLIM.net Company Profile |
SEC |
Zacks Reports |
StockTalk |
News |
Chart |
Request a new note
C
A N
S L
I M
|
RRTS
-
NYSE
Roadrunner Trans Systems
TRANSPORTATION - Air Delivery and Freight Service
|
$17.76
|
-0.15
-0.84% |
$18.04
|
183,511
132.59% of 50 DAV
50 DAV is 138,400
|
$18.44
-3.69%
|
2/10/2012
|
$17.40
|
PP = $17.50
|
|
MB = $18.38
|
Most Recent Note - 2/27/2012 12:52:31 PM
Y - Hovering within close striking distance of its 52-week high, stubbornly holding its ground. Prior highs in the $17 area define initial support to watch on pullbacks.
>>> The latest Featured Stock Update with an annotated graph appeared on 2/13/2012. Click here.
View all notes |
Alert me of new notes |
CANSLIM.net Company Profile |
SEC |
Zacks Reports |
StockTalk |
News |
Chart |
Request a new note
C
A N
S L
I M
|
SWI
-
NYSE
Solarwinds Inc
COMPUTER SOFTWARE and SERVICES - Application Software
|
$38.45
|
-0.42
-1.08% |
$39.01
|
687,127
58.21% of 50 DAV
50 DAV is 1,180,500
|
$39.75
-3.27%
|
1/26/2012
|
$32.36
|
PP = $33.78
|
|
MB = $35.47
|
Most Recent Note - 2/23/2012 6:27:18 PM
G - Hit another new all-time high today with a gain on light volume, getting more extended from its latest base. Earnings below the +25% guideline for the Dec '11 quarter raised fundamental concerns.
>>> The latest Featured Stock Update with an annotated graph appeared on 1/26/2012. Click here.
View all notes |
Alert me of new notes |
CANSLIM.net Company Profile |
SEC |
Zacks Reports |
StockTalk |
News |
Chart |
Request a new note
C
A N
S L
I M
|
Symbol/Exchange
Company Name
Industry Group |
PRICE |
CHANGE
(%Change) |
Day High |
Volume
(% DAV)
(% 50 day avg vol) |
52 Wk Hi
% From Hi |
Featured
Date |
Price
Featured |
Pivot Featured |
|
Max Buy |
SXCI
-
NASDAQ
S X C Health Solutions
COMPUTER SOFTWARE and SERVICES - Healthcare Information Service
|
$71.27
|
+0.28
0.39% |
$72.34
|
517,665
143.32% of 50 DAV
50 DAV is 361,200
|
$71.25
0.03%
|
2/23/2012
|
$68.24
|
PP = $66.05
|
|
MB = $69.35
|
Most Recent Note - 2/24/2012 3:56:17 PM
G - Color code is changed to green after getting extended beyond its "max buy" level with 4 consecutive volume-driven gains. Prior highs in the $66 area define support to watch on pullbacks.
>>> The latest Featured Stock Update with an annotated graph appeared on 1/20/2012. Click here.
View all notes |
Alert me of new notes |
CANSLIM.net Company Profile |
SEC |
Zacks Reports |
StockTalk |
News |
Chart |
Request a new note
C
A N
S L
I M
|
TDG
-
NYSE
Transdigm Group Inc
AEROSPACE/DEFENSE - Aerospace/Defense Products and; Services
|
$117.52
|
+0.45
0.38% |
$121.48
|
293,259
83.03% of 50 DAV
50 DAV is 353,200
|
$119.41
-1.58%
|
1/10/2012
|
$98.83
|
PP = $102.83
|
|
MB = $107.97
|
Most Recent Note - 2/24/2012 12:57:45 PM
G - Still hovering near its all-time high, stubbornly holding its ground, on the cusp of completing an advanced "3-weeks tight" base pattern. Prior highs near $102 define the initial support level to watch above its 50 DMA line.
>>> The latest Featured Stock Update with an annotated graph appeared on 2/10/2012. Click here.
View all notes |
Alert me of new notes |
CANSLIM.net Company Profile |
SEC |
Zacks Reports |
StockTalk |
News |
Chart |
Request a new note
C
A N
S L
I M
|
TNGO
-
NASDAQ
Tangoe Inc
COMPUTER SOFTWARE and SERVICES - Technical and System Software
|
$19.36
|
-0.31
-1.58% |
$19.60
|
407,754
133.60% of 50 DAV
50 DAV is 305,200
|
$19.90
-2.71%
|
2/13/2012
|
$15.39
|
PP = $16.51
|
|
MB = $17.34
|
Most Recent Note - 2/24/2012 3:40:27 PM
G - Getting more extended from its prior base, and above average volume is behind today's 4th consecutive gain. Prior highs in the $16 area define initial support to watch on pullbacks.
>>> The latest Featured Stock Update with an annotated graph appeared on 2/14/2012. Click here.
View all notes |
Alert me of new notes |
CANSLIM.net Company Profile |
SEC |
Zacks Reports |
StockTalk |
News |
Chart |
Request a new note
C
A N
S L
I M
|
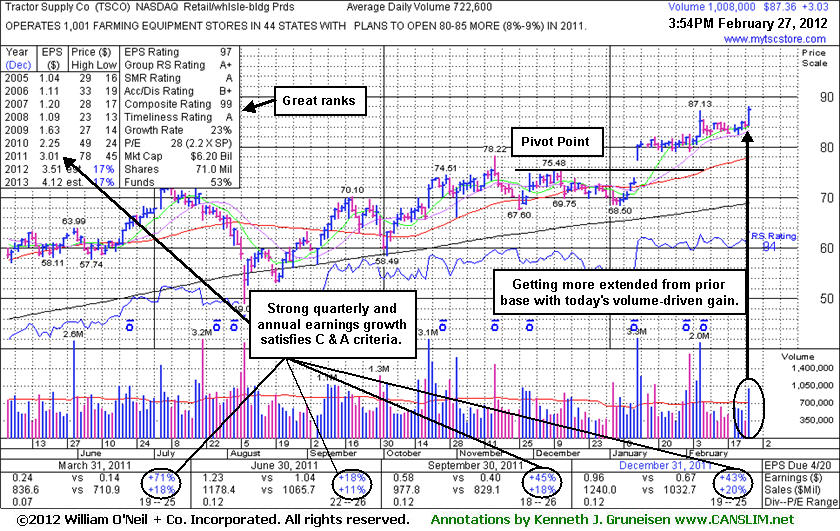
TSCO
-
NASDAQ
Tractor Supply Co
SPECIALTY RETAIL - Specialty Retail, Other
|
$87.42
|
+3.09
3.66% |
$87.97
|
1,141,853
158.02% of 50 DAV
50 DAV is 722,600
|
$87.13
0.33%
|
1/12/2012
|
$79.12
|
PP = $75.58
|
|
MB = $79.36
|
Most Recent Note - 2/27/2012 5:24:59 PM
G - Up today with +58% above average volume for a new all-time high. Its 50 DMA line defines support to watch on pullbacks. See the latest FSU analysis for more details and a new annotated graph.
>>> The latest Featured Stock Update with an annotated graph appeared on 2/27/2012. Click here.
View all notes |
Alert me of new notes |
CANSLIM.net Company Profile |
SEC |
Zacks Reports |
StockTalk |
News |
Chart |
Request a new note
C
A N
S L
I M
|
UA
-
NYSE
Under Armour Inc Cl A
CONSUMER NON-DURABLES - Textile - Apparel Clothing
|
$87.16
|
+1.33
1.55% |
$87.77
|
1,446,714
115.06% of 50 DAV
50 DAV is 1,257,400
|
$87.40
-0.27%
|
2/15/2012
|
$85.77
|
PP = $84.86
|
|
MB = $89.10
|
Most Recent Note - 2/24/2012 3:46:01 PM
Y - Gapped up today and rallied above its pivot point, however volume is not running at a pace substantially above average. A minimum of +40% above average volume is sufficient volume behind a gain to trigger a proper technical buy signal, and heavier volume is considered a true sign of institutional positioning, otherwise a sustained and meaningful advance in price is less likely.
>>> The latest Featured Stock Update with an annotated graph appeared on 2/15/2012. Click here.
View all notes |
Alert me of new notes |
CANSLIM.net Company Profile |
SEC |
Zacks Reports |
StockTalk |
News |
Chart |
Request a new note
C
A N
S L
I M
|
Symbol/Exchange
Company Name
Industry Group |
PRICE |
CHANGE
(%Change) |
Day High |
Volume
(% DAV)
(% 50 day avg vol) |
52 Wk Hi
% From Hi |
Featured
Date |
Price
Featured |
Pivot Featured |
|
Max Buy |
UBNT
-
NASDAQ
Ubiquiti Networks Inc
TELECOMMUNICATIONS - Diversified Communication Serv
|
$28.61
|
+1.27
4.65% |
$28.68
|
420,532
140.46% of 50 DAV
50 DAV is 299,400
|
$27.70
3.30%
|
1/27/2012
|
$22.25
|
PP = $23.14
|
|
MB = $24.30
|
Most Recent Note - 2/27/2012 1:14:27 PM
G - Hitting another new high today, on track for a 4th consecutive gain. It is too extended from its prior base to be considered buyable under the investment system's guidelines, and patient investors may watch for secondary buy points to possibly develop and be noted.
>>> The latest Featured Stock Update with an annotated graph appeared on 2/1/2012. Click here.
View all notes |
Alert me of new notes |
CANSLIM.net Company Profile |
SEC |
Zacks Reports |
StockTalk |
News |
Chart |
Request a new note
C
A N
S L
I M
|
ULTA
-
NASDAQ
Ulta Salon Cosm & Frag
SPECIALTY RETAIL - Specialty Retail, Other
|
$83.81
|
+1.87
2.28% |
$84.11
|
460,039
60.56% of 50 DAV
50 DAV is 759,700
|
$84.48
-0.79%
|
1/11/2012
|
$71.97
|
PP = $75.80
|
|
MB = $79.59
|
Most Recent Note - 2/27/2012 5:30:07 PM
G - Posted a gain today with light volume. It has been quietly hovering near its all-time high, extended from any sound base pattern. Prior highs near $75 define initial chart support above its 50 DMA line.
>>> The latest Featured Stock Update with an annotated graph appeared on 1/11/2012. Click here.
View all notes |
Alert me of new notes |
CANSLIM.net Company Profile |
SEC |
Zacks Reports |
StockTalk |
News |
Chart |
Request a new note
C
A N
S L
I M
|
V
-
NYSE
Visa Inc Cl A
DIVERSIFIED SERVICES - Business/Management Services
|
$116.86
|
-0.68
-0.58% |
$117.30
|
3,946,944
96.64% of 50 DAV
50 DAV is 4,084,200
|
$117.77
-0.77%
|
2/2/2012
|
$105.43
|
PP = $104.30
|
|
MB = $109.52
|
Most Recent Note - 2/24/2012 3:53:40 PM
G - Inching to new high territory this week with below average volume conviction behind its gains. Prior highs in the $103-104 area define initial support to watch on pullbacks.
>>> The latest Featured Stock Update with an annotated graph appeared on 1/23/2012. Click here.
View all notes |
Alert me of new notes |
CANSLIM.net Company Profile |
SEC |
Zacks Reports |
StockTalk |
News |
Chart |
Request a new note
C
A N
S L
I M
|