You are not logged in.
This means you
CAN ONLY VIEW reports that were published prior to Monday, April 14, 2025.
You
MUST UPGRADE YOUR MEMBERSHIP if you want to see any current reports.
AFTER MARKET UPDATE - TUESDAY, FEBRUARY 26TH, 2013
Previous After Market Report Next After Market Report >>>
|
|
|
|
DOW |
+115.96 |
13,900.13 |
+0.84% |
|
Volume |
772,085,800 |
-6% |
|
Volume |
1,780,588,210 |
-4% |
|
NASDAQ |
+13.40 |
3,129.65 |
+0.43% |
|
Advancers |
1,989 |
64% |
|
Advancers |
1,488 |
58% |
|
S&P 500 |
+9.09 |
1,496.94 |
+0.61% |
|
Decliners |
1,007 |
32% |
|
Decliners |
971 |
38% |
|
Russell 2000 |
+4.21 |
900.05 |
+0.47% |
|
52 Wk Highs |
62 |
|
|
52 Wk Highs |
38 |
|
|
S&P 600 |
+2.33 |
503.67 |
+0.46% |
|
52 Wk Lows |
31 |
|
|
52 Wk Lows |
27 |
|
|
 |
Major Averages Rise With Lighter Volume and Little Leadership
Kenneth J. Gruneisen - Passed the CAN SLIM® Master's Exam
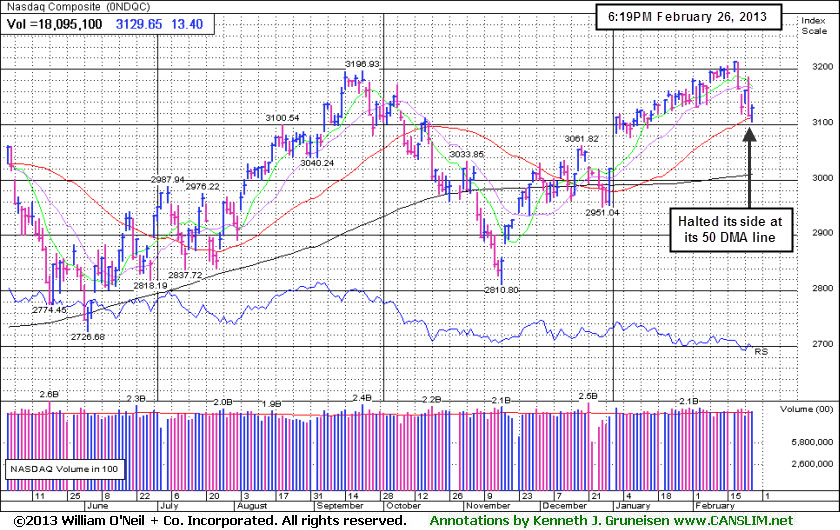
The major averages tallied gains on Tuesday but leadership was thin. All of the major indices rose, however the volume totals reported were lighter than the prior session on the NYSE and on the Nasdaq exchange indicating lackluster institutional buying. Breadth was positive as advancers led decliners by 2-1 on the NYSE and 3-2 on the Nasdaq exchange. New highs have still outnumbered new 52-week lows on the NYSE and on the Nasdaq exchange, however - the total number of stocks hitting new 52-week highs has waned considerably in past week as the market's rally abruptly ended. Only 12 high-ranked companies from the CANSLIM.net Leaders List hit new 52-week highs and appeared on the CANSLIM.net BreakOuts Page, down from Monday's total of 43 stocks. Any sustainable rally requires a healthy crop of companies hitting new 52-week highs, so it is essential to see meaningful leadership continue. There were gains from 10 of the 12 high-ranked companies currently included on the Featured Stocks Page.
U.S. stocks rebounded after Federal Reserve Chairman Ben Bernanke defended the Fed's bond-buying stimulus and sales of new homes hit a 4 1/2-year high. In testimony on Tuesday before the Senate Banking Committee, Bernanke quieted rumblings that the central bank may pull back from its stimulative policy measures, Concerns were sparked by the release of the Fed minutes last week.
Gains in homebuilders and other consumer stocks, following strong economic data, lifted the S&P 500 Index. Home Depot Inc (HD +5.69%) tallied a big gain which boosted the Dow industrials.
The market's (M criteria) weak action and damaging distribution has been recognized as a "correction" which means that odds are not considered favorable for new buying efforts under the fact-based system. Individual holdings should be watched closely while investors have a bias toward reducing market exposure until there is a new confirmed rally with a follow-through day noted.
Watch for an announcement via email concerning the next WEBCAST. The webcast will also be available via an updated link highlighted at the top of the Premium Member Homepage.
PICTURED: The Nasdaq Composite Index made a stand at its 50-day movig average (DMA) line with Tuesday's gain. Further technical deteriration would not bode well for the broader market outlook.
|
 Kenneth J. Gruneisen started out as a licensed stockbroker in August 1987, a couple of months prior to the historic stock market crash that took the Dow Jones Industrial Average down -22.6% in a single day. He has published daily fact-based fundamental and technical analysis on high-ranked stocks online for two decades. Through FACTBASEDINVESTING.COM, Kenneth provides educational articles, news, market commentary, and other information regarding proven investment systems that work in good times and bad.
Comments contained in the body of this report are technical opinions only and are not necessarily those of Gruneisen Growth Corp. The material herein has been obtained from sources believed to be reliable and accurate, however, its accuracy and completeness cannot be guaranteed. Our firm, employees, and customers may effect transactions, including transactions contrary to any recommendation herein, or have positions in the securities mentioned herein or options with respect thereto. Any recommendation contained in this report may not be suitable for all investors and it is not to be deemed an offer or solicitation on our part with respect to the purchase or sale of any securities. |
|
 |
Retail, Financial, Tech, and Commodity-Linked Groups Rose
Kenneth J. Gruneisen - Passed the CAN SLIM® Master's Exam
The Healthcare Index ($HMO -0.44%) was a laggard group as it lost ground on Tuesday. The Retail Index ($RLX +1.48%) was a standout gainer. Financial shares also had a slightly positive bias as the Bank Index ($BKX +0.49%) and the Broker/Dealer Index ($XBD +0.65%) edged higher. Commodity-linked groups rose, led by the Gold & Silver Index ($XAU +1.20%) while the Integrated Oil Index ($XOI +0.57%) and the Oil Services Index ($OSX +0.96%) followed with modest gains. The Networking Index ($NWX -0.08%) and Internet Index ($IIX +0.17%) ended virtually unchanged while the Biotechnology Index ($BTK +0.43%) and Semiconductor Index ($SOX +0.78%) rounded out the mostly positive session with small gains.
Charts courtesy www.stockcharts.com
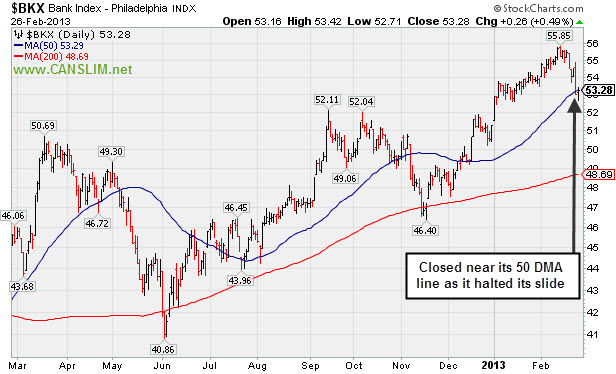
PICTURED: The Bank Index ($BKX +0.49%) closed near its 50-day moving average (DMA) line as it halted its slide.
| Oil Services |
$OSX |
239.97 |
+2.28 |
+0.96% |
+9.00% |
| Healthcare |
$HMO |
2,658.67 |
-11.70 |
-0.44% |
+5.75% |
| Integrated Oil |
$XOI |
1,304.54 |
+7.39 |
+0.57% |
+5.05% |
| Semiconductor |
$SOX |
419.89 |
+3.23 |
+0.78% |
+9.33% |
| Networking |
$NWX |
233.48 |
-0.20 |
-0.08% |
+3.06% |
| Internet |
$IIX |
351.86 |
+0.58 |
+0.17% |
+7.60% |
| Broker/Dealer |
$XBD |
105.31 |
+0.68 |
+0.65% |
+11.64% |
| Retail |
$RLX |
692.47 |
+10.10 |
+1.48% |
+6.03% |
| Gold & Silver |
$XAU |
139.71 |
+1.66 |
+1.20% |
-15.63% |
| Bank |
$BKX |
53.28 |
+0.26 |
+0.49% |
+3.90% |
| Biotech |
$BTK |
1,656.75 |
+7.08 |
+0.43% |
+7.09% |
|
|
|
 |
Broader Market May Hurt Outlier's Chances After Breakout
Kenneth J. Gruneisen - Passed the CAN SLIM® Master's Exam
Often, when a leading stock is breaking out of a solid base it is highlighted in CANSLIM.net's Mid-Day Breakouts Report. The most relevant factors are noted in the report which alerts prudent CANSLIM oriented investors. After doing any necessary backup research, the investor is prepared to act. Disciplined investors know to buy as near as possible to the pivot point and avoid chasing stocks after they have rallied more than +5% above their pivot point. It is crucial to always limit losses whenever any stock heads the wrong direction, and disciplined investors sell if a struggling stock ever falls more than -7% from their purchase price.
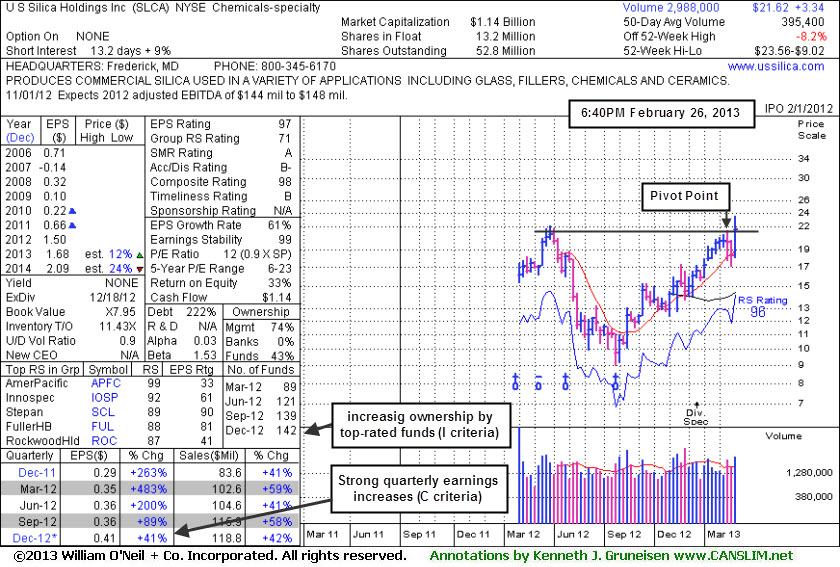
U S Silica Holdings Inc (SLCA +$3.27 or +17.82% to $21.62) was highlighted in yellow with pivot point based on its 2/11/13 high in the earlier mid-day report (read here). It reported strong sales revenues and earnings growth in the most current quarterly (C criteria) comparisons through Dec '12. It gapped up from near its 50-day moving average (DMA) line with a considerable volume-driven gain for a new 52-week high.
Disciplined investors may note, however, that the weakness in the broader market (M criteria) is an overriding concern which hurts the chances for most stocks until a new confirmed rally. Pay extra attention to the bold portion of the daily market commentary for ongoing analysis on market conditions as the changing stance impacts what followers of the fact-based investment system must do. Three out of four stocks tend to follow the direction of the broader market, so this outlier's chances of making meaningful progress may not be very good unless the market's strong 2013 rally quickly resumes.
Technically, its big gain cleared the right side of the previously noted very deep 11-month cup shaped base. The weekly graph below shows that there was above average volume behind recent losses in the "handle", whereas lighter volume totals in the handle are considered healthier action based on historic examples. The small supply (S criteria) of only 13.2 million shares in the public float may contribute to greater volatility in the event of institutional positioning. The number of top-rated funds owning its shares rose from 89 in Mar '12 to 142 in Dec '12 which is reassuring concerning the I criteria.
|
|
|
Color Codes Explained :
Y - Better candidates highlighted by our
staff of experts.
G - Previously featured
in past reports as yellow but may no longer be buyable under the
guidelines.
***Last / Change / Volume data in this table is the closing quote data***
Symbol/Exchange
Company Name
Industry Group |
PRICE |
CHANGE
(%Change) |
Day High |
Volume
(% DAV)
(% 50 day avg vol) |
52 Wk Hi
% From Hi |
Featured
Date |
Price
Featured |
Pivot Featured |
|
Max Buy |
CELG
-
NASDAQ
Celgene Corp
DRUGS - Drug Manufacturers - Major
|
$99.45
|
+0.45
0.45% |
$100.50
|
2,371,582
63.46% of 50 DAV
50 DAV is 3,737,100
|
$103.69
-4.09%
|
12/11/2012
|
$82.24
|
PP = $81.34
|
|
MB = $85.41
|
 Most Recent Note - 2/26/2013 1:57:46 PM
G - Holding its ground near its all-time high after a "negative reversal" on 2/20/13. Its 50 DMA line (now $92.69) defines important support to watch on pullbacks.
>>> The latest Featured Stock Update with an annotated graph appeared on 2/4/2013. Click here.
View all notes |
Alert me of new notes |
CANSLIM.net Company Profile |
SEC |
Zacks Reports |
StockTalk |
News |
Chart |
Request a new note
C
A N
S L
I M


|
CFNL
-
NASDAQ
Cardinal Financial Corp
BANKING - Regional - Southeast Banks
|
$15.82
|
+0.05
0.32% |
$15.97
|
216,803
112.10% of 50 DAV
50 DAV is 193,400
|
$16.90
-6.39%
|
12/3/2012
|
$15.20
|
PP = $16.31
|
|
MB = $17.13
|
Most Recent Note - 2/26/2013 2:00:47 PM
G - Still sputtering below its 50 DMA line today. A prompt rebound above that short-term average is needed to help its outlook improve. Endured a loss on heavier volume on the prior session, raising more serious concerns.
>>> The latest Featured Stock Update with an annotated graph appeared on 2/21/2013. Click here.
View all notes |
Alert me of new notes |
CANSLIM.net Company Profile |
SEC |
Zacks Reports |
StockTalk |
News |
Chart |
Request a new note
C
A N
S L
I M
|
CMCSA
-
NASDAQ
Comcast Corp Cl A
MEDIA - CATV Systems
|
$39.69
|
+0.28
0.71% |
$39.77
|
12,820,055
90.95% of 50 DAV
50 DAV is 14,096,000
|
$42.00
-5.50%
|
12/3/2012
|
$37.08
|
PP = $38.06
|
|
MB = $39.96
|
Most Recent Note - 2/26/2013 1:55:07 PM
G - Endured mild distributional pressure while recently consolidating near its 52-week high. Reported earnings +11% on +6% sales revenues for the Dec '12 quarter, below the +25% minimum earnings guideline (C criteria), raising fundamental concerns
>>> The latest Featured Stock Update with an annotated graph appeared on 2/19/2013. Click here.
View all notes |
Alert me of new notes |
CANSLIM.net Company Profile |
SEC |
Zacks Reports |
StockTalk |
News |
Chart |
Request a new note
C
A N
S L
I M
|
KORS
-
NYSE
Michael Kors Hldgs Ltd
RETAIL - Apparel Stores
|
$59.24
|
+1.38
2.39% |
$59.47
|
9,156,383
176.66% of 50 DAV
50 DAV is 5,183,000
|
$65.10
-9.00%
|
1/23/2013
|
$54.98
|
PP = $58.72
|
|
MB = $61.66
|
Most Recent Note - 2/26/2013 2:04:43 PM
G - Rebounded from early losses today, halting its slide near prior highs in the $58 area. Tallied 3 losses on heavy volume in the span of the prior 4 sessions since completing another Secondary Offering 2/20/13 while perched near its all-time high.
>>> The latest Featured Stock Update with an annotated graph appeared on 2/7/2013. Click here.
View all notes |
Alert me of new notes |
CANSLIM.net Company Profile |
SEC |
Zacks Reports |
StockTalk |
News |
Chart |
Request a new note
C
A N
S L
I M
|
LNKD
-
NYSE
Linkedin Corp Class A
INTERNET - Internet Information Providers
|
$157.77
|
+1.72
1.10% |
$159.33
|
2,739,844
127.00% of 50 DAV
50 DAV is 2,157,400
|
$165.20
-4.50%
|
2/8/2013
|
$147.04
|
PP = $127.55
|
|
MB = $133.93
|
Most Recent Note - 2/25/2013 4:38:52 PM
G - Endured mild distributional today and finished near the session low. It remains perched only -5.5% off its all-time high, extended from any sound base. Disciplined investors may watch for secondary buy points or additional bases to possibly form and be noted in the weeks ahead.
>>> The latest Featured Stock Update with an annotated graph appeared on 2/8/2013. Click here.
View all notes |
Alert me of new notes |
CANSLIM.net Company Profile |
SEC |
Zacks Reports |
StockTalk |
News |
Chart |
Request a new note
C
A N
S L
I M
|
Symbol/Exchange
Company Name
Industry Group |
PRICE |
CHANGE
(%Change) |
Day High |
Volume
(% DAV)
(% 50 day avg vol) |
52 Wk Hi
% From Hi |
Featured
Date |
Price
Featured |
Pivot Featured |
|
Max Buy |
LOPE
-
NASDAQ
Grand Canyon Education
DIVERSIFIED SERVICES - Education and; Training Services
|
$23.80
|
-0.96
-3.88% |
$24.76
|
834,351
187.58% of 50 DAV
50 DAV is 444,800
|
$27.18
-12.44%
|
2/20/2013
|
$26.44
|
PP = $25.10
|
|
MB = $26.36
|
Most Recent Note - 2/26/2013 12:30:57 PM
G - Down considerably today, raising concerns while slumping below its 50 DMA line, and its color code is changed to green. It quickly negated its recent technical breakout.
>>> The latest Featured Stock Update with an annotated graph appeared on 2/20/2013. Click here.
View all notes |
Alert me of new notes |
CANSLIM.net Company Profile |
SEC |
Zacks Reports |
StockTalk |
News |
Chart |
Request a new note
C
A N
S L
I M
|
MIDD
-
NASDAQ
Middleby Corp
MANUFACTURING - Diversified Machinery
|
$144.88
|
+0.75
0.52% |
$147.79
|
106,894
117.47% of 50 DAV
50 DAV is 91,000
|
$152.10
-4.74%
|
10/8/2012
|
$118.46
|
PP = $122.67
|
|
MB = $128.80
|
Most Recent Note - 2/25/2013 4:45:43 PM
G - Reversed early gains today and finished near the session low with a damaging loss on above average volume. Fundamental concerns were recently noted and prior reports cautioned members that it is extended from any sound base. Its 50 DMA line defines important near-term chart support above prior highs in the $134-135 area.
>>> The latest Featured Stock Update with an annotated graph appeared on 2/25/2013. Click here.
View all notes |
Alert me of new notes |
CANSLIM.net Company Profile |
SEC |
Zacks Reports |
StockTalk |
News |
Chart |
Request a new note
C
A N
S L
I M
|
N
-
NYSE
Netsuite Inc
DIVERSIFIED SERVICES - Business/Management Services
|
$67.80
|
+0.44
0.65% |
$68.31
|
469,964
140.08% of 50 DAV
50 DAV is 335,500
|
$75.75
-10.50%
|
12/12/2012
|
$64.75
|
PP = $67.12
|
|
MB = $70.48
|
Most Recent Note - 2/26/2013 2:06:28 PM
G - Still quietly consolidating near its 50 DMA line. Damaging losses below that short-term average or the recent low ($65.31 on 2/13/13) may trigger technical sell signals. Concerns were raised following a worrisome "negative reversal" on 2/01/13 after initially gapping up for a new 52-week high, and recent notes have repeatedly cautioned - "Reported earnings +20% on +33% sales revenues for the Dec '12 quarter, below the +25% minimum earnings guideline (C criteria) raising fundamental concerns."
>>> The latest Featured Stock Update with an annotated graph appeared on 2/5/2013. Click here.
View all notes |
Alert me of new notes |
CANSLIM.net Company Profile |
SEC |
Zacks Reports |
StockTalk |
News |
Chart |
Request a new note
C
A N
S L
I M
|
NSR
-
NYSE
Neustar Inc
TELECOMMUNICATIONS - Diversified Communication Serv
|
$44.01
|
+0.47
1.08% |
$44.14
|
582,450
126.48% of 50 DAV
50 DAV is 460,500
|
$47.24
-6.84%
|
12/11/2012
|
$41.85
|
PP = $41.41
|
|
MB = $43.48
|
Most Recent Note - 2/25/2013 4:34:05 PM
G - Loss today led to a close below its 50 DMA line and it finished near the session low. Damaging loss on 2/21/13 with heavy volume raised concerns and triggered a technical sell signal.
>>> The latest Featured Stock Update with an annotated graph appeared on 2/1/2013. Click here.
View all notes |
Alert me of new notes |
CANSLIM.net Company Profile |
SEC |
Zacks Reports |
StockTalk |
News |
Chart |
Request a new note
C
A N
S L
I M
|
SFUN
-
NYSE
Soufun Hldgs Ltd Ads A
INTERNET - Internet Information Providers
|
$25.96
|
+0.36
1.41% |
$26.24
|
317,977
101.72% of 50 DAV
50 DAV is 312,600
|
$29.16
-10.97%
|
2/11/2013
|
$27.46
|
PP = $29.26
|
|
MB = $30.72
|
Most Recent Note - 2/25/2013 4:31:38 PM
G - Slumped back below its 50 DMA line today and finished near the session low. Color code is changed to green again. It still needs to produce gains above its pivot point before buying efforts may be justified under the fact-based system.
>>> The latest Featured Stock Update with an annotated graph appeared on 2/11/2013. Click here.
View all notes |
Alert me of new notes |
CANSLIM.net Company Profile |
SEC |
Zacks Reports |
StockTalk |
News |
Chart |
Request a new note
C
A N
S L
I M
|
Symbol/Exchange
Company Name
Industry Group |
PRICE |
CHANGE
(%Change) |
Day High |
Volume
(% DAV)
(% 50 day avg vol) |
52 Wk Hi
% From Hi |
Featured
Date |
Price
Featured |
Pivot Featured |
|
Max Buy |
SLCA
-
NYSE
U S Silica Holdings Inc
CHEMICALS - Specialty Chemicals
|
$21.62
|
+3.27
17.82% |
$23.56
|
2,528,069
639.37% of 50 DAV
50 DAV is 395,400
|
$22.14
-2.35%
|
2/26/2013
|
$22.23
|
PP = $21.50
|
|
MB = $22.58
|
Most Recent Note - 2/26/2013 7:22:41 PM
Y - Finished near the middle of its intra-day range today and just above its pivot point with a volume-driven gain. Highlighted in yellow with pivot point based on its 2/11/13 high in the earlier mid-day report. Reported strong sales revenues and earnings growth in the most current quarterly (C criteria) comparisons through Dec '12. Gapped up from near its 50 DMA line with a considerable volume-driven gain today for a new 52-week high. There was above average volume behind recent losses in the "handle" and technically, however its big gain today is clearing the right side of the previously noted very deep 11-month cup shaped base. Small supply (S criteria) of only 13.2 million shares in the public float may contribute to greater volatility in the event of institutional positioning. See the latest FSU analysis for more details and an new annotated weekly graph.
>>> The latest Featured Stock Update with an annotated graph appeared on 2/26/2013. Click here.
View all notes |
Alert me of new notes |
CANSLIM.net Company Profile |
SEC |
Zacks Reports |
StockTalk |
News |
Chart |
Request a new note
C
A N
S L
I M
|
VRX
-
NYSE
Valeant Pharmaceuticals
DRUGS - Drug Manufacturers - Other
|
$65.16
|
-0.30
-0.46% |
$65.55
|
1,067,900
78.94% of 50 DAV
50 DAV is 1,352,800
|
$67.98
-4.15%
|
12/20/2012
|
$60.24
|
PP = $61.21
|
|
MB = $64.27
|
Most Recent Note - 2/26/2013 2:09:00 PM
G - Consolidating just -4.2% off its 52-week high today. It has slumped below the previously noted upward trendline connecting its November - December lows, and the 50 DMA line (now $63.76) defines the next important support area to watch.
>>> The latest Featured Stock Update with an annotated graph appeared on 2/15/2013. Click here.
View all notes |
Alert me of new notes |
CANSLIM.net Company Profile |
SEC |
Zacks Reports |
StockTalk |
News |
Chart |
Request a new note
C
A N
S L
I M
|
|
|
|
THESE ARE NOT BUY RECOMMENDATIONS!
Comments contained in the body of this report are technical
opinions only. The material herein has been obtained
from sources believed to be reliable and accurate, however,
its accuracy and completeness cannot be guaranteed.
This site is not an investment advisor, hence it does
not endorse or recommend any securities or other investments.
Any recommendation contained in this report may not
be suitable for all investors and it is not to be deemed
an offer or solicitation on our part with respect to
the purchase or sale of any securities. All trademarks,
service marks and trade names appearing in this report
are the property of their respective owners, and are
likewise used for identification purposes only.
This report is a service available
only to active Paid Premium Members.
You may opt-out of receiving report notifications
at any time. Questions or comments may be submitted
by writing to Premium Membership Services 665 S.E. 10 Street, Suite 201 Deerfield Beach, FL 33441-5634 or by calling 1-800-965-8307
or 954-785-1121.
|
|
|

