You are not logged in.
This means you
CAN ONLY VIEW reports that were published prior to Monday, February 26, 2024.
You
MUST UPGRADE YOUR MEMBERSHIP if you want to see any current reports.
AFTER MARKET UPDATE - TUESDAY, FEBRUARY 25TH, 2020
Previous After Market Report Next After Market Report >>>
|
|
|
|
DOW |
-879.44 |
27,081.36 |
-3.15% |
|
Volume |
1,354,355,110 |
+14% |
|
Volume |
3,566,944,800 |
+12% |
|
NASDAQ |
-255.67 |
8,965.61 |
-2.77% |
|
Advancers |
278 |
10% |
|
Advancers |
480 |
15% |
|
S&P 500 |
-97.68 |
3,128.21 |
-3.03% |
|
Decliners |
2,538 |
90% |
|
Decliners |
2,744 |
85% |
|
Russell 2000 |
-56.21 |
1,571.90 |
-3.45% |
|
52 Wk Highs |
52 |
|
|
52 Wk Highs |
64 |
|
|
S&P 600 |
-33.13 |
946.92 |
-3.38% |
|
52 Wk Lows |
367 |
|
|
52 Wk Lows |
244 |
|
|
 |
Major Indices Suffer Another Damaging Volume-Driven Loss
Kenneth J. Gruneisen - Passed the CAN SLIM® Master's Exam
After a steep afternoon sell-off, the Dow retreated 879 points. The S&P 500 fell 3%, marking the worst two-session drop for the benchmark since the height of the Financial Crisis in 2008. The Nasdaq Composite outperformed on a relative basis, losing 2.8%. Breadth was decisively negative as decliners led advancers by a 9-1 margin on the NYSE and by nearly 6-1 on the Nasdaq exchange. The reported volume totals were higher than the prior session totals on the NYSE and on the Nasdaq exchange, indicative of even greater distributional pressure. Leadership thinned as there were only 9 high-ranked companies from the Leaders List that hit a new 52-week high and were listed on the BreakOuts Page, down from the 139 on last Wednesday's session. New 52-week lows totals also expanded further and solidly outnumbered shrinking new 52-week highs on the NYSE and on the Nasdaq exchange. The major indices' (M criteria) have come under heavier pressure having the look of a more serious correction. Disciplined investors know to watch for technical sell signals on a case-by-case basis and stand ready to reduce exposure especially if the market suffers more damaging losses. The Featured Stocks Page provides the most timely analysis on high-ranked leaders. Charts used courtesy of www.stockcharts.com
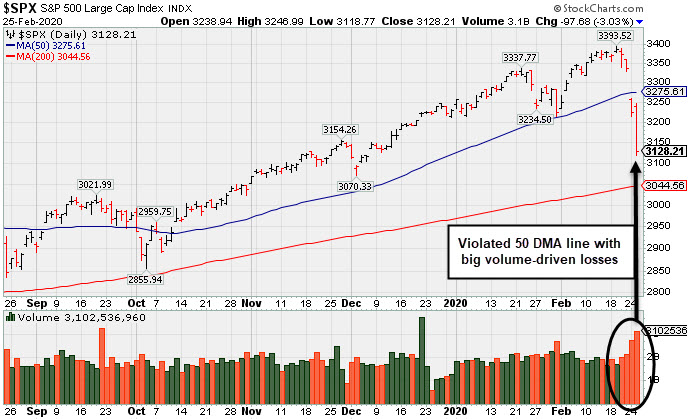
PICTURED: The S&P 500 Index is -7.8% off its all-time high after 4 consecutive losses marked by increasing volume. It gapped down on the prior session and violated its 50-day moving average (DMA) line.
U Stocks retreated and U.S. Treasury yields dipped to record lows on Tuesday amid increasing uncertainty surrounding the global spread of the coronavirus. After the worst session in two years for U.S. equities on Monday, the major averages attempted a morning rebound. Sentiment faltered, however, after the CDC warned Americans should prepare for a coronavirus outbreak within the United States.
Amid the perceived “risk-off” mood, U.S. Treasuries continued their recent rally. The yield on the 10-year note reached a record low of 1.31% before finishing two basis points lower at 1.34%. The yield on the 30-year bond eased one basis point to 1.80%. The drop in yields weighed on bank stocks, sending the KBW Bank Index tumbling 4.5% on the session.
All 11 S&P 500 sectors finished in negative territory, with Energy and Materials leading the losses as commodity prices tumbled. WTI crude declined another 1.5% to $49.77/barrel while COMEX gold slid 1.3% to $1650.60/ounce. Travel-centric stocks also continued to underperform amid the coronavirus related uncertainty, with S&P 500 Airline shares retreating 7.2% on the session.
In earnings, Home Depot (HD -0.97%) was lower after topping Wall Street profit and revenue expectations while Macy’s (M -5.50%) fell despite topping analyst expectations for holiday sales. In other corporate news, Disney (DIS -3.62%) announced the immediate departure of CEO Bob Iger after the market closed on Tuesday. |
 Kenneth J. Gruneisen started out as a licensed stockbroker in August 1987, a couple of months prior to the historic stock market crash that took the Dow Jones Industrial Average down -22.6% in a single day. He has published daily fact-based fundamental and technical analysis on high-ranked stocks online for two decades. Through FACTBASEDINVESTING.COM, Kenneth provides educational articles, news, market commentary, and other information regarding proven investment systems that work in good times and bad.
Comments contained in the body of this report are technical opinions only and are not necessarily those of Gruneisen Growth Corp. The material herein has been obtained from sources believed to be reliable and accurate, however, its accuracy and completeness cannot be guaranteed. Our firm, employees, and customers may effect transactions, including transactions contrary to any recommendation herein, or have positions in the securities mentioned herein or options with respect thereto. Any recommendation contained in this report may not be suitable for all investors and it is not to be deemed an offer or solicitation on our part with respect to the purchase or sale of any securities. |
|
 |
Financial, Retail, Tech, and Commodity-Linked Groups Fell
Kenneth J. Gruneisen - Passed the CAN SLIM® Master's Exam
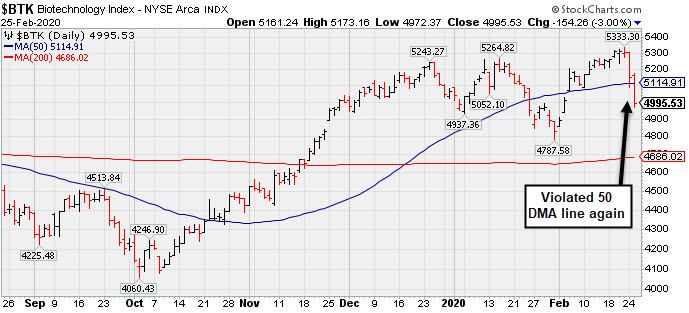
The Bank Index ($BKX -4.49%) and the Broker/Dealer Index ($XBD -3.77%) lost considerable ground while the Retail Index ($RLX -2.15%) also fell. The tech sector had a negative bias as the Semiconductor Index ($SOX -3.06%), Networking Index ($NWX -3.65%), and the Biotech Index ($BTK -3.00%) suffered unanimous losses. Again the Oil Services Index ($OSX -4.76%) and the Integrated Oil Index ($XOI -4.12%) both lost considerable ground, and the Gold & Silver Index ($XAU -3.62%) also slumped on the widely negative session.
PICTURED: The Biotech Index ($BTK -3.00%) violated its 50-day moving average (DMA) line with another big loss.
| Oil Services |
$OSX |
55.28 |
-2.76 |
-4.76% |
-29.39% |
| Integrated Oil |
$XOI |
1,020.75 |
-43.89 |
-4.12% |
-19.66% |
| Semiconductor |
$SOX |
1,746.11 |
-55.12 |
-3.06% |
-5.60% |
| Networking |
$NWX |
514.17 |
-19.47 |
-3.65% |
-11.87% |
| Broker/Dealer |
$XBD |
280.18 |
-10.97 |
-3.77% |
-3.51% |
| Retail |
$RLX |
2,499.71 |
-54.85 |
-2.15% |
+2.06% |
| Gold & Silver |
$XAU |
107.48 |
-4.03 |
-3.61% |
+0.52% |
| Bank |
$BKX |
99.50 |
-4.67 |
-4.48% |
-12.23% |
| Biotech |
$BTK |
4,995.53 |
-154.26 |
-3.00% |
-1.42% |
|
|
|
 |
Featured Stocks
Kenneth J. Gruneisen - Passed the CAN SLIM® Master's Exam
See the Featured Stocks with most recent note below. Feel free to contact us if you have a need for any additional information. |
|
|
Color Codes Explained :
Y - Better candidates highlighted by our
staff of experts.
G - Previously featured
in past reports as yellow but may no longer be buyable under the
guidelines.
***Last / Change / Volume data in this table is the closing quote data***
Symbol/Exchange
Company Name
Industry Group |
PRICE |
CHANGE
(%Change) |
Day High |
Volume
(% DAV)
(% 50 day avg vol) |
52 Wk Hi
% From Hi |
Featured
Date |
Price
Featured |
Pivot Featured |
|
Max Buy |
 FTNT
-
NASDAQ
FTNT
-
NASDAQ
Fortinet Inc
Computer Sftwr-Security
|
$105.05
|
-3.65
-3.36% |
$109.74
|
2,786,311
241.87% of 50 DAV
50 DAV is 1,152,000
|
$121.82
-13.77%
|
12/9/2019
|
$103.85
|
PP = $106.10
|
|
MB = $111.41
|
 Most Recent Note - 2/25/2020 6:16:44 PM
G - Sank further today after violating the 50 DMA line ($113.89) and prior low ($112.06) on the prior session with a big loss on higher volume triggering technical sell signals. Reported earnings +29% on +21% sales revenues for the Dec '19 quarter, continuing its strong earnings track record above the +25% minimum guideline (C criteria).
>>> FEATURED STOCK ARTICLE : Fortinet Posted Gain for Best-Ever Close - 2/4/2020 |
View all notes |
Set NEW NOTE alert |
Company Profile |
SEC
News |
Chart |
Request a new note
C
A
S
I |
SPSC
-
NASDAQ
S P S Commerce Inc
COMPUTER SOFTWARE and SERVICES - Application Software
|
$54.37
|
-0.92
-1.66% |
$55.91
|
173,964
103.61% of 50 DAV
50 DAV is 167,900
|
$62.26
-12.67%
|
11/29/2019
|
$56.59
|
PP = $59.24
|
|
MB = $62.20
|
Most Recent Note - 2/24/2020 6:40:52 PM
G - Color code is changed to green after a 4th consecutive loss, and it violated its 50 DMA line ($57.34) while retreating abruptly from its all-time high. Fundamentals remain strong. Its current Relative Strength Rating of 54 is below the 80+ minimum guideline for buy candidates. See the latest FSU analysis for more details and a new annotated graph.
>>> FEATURED STOCK ARTICLE : 4 Damaging Losses Followed Recent Technical Breakout - 2/24/2020 |
View all notes |
Set NEW NOTE alert |
Company Profile |
SEC
News |
Chart |
Request a new note
C
A
S
I |
AUDC
-
NASDAQ
Audiocodes Ltd
ELECTRONICS - Scientific and Technical Instrum
|
$24.23
|
-0.12
-0.49% |
$24.85
|
341,509
95.39% of 50 DAV
50 DAV is 358,000
|
$28.73
-15.66%
|
9/13/2019
|
$19.68
|
PP = $19.84
|
|
MB = $20.83
|
Most Recent Note - 2/20/2020 5:09:15 PM
G - Rebounded above its 50 DMA line ($24.95) with today's gain. Still faces resistance due to overhead supply up to the $28 level. Fundamentals remain strong after it reported earnings +30% on +15% sales revenues for the Dec '19 quarter.
>>> FEATURED STOCK ARTICLE : Rebounding After Damaging Losses Triggered Sell Signals - 2/14/2020 |
View all notes |
Set NEW NOTE alert |
Company Profile |
SEC
News |
Chart |
Request a new note
C
A
S
I |
CHDN
-
NASDAQ
Churchill Downs Inc
LEISURE - Gaming Activities
|
$150.24
|
-6.62
-4.22% |
$158.50
|
288,724
145.09% of 50 DAV
50 DAV is 199,000
|
$167.53
-10.32%
|
10/8/2019
|
$129.77
|
PP = $132.83
|
|
MB = $139.47
|
Most Recent Note - 2/25/2020 5:53:52 PM
G - Pulled back and finished -10.3% off its 52-week high. Its 50 DMA line ($144) defines near-term support. Due to report Dec '19 earnings news on 2/26/20. The Jun and Sep '19 quarterly earnings versus the year ago periods were both below the +25% minimum guideline (C criteria) and raised fundamental concerns.
>>> FEATURED STOCK ARTICLE : Perched at New Record High After Recent Gains on Average Volume - 2/7/2020 |
View all notes |
Set NEW NOTE alert |
Company Profile |
SEC
News |
Chart |
Request a new note
C
A
S
I |
LULU
-
NASDAQ
Lululemon Athletica
MANUFACTURING - Textile Manufacturing
|
$238.81
|
-7.40
-3.01% |
$250.45
|
1,548,628
86.27% of 50 DAV
50 DAV is 1,795,000
|
$266.20
-10.29%
|
9/6/2019
|
$201.25
|
PP = $194.35
|
|
MB = $204.07
|
Most Recent Note - 2/24/2020 6:33:36 PM
G - Finished near the session high today after a gap down tested its 50 DMA line ($239.97) and prior low ($231.84 on 1/27/20). Fundamentals remain strong. More damaging losses would raise concerns.
>>> FEATURED STOCK ARTICLE : Perched at Record High After 4th Consecutive Gain on Light Volume - 2/20/2020 |
View all notes |
Set NEW NOTE alert |
Company Profile |
SEC
News |
Chart |
Request a new note
C
A
S
I |
Symbol/Exchange
Company Name
Industry Group |
PRICE |
CHANGE
(%Change) |
Day High |
Volume
(% DAV)
(% 50 day avg vol) |
52 Wk Hi
% From Hi |
Featured
Date |
Price
Featured |
Pivot Featured |
|
Max Buy |
CPRT
-
NASDAQ
Copart Inc
SPECIALTY RETAIL - Auto Dealerships
|
$88.94
|
-3.83
-4.13% |
$93.39
|
2,653,458
151.63% of 50 DAV
50 DAV is 1,750,000
|
$104.88
-15.20%
|
1/2/2020
|
$92.80
|
PP = $92.51
|
|
MB = $97.14
|
Most Recent Note - 2/25/2020 6:11:03 PM
Slumped further below its 50 DMA line with today's 4th consecutive damaging volume-driven loss, retreating abruptly from its all-time high. Reported earnings +25% on +19% sales revenues for the Jan '20 quarter. Violated prior highs in the $91-92 area noted as the next important support level. it will be dropped from the Featured Stocks list tonight.
>>> FEATURED STOCK ARTICLE : Perched at Record High With Earnings News Due - 2/18/2020 |
View all notes |
Set NEW NOTE alert |
Company Profile |
SEC
News |
Chart |
Request a new note
C
A
S
I |
SPLK
-
NASDAQ
Splunk Inc
Computer Sftwr-Database
|
$155.62
|
-4.43
-2.77% |
$164.24
|
2,306,494
151.54% of 50 DAV
50 DAV is 1,522,000
|
$176.31
-11.74%
|
11/25/2019
|
$147.79
|
PP = $142.16
|
|
MB = $149.27
|
Most Recent Note - 2/21/2020 5:05:23 PM
G - Pulled back for a big loss today with higher volume, retreating from its all-time high. It is extended from the previously noted base. Its 50 DMA line ($157) defines important support to watch on pullbacks.
>>> FEATURED STOCK ARTICLE : Perched at Record High After 7th Consecutive Gain - 2/19/2020 |
View all notes |
Set NEW NOTE alert |
Company Profile |
SEC
News |
Chart |
Request a new note
C
A
S
I |
PAYC
-
NYSE
Paycom Software Inc
COMPUTER SOFTWARE and SERVICES - Application Software
|
$288.91
|
-6.86
-2.32% |
$301.63
|
906,846
98.68% of 50 DAV
50 DAV is 919,000
|
$342.00
-15.52%
|
11/20/2019
|
$252.97
|
PP = $259.81
|
|
MB = $272.80
|
Most Recent Note - 2/20/2020 5:12:26 PM
G - Pulled back today with near average volume after 5 consecutive gains. Its 50 DMA line ($289.56) and prior low ($288.10 on 2/06/20) define near-term support. More damaging losses would raise concerns and trigger a technical sell signal. Fundamentals remain strong after it reported earnings +41% on +29% for the Dec '19 quarter.
>>> FEATURED STOCK ARTICLE : Pulled Back Near 50-Day Average Following Strong Earnings Report - 2/11/2020 |
View all notes |
Set NEW NOTE alert |
Company Profile |
SEC
News |
Chart |
Request a new note
C
A
S
I |
BLD
-
NYSE
Topbuild Corp
Bldg-Constr Prds/Misc
|
$114.01
|
-6.77
-5.61% |
$120.00
|
870,083
301.07% of 50 DAV
50 DAV is 289,000
|
$125.66
-9.27%
|
12/9/2019
|
$109.71
|
PP = $113.84
|
|
MB = $119.53
|
Most Recent Note - 2/25/2020 12:23:33 PM
Y - Color code is changed to yellow while slumping from its 52-week high with today's 3rd consecutive loss on increasing volume, undercutting the prior high ($113.74) and testing its 50 DMA line ($110.92). More damaging losses would raise greater concerns and trigger a technical sell signal.
>>> FEATURED STOCK ARTICLE : Volume Totals Cooling While Consolidating Near All-Time High - 2/6/2020 |
View all notes |
Set NEW NOTE alert |
Company Profile |
SEC
News |
Chart |
Request a new note
C
A
S
I |
TEAM
-
NASDAQ
Atlassian Corp Plc Cl A
Comp Sftwr-Spec Enterprs
|
$144.48
|
-2.63
-1.79% |
$149.00
|
2,086,620
131.15% of 50 DAV
50 DAV is 1,591,000
|
$156.12
-7.46%
|
1/24/2020
|
$144.66
|
PP = $140.49
|
|
MB = $147.51
|
Most Recent Note - 2/24/2020 6:36:57 PM
Y - Color code is changed to yellow as it managed a "positive reversal" today after undercutting its "max buy" level amid widespread weakness. Fundamentals remain strong.
>>> FEATURED STOCK ARTICLE : Atlassian Has Been Hovering Near its All-Time High - 2/12/2020 |
View all notes |
Set NEW NOTE alert |
Company Profile |
SEC
News |
Chart |
Request a new note
C
A
S
I |
Symbol/Exchange
Company Name
Industry Group |
PRICE |
CHANGE
(%Change) |
Day High |
Volume
(% DAV)
(% 50 day avg vol) |
52 Wk Hi
% From Hi |
Featured
Date |
Price
Featured |
Pivot Featured |
|
Max Buy |
GLOB
-
NYSE
Globant SA
Computer-Tech Services
|
$116.00
|
-7.27
-5.90% |
$124.93
|
439,477
164.60% of 50 DAV
50 DAV is 267,000
|
$141.67
-18.12%
|
11/14/2019
|
$106.87
|
PP = $112.43
|
|
MB = $118.05
|
Most Recent Note - 2/25/2020 6:13:18 PM
G - Violated its 50 DMA line today, abruptly retreating from its all-time high. Reported earnings +28% on +32% sales revenues for the Dec '19 quarter, continuing its strong earnings track record. It is extended from any sound base. Its prior high ($112.33) defines important near-term support to watch.
>>> FEATURED STOCK ARTICLE : Encountering Distributional Pressure After Wedging to New Highs - 2/5/2020 |
View all notes |
Set NEW NOTE alert |
Company Profile |
SEC
News |
Chart |
Request a new note
C
A
S
I |
STNE
-
NASDAQ
Stoneco Ltd Cl A
Finance-CrdtCard/PmtPr
|
$41.00
|
-0.78
-1.87% |
$43.13
|
2,811,384
163.17% of 50 DAV
50 DAV is 1,723,000
|
$45.72
-10.32%
|
1/22/2020
|
$43.94
|
PP = $45.72
|
|
MB = $48.01
|
Most Recent Note - 2/24/2020 6:42:09 PM
Y - Found impressive support near its 50 DMA line ($41). Subsequent gains above the pivot point backed by at least +40% above average volume are needed to trigger a technical buy signal.
>>> FEATURED STOCK ARTICLE : 50-Day Moving Average Line Violation Hurts Outlook - 2/10/2020 |
View all notes |
Set NEW NOTE alert |
Company Profile |
SEC
News |
Chart |
Request a new note
C
A
S
I |
DAVA
-
NYSE
Endava Plc Cl A Ads
Computer-Tech Services
|
$50.07
|
-1.93
-3.71% |
$52.75
|
130,328
116.36% of 50 DAV
50 DAV is 112,000
|
$55.75
-10.19%
|
2/13/2020
|
$53.71
|
PP = $49.86
|
|
MB = $52.35
|
Most Recent Note - 2/25/2020 6:14:55 PM
Y - Retreating from its all-time high. Color code was changed to yellow after retreating below its "max buy" level. Prior highs in the $49 area define initial support to watch above its 50 DMA line ($47.98).
>>> FEATURED STOCK ARTICLE : Breakout Gain Backed By +462% Above Average Volme - 2/13/2020 |
View all notes |
Set NEW NOTE alert |
Company Profile |
SEC
News |
Chart |
Request a new note
C
A
S
I |
|
|
|
THESE ARE NOT BUY RECOMMENDATIONS!
Comments contained in the body of this report are technical
opinions only. The material herein has been obtained
from sources believed to be reliable and accurate, however,
its accuracy and completeness cannot be guaranteed.
This site is not an investment advisor, hence it does
not endorse or recommend any securities or other investments.
Any recommendation contained in this report may not
be suitable for all investors and it is not to be deemed
an offer or solicitation on our part with respect to
the purchase or sale of any securities. All trademarks,
service marks and trade names appearing in this report
are the property of their respective owners, and are
likewise used for identification purposes only.
This report is a service available
only to active Paid Premium Members.
You may opt-out of receiving report notifications
at any time. Questions or comments may be submitted
by writing to Premium Membership Services 665 S.E. 10 Street, Suite 201 Deerfield Beach, FL 33441-5634 or by calling 1-800-965-8307
or 954-785-1121.
|
|
|