You are not logged in.
This means you
CAN ONLY VIEW reports that were published prior to Monday, April 14, 2025.
You
MUST UPGRADE YOUR MEMBERSHIP if you want to see any current reports.
AFTER MARKET UPDATE - MONDAY, FEBRUARY 25TH, 2013
Previous After Market Report Next After Market Report >>>
|
|
|
|
DOW |
-216.40 |
13,784.17 |
-1.55% |
|
Volume |
818,777,540 |
+20% |
|
Volume |
1,862,960,800 |
+22% |
|
NASDAQ |
-45.57 |
3,116.25 |
-1.44% |
|
Advancers |
677 |
21% |
|
Advancers |
468 |
18% |
|
S&P 500 |
-27.75 |
1,487.85 |
-1.83% |
|
Decliners |
2,403 |
76% |
|
Decliners |
2,044 |
79% |
|
Russell 2000 |
-20.32 |
895.84 |
-2.22% |
|
52 Wk Highs |
147 |
|
|
52 Wk Highs |
119 |
|
|
S&P 600 |
-11.19 |
501.34 |
-2.18% |
|
52 Wk Lows |
24 |
|
|
52 Wk Lows |
29 |
|
|
 |
Ugly Negative Reversal for Major Indices
Kenneth J. Gruneisen - Passed the CAN SLIM® Master's Exam
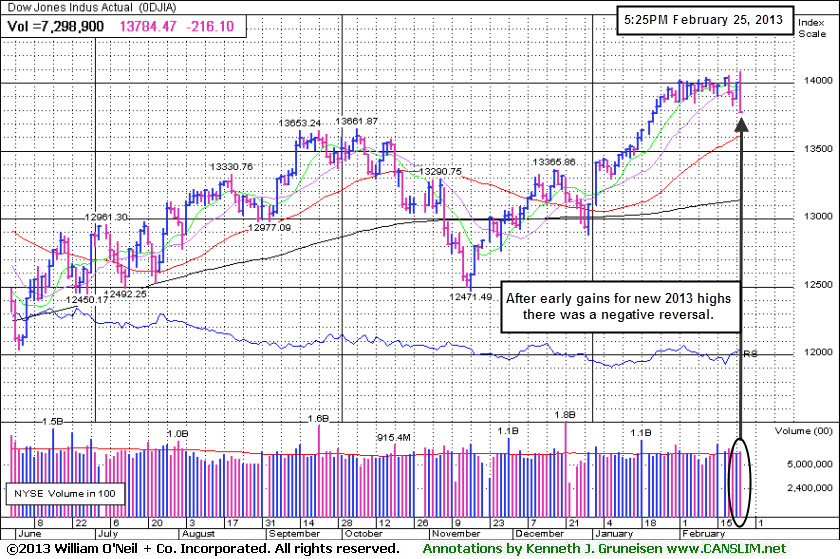
The S&P 500 Index suffered its worst decline since November 7 on Monday in a sharp reversal from initial gains. While all of the major averages erased early gains and ended with losses, the volume totals reported were higher than the prior session on the NYSE and on the Nasdaq exchange which indicated an increase in institutional selling termed "distribution". Breadth was clearly negative as decliners led advancers by nearly 4-1 on the NYSE and by more than 4-1 on the Nasdaq exchange. The total number of stocks hitting new 52-week highs still outnumbered new 52-week lows on the NYSE and on the Nasdaq exchange. There were 43 high-ranked companies from the CANSLIM.net Leaders List making new 52-week highs and appearing on the CANSLIM.net BreakOuts Page, up from the prior session's total of 22 stocks. All 11 high-ranked companies currently included on the Featured Stocks Page lost ground.
Elections in Italy stoked concerns that a divided parliament could disrupt the country's fiscal reforms and the euro zone's stability and the major averages retreated. The market had advanced earlier on speculation Japan's prime minister will nominate a supporter of stimulus measures to head the country's central bank. Attention was also on Washington as lawmakers were returning from recess to discuss the $85 billion in automatic spending cuts due to take effect on March 1. Tuesday, Fed Chairman Bernanke begins two days of congressional testimony which may include questions on the central bank's bond buying program.
Utilities and tech were the best performing sectors on the session, but after trading higher for most of the day shares of Exelon (EXC -0.46%) and Qualcomm Inc (QCOM -0.22%) ended lower while there was a broad-based reversal from early gains. Materials were the worst performing group with Peabody Energy (BTU -4.98%) tumbling. Shares of The Lowe's Companies Inc (LOW -4.89%) also retreated after the retailer reported better-than-expected quarterly results.
The market's (M criteria) uptrend recently encountered distributional pressure. Leadership (stocks hitting new 52-week highs) has waned and several high-ranked leaders have recently triggered technical sell signals. Members are reminded to watch individual holdings closely while remaining ready to reduce exposure. Only consider new buying efforts when all key criteria are solidly satisfied.
Watch for an announcement via email concerning the next WEBCAST. The webcast will also be available via an updated link highlighted at the top of the Premium Member Homepage.
PICTURED: The Dow Jones Industrial Average surrendered early gains after initially surging to new 2013 highs, ending the session with a large loss while the volume totals increased on the exchanges.
|
 Kenneth J. Gruneisen started out as a licensed stockbroker in August 1987, a couple of months prior to the historic stock market crash that took the Dow Jones Industrial Average down -22.6% in a single day. He has published daily fact-based fundamental and technical analysis on high-ranked stocks online for two decades. Through FACTBASEDINVESTING.COM, Kenneth provides educational articles, news, market commentary, and other information regarding proven investment systems that work in good times and bad.
Comments contained in the body of this report are technical opinions only and are not necessarily those of Gruneisen Growth Corp. The material herein has been obtained from sources believed to be reliable and accurate, however, its accuracy and completeness cannot be guaranteed. Our firm, employees, and customers may effect transactions, including transactions contrary to any recommendation herein, or have positions in the securities mentioned herein or options with respect thereto. Any recommendation contained in this report may not be suitable for all investors and it is not to be deemed an offer or solicitation on our part with respect to the purchase or sale of any securities. |
|
 |
Energy, Financial, Retail and Tech Groups Led Losses
Kenneth J. Gruneisen - Passed the CAN SLIM® Master's Exam
The Oil Services Index ($OSX -3.30%) and the Integrated Oil Index ($XOI -2.83%) were among Monday's biggest decliners. The Bank Index ($BKX -2.72%) and Broker/Dealer Index ($XBD -2.66%) also were a negative influence on the major averages along with the Retail Index ($RLX -2.02%). The Semiconductor Index ($SOX -1.96%), Networking Index ($NWX -1.87%), Internet Index ($IIX -1.74%), and Biotechnology Index ($BTK -1.21%) ended with unanimous losses. The Healthcare Index ($HMO -1.41%) also slumped, meanwhile the Gold & Silver Index ($XAU +1.28%) was a lone standout in the plus column.
Charts courtesy www.stockcharts.com
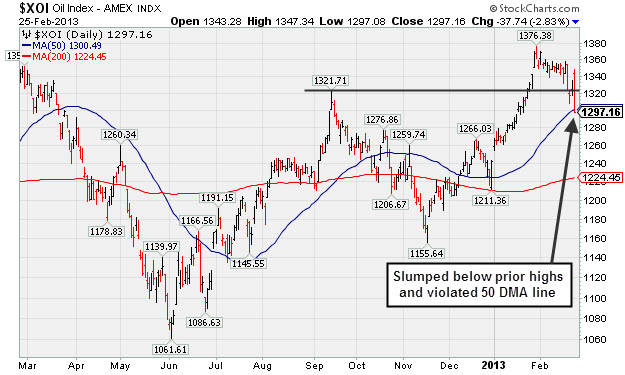
PICTURED: The Integrated Oil Index ($XOI -2.83%) slumped below its prior highs and violated its 50-day moving average (DMA) line.
| Oil Services |
$OSX |
237.69 |
-8.10 |
-3.30% |
+7.96% |
| Healthcare |
$HMO |
2,670.37 |
-38.11 |
-1.41% |
+6.21% |
| Integrated Oil |
$XOI |
1,297.16 |
-37.74 |
-2.83% |
+4.46% |
| Semiconductor |
$SOX |
416.66 |
-8.32 |
-1.96% |
+8.49% |
| Networking |
$NWX |
233.68 |
-4.45 |
-1.87% |
+3.15% |
| Internet |
$IIX |
351.27 |
-6.21 |
-1.74% |
+7.42% |
| Broker/Dealer |
$XBD |
104.64 |
-2.86 |
-2.66% |
+10.92% |
| Retail |
$RLX |
682.37 |
-14.07 |
-2.02% |
+4.49% |
| Gold & Silver |
$XAU |
138.05 |
+1.74 |
+1.28% |
-16.64% |
| Bank |
$BKX |
53.02 |
-1.48 |
-2.72% |
+3.39% |
| Biotech |
$BTK |
1,649.67 |
-20.17 |
-1.21% |
+6.63% |
|
|
|
 |
Negative Reversals Emphasize Distributional Action
Kenneth J. Gruneisen - Passed the CAN SLIM® Master's Exam
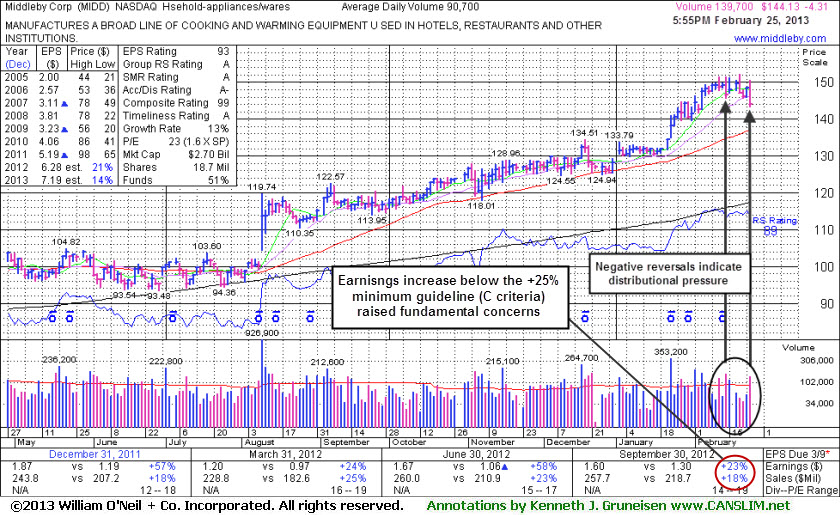
Middleby Corp (MIDD -$4.31 or -2.90% to $144.13) reversed early gains today and finished near the session low with a damaging loss on above average volume. An additional "negative reversal" was noted in recent weeks. Fundamental concerns were also noted as prior reports cautioned members. Its last appearance in this FSU section was on 1/30/13 with an annotated graph under the headline, "Retreating From All-Time Highs After Getting Extended", and it rallied further into new high territory Prior reports noted - "Disciplined investors may watch closely for sell signals if holding it and giving it a chance to produce more climactic gains."
Earnings +23% on +18% sales for the Sep '12 quarter, below the +25% minimum earnings guideline (C criteria), raised concerns. The number of top-rated funds owning its shares rose from 351 in Dec '11 to 406 in Dec '12, a reassuring sign concerning the I criteria. Its current Up/Down Volume Ratio of 1.8 is still an unbiased indication its shares have been under accumulation over the past 50 days, despite the worrisome negative reversals noted. Its small supply (S criteria) of only 17.1 million shares in the public float can contribute to greater price volatility in the event of institutional buying or selling.
MIDD has traded up as much as +28.8% since first highlighted in yellow in the 8/09/12 mid-day report as it gapped up and broke out from a long flat base with a considerable gain 9 times average volume. Investors who are disciplined, selective, and patient would likely watch for a fresh breakout in another high-ranked stock without any fundamental flaws, rather than looking for excuses to buy one that has flaws and one that is also extended from a sound base and enduring distributional pressure.
|
|
|
Color Codes Explained :
Y - Better candidates highlighted by our
staff of experts.
G - Previously featured
in past reports as yellow but may no longer be buyable under the
guidelines.
***Last / Change / Volume data in this table is the closing quote data***
Symbol/Exchange
Company Name
Industry Group |
PRICE |
CHANGE
(%Change) |
Day High |
Volume
(% DAV)
(% 50 day avg vol) |
52 Wk Hi
% From Hi |
Featured
Date |
Price
Featured |
Pivot Featured |
|
Max Buy |
CELG
-
NASDAQ
Celgene Corp
DRUGS - Drug Manufacturers - Major
|
$99.00
|
-2.65
-2.61% |
$102.00
|
3,241,760
85.44% of 50 DAV
50 DAV is 3,794,300
|
$103.69
-4.52%
|
12/11/2012
|
$82.24
|
PP = $81.34
|
|
MB = $85.41
|
Most Recent Note - 2/21/2013 1:24:17 PM
G - Pulling back today following a worrisome "negative reversal" on the prior session, reversing into the red for a loss on heavy volume and closing near the session low after initial gains for new all-time highs. Its 50 DMA line (now $91.17) defines important support to watch on pullbacks.
>>> The latest Featured Stock Update with an annotated graph appeared on 2/4/2013. Click here.
View all notes |
Alert me of new notes |
CANSLIM.net Company Profile |
SEC |
Zacks Reports |
StockTalk |
News |
Chart |
Request a new note
C
A N
S L
I M


|
CFNL
-
NASDAQ
Cardinal Financial Corp
BANKING - Regional - Southeast Banks
|
$15.77
|
-0.29
-1.81% |
$16.25
|
251,193
128.82% of 50 DAV
50 DAV is 195,000
|
$16.90
-6.69%
|
12/3/2012
|
$15.20
|
PP = $16.31
|
|
MB = $17.13
|
Most Recent Note - 2/21/2013 5:36:45 PM
G - Violated its 50 DMA line today with a loss on light volume triggering a technical sell signal. See the latest FSU analysis for more details and a new annotated graph.
>>> The latest Featured Stock Update with an annotated graph appeared on 2/21/2013. Click here.
View all notes |
Alert me of new notes |
CANSLIM.net Company Profile |
SEC |
Zacks Reports |
StockTalk |
News |
Chart |
Request a new note
C
A N
S L
I M
|
CMCSA
-
NASDAQ
Comcast Corp Cl A
MEDIA - CATV Systems
|
$39.41
|
-0.50
-1.25% |
$40.32
|
18,045,549
129.18% of 50 DAV
50 DAV is 13,969,300
|
$42.00
-6.17%
|
12/3/2012
|
$37.08
|
PP = $38.06
|
|
MB = $39.96
|
Most Recent Note - 2/19/2013 4:55:14 PM
G - Traded up today near its 52-week high hit during a streak of 5 consecutive gains backed by above average volume. Reported earnings +11% on +6% sales revenues for the Dec '12 quarter, below the +25% minimum earnings guideline (C criteria), raising fundamental concerns, yet bullish action has continued. See the latest FSU analysis for more details and a new annotated graph.
>>> The latest Featured Stock Update with an annotated graph appeared on 2/19/2013. Click here.
View all notes |
Alert me of new notes |
CANSLIM.net Company Profile |
SEC |
Zacks Reports |
StockTalk |
News |
Chart |
Request a new note
C
A N
S L
I M
|
KORS
-
NYSE
Michael Kors Hldgs Ltd
RETAIL - Apparel Stores
|
$57.86
|
-1.25
-2.11% |
$59.65
|
6,835,964
133.91% of 50 DAV
50 DAV is 5,104,900
|
$65.10
-11.12%
|
1/23/2013
|
$54.98
|
PP = $58.72
|
|
MB = $61.66
|
Most Recent Note - 2/21/2013 1:28:56 PM
G - Gapped down for a 2nd consecutive session and another loss on heavy volume today. Completed another Secondary Offering on 2/20/13 while perched near its all-time high. Prior highs in the $58 area define important initial chart support to watch.
>>> The latest Featured Stock Update with an annotated graph appeared on 2/7/2013. Click here.
View all notes |
Alert me of new notes |
CANSLIM.net Company Profile |
SEC |
Zacks Reports |
StockTalk |
News |
Chart |
Request a new note
C
A N
S L
I M
|
LNKD
-
NYSE
Linkedin Corp Class A
INTERNET - Internet Information Providers
|
$156.05
|
-4.39
-2.74% |
$161.70
|
2,051,636
95.39% of 50 DAV
50 DAV is 2,150,800
|
$165.20
-5.54%
|
2/8/2013
|
$147.04
|
PP = $127.55
|
|
MB = $133.93
|
 Most Recent Note - 2/25/2013 4:38:52 PM
G - Endured mild distributional today and finished near the session low. It remains perched only -5.5% off its all-time high, extended from any sound base. Disciplined investors may watch for secondary buy points or additional bases to possibly form and be noted in the weeks ahead.
>>> The latest Featured Stock Update with an annotated graph appeared on 2/8/2013. Click here.
View all notes |
Alert me of new notes |
CANSLIM.net Company Profile |
SEC |
Zacks Reports |
StockTalk |
News |
Chart |
Request a new note
C
A N
S L
I M
|
Symbol/Exchange
Company Name
Industry Group |
PRICE |
CHANGE
(%Change) |
Day High |
Volume
(% DAV)
(% 50 day avg vol) |
52 Wk Hi
% From Hi |
Featured
Date |
Price
Featured |
Pivot Featured |
|
Max Buy |
LOPE
-
NASDAQ
Grand Canyon Education
DIVERSIFIED SERVICES - Education and; Training Services
|
$24.76
|
-0.57
-2.25% |
$25.55
|
484,295
109.05% of 50 DAV
50 DAV is 444,100
|
$27.18
-8.90%
|
2/20/2013
|
$26.44
|
PP = $25.10
|
|
MB = $26.36
|
Most Recent Note - 2/25/2013 4:43:15 PM
Y - Closed near the session low today and edged further below its pivot point raising concerns. It was featured in the 2/20/13 mid-day report (read here) and that evening more details and an annotated graph were included under the headline, "Follow Up Gains on Higher Volume Clinched Technical Breakout".
>>> The latest Featured Stock Update with an annotated graph appeared on 2/20/2013. Click here.
View all notes |
Alert me of new notes |
CANSLIM.net Company Profile |
SEC |
Zacks Reports |
StockTalk |
News |
Chart |
Request a new note
C
A N
S L
I M
|
MIDD
-
NASDAQ
Middleby Corp
MANUFACTURING - Diversified Machinery
|
$144.13
|
-4.31
-2.90% |
$150.52
|
140,015
154.37% of 50 DAV
50 DAV is 90,700
|
$152.10
-5.24%
|
10/8/2012
|
$118.46
|
PP = $122.67
|
|
MB = $128.80
|
Most Recent Note - 2/25/2013 4:45:43 PM
G - Reversed early gains today and finished near the session low with a damaging loss on above average volume. Fundamental concerns were recently noted and prior reports cautioned members that it is extended from any sound base. Its 50 DMA line defines important near-term chart support above prior highs in the $134-135 area.
>>> The latest Featured Stock Update with an annotated graph appeared on 2/25/2013. Click here.
View all notes |
Alert me of new notes |
CANSLIM.net Company Profile |
SEC |
Zacks Reports |
StockTalk |
News |
Chart |
Request a new note
C
A N
S L
I M
|
N
-
NYSE
Netsuite Inc
DIVERSIFIED SERVICES - Business/Management Services
|
$67.36
|
-1.47
-2.14% |
$69.19
|
222,644
63.63% of 50 DAV
50 DAV is 349,900
|
$75.75
-11.08%
|
12/12/2012
|
$64.75
|
PP = $67.12
|
|
MB = $70.48
|
Most Recent Note - 2/22/2013 7:45:35 PM
G - Posted a small gain on light volume today while consolidating above its 50 DMA line ($67.41 now). Damaging losses below that short-term average or the recent low ($65.31 on 2/13/13) may trigger technical sell signals. Concerns were raised following a worrisome "negative reversal" on 2/01/13 after initially gapping up for a new 52-week high, and recent notes have repeatedly cautioned - "Reported earnings +20% on +33% sales revenues for the Dec '12 quarter, below the +25% minimum earnings guideline (C criteria) raising fundamental concerns."
>>> The latest Featured Stock Update with an annotated graph appeared on 2/5/2013. Click here.
View all notes |
Alert me of new notes |
CANSLIM.net Company Profile |
SEC |
Zacks Reports |
StockTalk |
News |
Chart |
Request a new note
C
A N
S L
I M
|
NSR
-
NYSE
Neustar Inc
TELECOMMUNICATIONS - Diversified Communication Serv
|
$43.54
|
-1.43
-3.18% |
$45.21
|
380,373
80.83% of 50 DAV
50 DAV is 470,600
|
$47.24
-7.83%
|
12/11/2012
|
$41.85
|
PP = $41.41
|
|
MB = $43.48
|
Most Recent Note - 2/25/2013 4:34:05 PM
G - Loss today led to a close below its 50 DMA line and it finished near the session low. Damaging loss on 2/21/13 with heavy volume raised concerns and triggered a technical sell signal.
>>> The latest Featured Stock Update with an annotated graph appeared on 2/1/2013. Click here.
View all notes |
Alert me of new notes |
CANSLIM.net Company Profile |
SEC |
Zacks Reports |
StockTalk |
News |
Chart |
Request a new note
C
A N
S L
I M
|
SFUN
-
NYSE
Soufun Hldgs Ltd Ads A
INTERNET - Internet Information Providers
|
$25.60
|
-1.32
-4.90% |
$27.49
|
330,121
107.22% of 50 DAV
50 DAV is 307,900
|
$29.16
-12.21%
|
2/11/2013
|
$27.46
|
PP = $29.26
|
|
MB = $30.72
|
Most Recent Note - 2/25/2013 4:31:38 PM
G - Slumped back below its 50 DMA line today and finished near the session low. Color code is changed to green again. It still needs to produce gains above its pivot point before buying efforts may be justified under the fact-based system.
>>> The latest Featured Stock Update with an annotated graph appeared on 2/11/2013. Click here.
View all notes |
Alert me of new notes |
CANSLIM.net Company Profile |
SEC |
Zacks Reports |
StockTalk |
News |
Chart |
Request a new note
C
A N
S L
I M
|
Symbol/Exchange
Company Name
Industry Group |
PRICE |
CHANGE
(%Change) |
Day High |
Volume
(% DAV)
(% 50 day avg vol) |
52 Wk Hi
% From Hi |
Featured
Date |
Price
Featured |
Pivot Featured |
|
Max Buy |
VRX
-
NYSE
Valeant Pharmaceuticals
DRUGS - Drug Manufacturers - Other
|
$65.46
|
-0.28
-0.43% |
$66.60
|
1,047,789
77.17% of 50 DAV
50 DAV is 1,357,800
|
$67.98
-3.71%
|
12/20/2012
|
$60.24
|
PP = $61.21
|
|
MB = $64.27
|
Most Recent Note - 2/22/2013 7:44:05 PM
G - Consolidating just -3.3% off its 52-week high after losses on near average volume this week tested support at the previously noted upward trendline connecting its November - December lows. Its 50 DMA line (now $63.52) defines the next important support area to watch.
>>> The latest Featured Stock Update with an annotated graph appeared on 2/15/2013. Click here.
View all notes |
Alert me of new notes |
CANSLIM.net Company Profile |
SEC |
Zacks Reports |
StockTalk |
News |
Chart |
Request a new note
C
A N
S L
I M
|
|
|
|
THESE ARE NOT BUY RECOMMENDATIONS!
Comments contained in the body of this report are technical
opinions only. The material herein has been obtained
from sources believed to be reliable and accurate, however,
its accuracy and completeness cannot be guaranteed.
This site is not an investment advisor, hence it does
not endorse or recommend any securities or other investments.
Any recommendation contained in this report may not
be suitable for all investors and it is not to be deemed
an offer or solicitation on our part with respect to
the purchase or sale of any securities. All trademarks,
service marks and trade names appearing in this report
are the property of their respective owners, and are
likewise used for identification purposes only.
This report is a service available
only to active Paid Premium Members.
You may opt-out of receiving report notifications
at any time. Questions or comments may be submitted
by writing to Premium Membership Services 665 S.E. 10 Street, Suite 201 Deerfield Beach, FL 33441-5634 or by calling 1-800-965-8307
or 954-785-1121.
|
|
|

