You are not logged in.
This means you
CAN ONLY VIEW reports that were published prior to Monday, February 26, 2024.
You
MUST UPGRADE YOUR MEMBERSHIP if you want to see any current reports.
AFTER MARKET UPDATE - MONDAY, FEBRUARY 24TH, 2020
Previous After Market Report Next After Market Report >>>
|
|
|
|
DOW |
-1,031.61 |
27,960.80 |
-3.56% |
|
Volume |
1,187,191,990 |
+12% |
|
Volume |
3,177,927,900 |
+16% |
|
NASDAQ |
-355.31 |
9,221.28 |
-3.71% |
|
Advancers |
292 |
10% |
|
Advancers |
461 |
14% |
|
S&P 500 |
-111.86 |
3,225.89 |
-3.35% |
|
Decliners |
2,618 |
90% |
|
Decliners |
2,785 |
86% |
|
Russell 2000 |
-50.50 |
1,628.10 |
-3.01% |
|
52 Wk Highs |
86 |
|
|
52 Wk Highs |
74 |
|
|
S&P 600 |
-29.57 |
980.05 |
-2.93% |
|
52 Wk Lows |
245 |
|
|
52 Wk Lows |
186 |
|
|
 |
Breadth Decisively Bearish as Volume Swells and Major Indices Drop
Kenneth J. Gruneisen - Passed the CAN SLIM® Master's Exam
The Dow and S&P 500 each erased their year-to-date gain, with both benchmarks registering the largest decline since February 2018. The Dow fell 1,031 points, while the S&P 500 dropped 3.4%. The Nasdaq Composite was down 3.7%. Breadth was decisively negative as decliners led advancers by almost a 9-1 margin on the NYSE and by 6-1 on the Nasdaq exchange. The reported volume totals were higher than the prior session totals on the NYSE and on the Nasdaq exchange, indicative of distributional pressure. Leadership thinned as there were only 12 high-ranked companies from the Leaders List that hit a new 52-week high and were listed on the BreakOuts Page, down from the 139 on last Wednesday's session. New 52-week lows totals also expanded and solidly outnumbered new 52-week highs on the NYSE and on the Nasdaq exchange. The major indices' (M criteria) have seen the prior uptrend come under heavier pressure. Disciplined investors know to watch for technical sell signals on a case-by-case basis and stand ready to reduce exposure especially if the market suffers more damaging losses. The Featured Stocks Page provides the most timely analysis on high-ranked leaders. Charts used courtesy of www.stockcharts.com
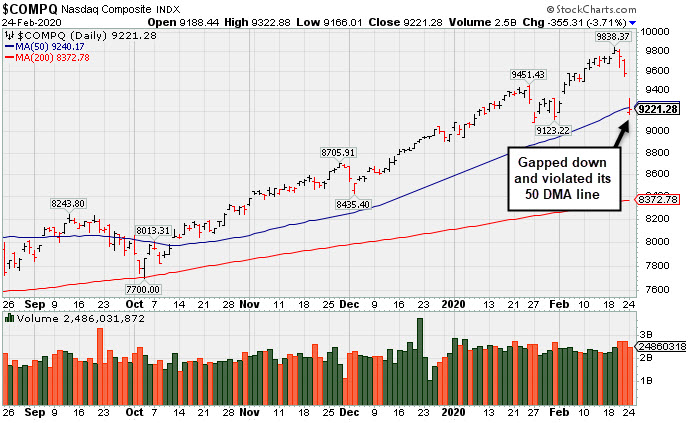
PICTURED: The Nasdaq Composite Index is -6.3% off its all-time high after 3 consecutive losses. It gapped down and violated its 50-day moving average (DMA) line, and the other major indices also did so, decisively.
U.S. stocks experienced their worst session in two years on Monday, amid heightened anxiety surrounding the coronavirus and its potential drag on the global economy. The rapid spread of the virus outside of China weighed on investor sentiment, with a spike in the number of confirmed cases particularly evident in South Korea and Italy.
The widespread uncertainty bolstered demand for perceived safe haven assets, with the yield on the 10-year U.S. Treasury note sliding 11 basis points to a four-year low of 1.36%, just shy of its all-time bottom of 1.32%. On the long end of the curve, the 30-year rate touched a record low of 1.81%. In commodities, COMEX gold added 0.3% to a seven-year high of $1,650.00/ounce. WTI crude dipped into bear market territory, losing 3.7% to $51.43/barrel. The CBOE Volatility Index (VIX) jumped to its highest level since January 2019.
All 11 S&P 500 sectors closed in negative territory, with the Energy and Technology groups falling more than 4% to lead the losses. Apple (AAPL -4.8%) fell after a report revealed smartphone sales in China dropped by more than a third last month. Chipmakers were broadly lower, with the Philadelphia Semiconductor Index (SOX) slumping 4.8%. Travel-centric shares also sold off, with airline stocks in the S&P 500 retreating 5.2%. |
 Kenneth J. Gruneisen started out as a licensed stockbroker in August 1987, a couple of months prior to the historic stock market crash that took the Dow Jones Industrial Average down -22.6% in a single day. He has published daily fact-based fundamental and technical analysis on high-ranked stocks online for two decades. Through FACTBASEDINVESTING.COM, Kenneth provides educational articles, news, market commentary, and other information regarding proven investment systems that work in good times and bad.
Comments contained in the body of this report are technical opinions only and are not necessarily those of Gruneisen Growth Corp. The material herein has been obtained from sources believed to be reliable and accurate, however, its accuracy and completeness cannot be guaranteed. Our firm, employees, and customers may effect transactions, including transactions contrary to any recommendation herein, or have positions in the securities mentioned herein or options with respect thereto. Any recommendation contained in this report may not be suitable for all investors and it is not to be deemed an offer or solicitation on our part with respect to the purchase or sale of any securities. |
|
 |
Energy, Tech, Financial, and Retail Indexes Fell
Kenneth J. Gruneisen - Passed the CAN SLIM® Master's Exam
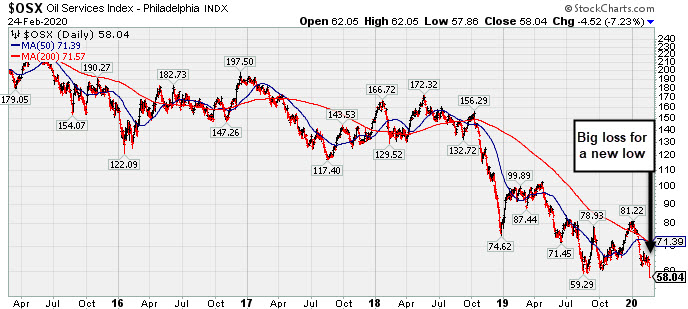
The Bank Index ($BKX -3.55%) and the Broker/Dealer Index ($XBD -3.69%) lost considerable ground along with the Retail Index ($RLX -3.42%). The Semiconductor Index ($SOX -4.75%) and the Networking Index ($NWX -3.34%) both outpaced the Biotech Index ($BTK -2.88%) to the downside. The Oil Services Index ($OSX -7.23%) and the Integrated Oil Index ($XOI -4.99%) also lost considerable ground, meanwhile, the Gold & Silver Index ($XAU +0.41%) edged higher and was a standout gainer.
PICTURED: The 5-year graph of the Oil Services Index ($OSX -7.23%) shows it suffering a big loss for a new low.
| Oil Services |
$OSX |
58.04 |
-4.52 |
-7.23% |
-25.87% |
| Integrated Oil |
$XOI |
1,064.64 |
-55.95 |
-4.99% |
-16.21% |
| Semiconductor |
$SOX |
1,801.23 |
-89.82 |
-4.75% |
-2.62% |
| Networking |
$NWX |
533.63 |
-18.41 |
-3.34% |
-8.53% |
| Broker/Dealer |
$XBD |
291.14 |
-11.15 |
-3.69% |
+0.26% |
| Retail |
$RLX |
2,554.56 |
-90.34 |
-3.42% |
+4.30% |
| Gold & Silver |
$XAU |
111.51 |
+0.45 |
+0.41% |
+4.29% |
| Bank |
$BKX |
104.17 |
-3.84 |
-3.56% |
-8.11% |
| Biotech |
$BTK |
5,149.80 |
-152.80 |
-2.88% |
+1.62% |
|
|
|
 |
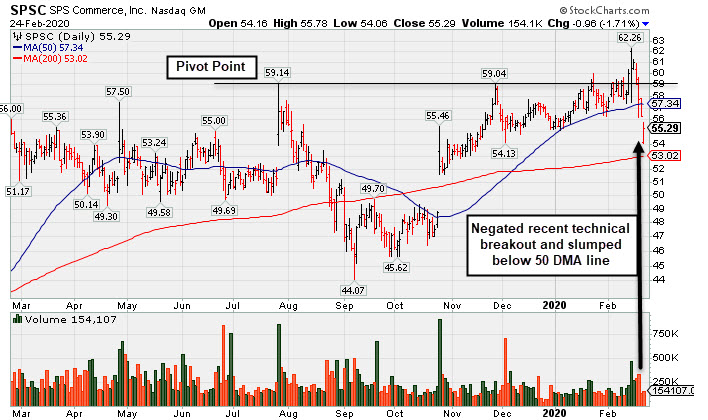
4 Damaging Losses Followed Recent Technical Breakout
Kenneth J. Gruneisen - Passed the CAN SLIM® Master's Exam
S P S Commerce Inc (SPSC -$0.96 or -1.71% to $55.29) pulled back for a 4th consecutive loss today following 4 consecutive gains for new all-time highs. It stalled soon after volume-driven gains above its pivot point had triggered a new technical buy signal. Losses violating its 50-day moving average triggered a technical sell signal, and a rebound above that important short-term average ($57.34) is needed for its outlook to improve.
SPSC is 11.2% off its all-time high. Its current Relative Strength Rating of 54 is below the 80+ minimum guideline for buy candidates. The high-ranked Computer Software firm was highlighted in yellow with new pivot point cited based on its 7/26/19 high plus 10 cents in the 11/29/19 mid-day report (read here). It was last shown in this FSU section on 2/03/20 with an annotated graph under the headline, "Perched Near High Finding Support at 50-Day Average".
A 2:1 split impacted share price on 8/23/19. Fundamentals remain strong. Reported earnings +30% on +12% sales revenues for the Dec '19 quarter versus the year ago period, and 3 of the past 4 quarterly comparisons were above the +25% minimum earnings guideline (C criteria). A small downturn in FY '16 earnings was previously noted as a flaw in its annual earnings (A criteria) history.
The number of top-rated funds owning its shares rose from 238 in Mar '18 to 490 in Dec '19, a reassuring sign concerning the I criteria. Its current Up/Down Volume Ratio of 1.4 is an unbiased indication its shares have been under accumulation over the past 50 days. It has a Timeliness Rating of Band Sponsorship Rating of D. The small supply of 34.8 million shares outstanding (S criteria) can contribute to greater price volatility in the even of institutional buying or selling.
Charts courtesy of www.stockcharts.com
 |
|
|
Color Codes Explained :
Y - Better candidates highlighted by our
staff of experts.
G - Previously featured
in past reports as yellow but may no longer be buyable under the
guidelines.
***Last / Change / Volume data in this table is the closing quote data***
Symbol/Exchange
Company Name
Industry Group |
PRICE |
CHANGE
(%Change) |
Day High |
Volume
(% DAV)
(% 50 day avg vol) |
52 Wk Hi
% From Hi |
Featured
Date |
Price
Featured |
Pivot Featured |
|
Max Buy |
 FTNT
-
NASDAQ
FTNT
-
NASDAQ
Fortinet Inc
Computer Sftwr-Security
|
$108.70
|
-5.78
-5.05% |
$110.61
|
1,703,245
150.07% of 50 DAV
50 DAV is 1,135,000
|
$121.82
-10.77%
|
12/9/2019
|
$103.85
|
PP = $106.10
|
|
MB = $111.41
|
 Most Recent Note - 2/24/2020 6:46:05 PM
G - Gapped down today violating the 50 DMA line ($113.87) and prior low ($112.06) with a big loss on higher volume triggering technical sell signals. Reported earnings +29% on +21% sales revenues for the Dec '19 quarter, continuing its strong earnings track record above the +25% minimum guideline (C criteria).
>>> FEATURED STOCK ARTICLE : Fortinet Posted Gain for Best-Ever Close - 2/4/2020 |
View all notes |
Set NEW NOTE alert |
Company Profile |
SEC
News |
Chart |
Request a new note
C
A
S
I |
SPSC
-
NASDAQ
S P S Commerce Inc
COMPUTER SOFTWARE and SERVICES - Application Software
|
$55.29
|
-0.96
-1.71% |
$55.78
|
154,107
92.06% of 50 DAV
50 DAV is 167,400
|
$62.26
-11.19%
|
11/29/2019
|
$56.59
|
PP = $59.24
|
|
MB = $62.20
|
Most Recent Note - 2/24/2020 6:40:52 PM
G - Color code is changed to green after a 4th consecutive loss, and it violated its 50 DMA line ($57.34) while retreating abruptly from its all-time high. Fundamentals remain strong. Its current Relative Strength Rating of 54 is below the 80+ minimum guideline for buy candidates. See the latest FSU analysis for more details and a new annotated graph.
>>> FEATURED STOCK ARTICLE : 4 Damaging Losses Followed Recent Technical Breakout - 2/24/2020 |
View all notes |
Set NEW NOTE alert |
Company Profile |
SEC
News |
Chart |
Request a new note
C
A
S
I |
AUDC
-
NASDAQ
Audiocodes Ltd
ELECTRONICS - Scientific and Technical Instrum
|
$24.35
|
-0.77
-3.07% |
$24.58
|
393,148
111.06% of 50 DAV
50 DAV is 354,000
|
$28.73
-15.25%
|
9/13/2019
|
$19.68
|
PP = $19.84
|
|
MB = $20.83
|
Most Recent Note - 2/20/2020 5:09:15 PM
G - Rebounded above its 50 DMA line ($24.95) with today's gain. Still faces resistance due to overhead supply up to the $28 level. Fundamentals remain strong after it reported earnings +30% on +15% sales revenues for the Dec '19 quarter.
>>> FEATURED STOCK ARTICLE : Rebounding After Damaging Losses Triggered Sell Signals - 2/14/2020 |
View all notes |
Set NEW NOTE alert |
Company Profile |
SEC
News |
Chart |
Request a new note
C
A
S
I |
CHDN
-
NASDAQ
Churchill Downs Inc
LEISURE - Gaming Activities
|
$156.86
|
-4.38
-2.72% |
$158.91
|
286,185
146.01% of 50 DAV
50 DAV is 196,000
|
$167.53
-6.37%
|
10/8/2019
|
$129.77
|
PP = $132.83
|
|
MB = $139.47
|
Most Recent Note - 2/24/2020 6:31:35 PM
G - Perched only -6.4% off its 52-week high following a streak of gains. Its 50 DMA line ($144) defines near-term support. Due to report Dec '19 earnings news on 2/26/20. The Jun and Sep '19 quarterly earnings versus the year ago periods were both below the +25% minimum guideline (C criteria) and raised fundamental concerns.
>>> FEATURED STOCK ARTICLE : Perched at New Record High After Recent Gains on Average Volume - 2/7/2020 |
View all notes |
Set NEW NOTE alert |
Company Profile |
SEC
News |
Chart |
Request a new note
C
A
S
I |
LULU
-
NASDAQ
Lululemon Athletica
MANUFACTURING - Textile Manufacturing
|
$246.21
|
-9.69
-3.79% |
$247.87
|
1,874,027
103.20% of 50 DAV
50 DAV is 1,816,000
|
$266.20
-7.51%
|
9/6/2019
|
$201.25
|
PP = $194.35
|
|
MB = $204.07
|
Most Recent Note - 2/24/2020 6:33:36 PM
G - Finished near the session high today after a gap down tested its 50 DMA line ($239.97) and prior low ($231.84 on 1/27/20). Fundamentals remain strong. More damaging losses would raise concerns.
>>> FEATURED STOCK ARTICLE : Perched at Record High After 4th Consecutive Gain on Light Volume - 2/20/2020 |
View all notes |
Set NEW NOTE alert |
Company Profile |
SEC
News |
Chart |
Request a new note
C
A
S
I |
Symbol/Exchange
Company Name
Industry Group |
PRICE |
CHANGE
(%Change) |
Day High |
Volume
(% DAV)
(% 50 day avg vol) |
52 Wk Hi
% From Hi |
Featured
Date |
Price
Featured |
Pivot Featured |
|
Max Buy |
CPRT
-
NASDAQ
Copart Inc
SPECIALTY RETAIL - Auto Dealerships
|
$92.77
|
-2.48
-2.60% |
$94.59
|
3,273,383
191.09% of 50 DAV
50 DAV is 1,713,000
|
$104.88
-11.55%
|
1/2/2020
|
$92.80
|
PP = $92.51
|
|
MB = $97.14
|
Most Recent Note - 2/24/2020 6:50:07 PM
G - Violated its 50 DMA line ($96.44) triggering a technical sell signal during a streak of 3 consecutive volume-driven losses, retreating abruptly from its all-time high. Reported earnings +25% on +19% sales revenues for the Jan '20 quarter. Testing prior highs in the $91-92 area noted as the next important support level.
>>> FEATURED STOCK ARTICLE : Perched at Record High With Earnings News Due - 2/18/2020 |
View all notes |
Set NEW NOTE alert |
Company Profile |
SEC
News |
Chart |
Request a new note
C
A
S
I |
SPLK
-
NASDAQ
Splunk Inc
Computer Sftwr-Database
|
$160.05
|
-7.02
-4.20% |
$162.23
|
2,029,788
134.60% of 50 DAV
50 DAV is 1,508,000
|
$176.31
-9.22%
|
11/25/2019
|
$147.79
|
PP = $142.16
|
|
MB = $149.27
|
Most Recent Note - 2/21/2020 5:05:23 PM
G - Pulled back for a big loss today with higher volume, retreating from its all-time high. It is extended from the previously noted base. Its 50 DMA line ($157) defines important support to watch on pullbacks.
>>> FEATURED STOCK ARTICLE : Perched at Record High After 7th Consecutive Gain - 2/19/2020 |
View all notes |
Set NEW NOTE alert |
Company Profile |
SEC
News |
Chart |
Request a new note
C
A
S
I |
PAYC
-
NYSE
Paycom Software Inc
COMPUTER SOFTWARE and SERVICES - Application Software
|
$295.77
|
-4.62
-1.54% |
$299.00
|
1,045,557
115.53% of 50 DAV
50 DAV is 905,000
|
$342.00
-13.52%
|
11/20/2019
|
$252.97
|
PP = $259.81
|
|
MB = $272.80
|
Most Recent Note - 2/20/2020 5:12:26 PM
G - Pulled back today with near average volume after 5 consecutive gains. Its 50 DMA line ($289.56) and prior low ($288.10 on 2/06/20) define near-term support. More damaging losses would raise concerns and trigger a technical sell signal. Fundamentals remain strong after it reported earnings +41% on +29% for the Dec '19 quarter.
>>> FEATURED STOCK ARTICLE : Pulled Back Near 50-Day Average Following Strong Earnings Report - 2/11/2020 |
View all notes |
Set NEW NOTE alert |
Company Profile |
SEC
News |
Chart |
Request a new note
C
A
S
I |
BLD
-
NYSE
Topbuild Corp
Bldg-Constr Prds/Misc
|
$120.78
|
-2.23
-1.81% |
$122.13
|
371,657
129.95% of 50 DAV
50 DAV is 286,000
|
$125.66
-3.88%
|
12/9/2019
|
$109.71
|
PP = $113.84
|
|
MB = $119.53
|
Most Recent Note - 2/24/2020 6:47:48 PM
G - Stubbornly holding its ground near its 52-week high and above its "max buy" level. Prior high ($113.74) defines near-term support above its 50 DMA line ($110.86).
>>> FEATURED STOCK ARTICLE : Volume Totals Cooling While Consolidating Near All-Time High - 2/6/2020 |
View all notes |
Set NEW NOTE alert |
Company Profile |
SEC
News |
Chart |
Request a new note
C
A
S
I |
TEAM
-
NASDAQ
Atlassian Corp Plc Cl A
Comp Sftwr-Spec Enterprs
|
$147.11
|
+1.18
0.81% |
$147.75
|
2,167,157
138.39% of 50 DAV
50 DAV is 1,566,000
|
$156.12
-5.77%
|
1/24/2020
|
$144.66
|
PP = $140.49
|
|
MB = $147.51
|
Most Recent Note - 2/24/2020 6:36:57 PM
Y - Color code is changed to yellow as it managed a "positive reversal" today after undercutting its "max buy" level amid widespread weakness. Fundamentals remain strong.
>>> FEATURED STOCK ARTICLE : Atlassian Has Been Hovering Near its All-Time High - 2/12/2020 |
View all notes |
Set NEW NOTE alert |
Company Profile |
SEC
News |
Chart |
Request a new note
C
A
S
I |
Symbol/Exchange
Company Name
Industry Group |
PRICE |
CHANGE
(%Change) |
Day High |
Volume
(% DAV)
(% 50 day avg vol) |
52 Wk Hi
% From Hi |
Featured
Date |
Price
Featured |
Pivot Featured |
|
Max Buy |
GLOB
-
NYSE
Globant SA
Computer-Tech Services
|
$123.27
|
-11.55
-8.57% |
$127.68
|
632,412
245.12% of 50 DAV
50 DAV is 258,000
|
$141.67
-12.99%
|
11/14/2019
|
$106.87
|
PP = $112.43
|
|
MB = $118.05
|
Most Recent Note - 2/24/2020 12:39:16 PM
G - Gapped down today retreating from its all-time high hit on the prior session. Reported earnings +28% on +32% sales revenues for the Dec '19 quarter, continuing its strong earnings track record. It is extended from any sound base. Its 50 DMA line ($116.37) and prior high ($112.33) define important near-term support to watch.
>>> FEATURED STOCK ARTICLE : Encountering Distributional Pressure After Wedging to New Highs - 2/5/2020 |
View all notes |
Set NEW NOTE alert |
Company Profile |
SEC
News |
Chart |
Request a new note
C
A
S
I |
STNE
-
NASDAQ
Stoneco Ltd Cl A
Finance-CrdtCard/PmtPr
|
$41.78
|
-1.70
-3.91% |
$42.49
|
2,222,961
130.46% of 50 DAV
50 DAV is 1,704,000
|
$45.72
-8.62%
|
1/22/2020
|
$43.94
|
PP = $45.72
|
|
MB = $48.01
|
Most Recent Note - 2/24/2020 6:42:09 PM
Y - Found impressive support near its 50 DMA line ($41). Subsequent gains above the pivot point backed by at least +40% above average volume are needed to trigger a technical buy signal.
>>> FEATURED STOCK ARTICLE : 50-Day Moving Average Line Violation Hurts Outlook - 2/10/2020 |
View all notes |
Set NEW NOTE alert |
Company Profile |
SEC
News |
Chart |
Request a new note
C
A
S
I |
DAVA
-
NYSE
Endava Plc Cl A Ads
Computer-Tech Services
|
$52.00
|
-3.50
-6.31% |
$54.00
|
185,037
169.76% of 50 DAV
50 DAV is 109,000
|
$55.75
-6.73%
|
2/13/2020
|
$53.71
|
PP = $49.86
|
|
MB = $52.35
|
Most Recent Note - 2/24/2020 6:44:38 PM
Y - Gapped down today retreating from its all-time high following 4 consecutive volume-driven gains. Color code is changed to yellow after retreating below its "max buy" level. Prior highs in the $49 area define initial support to watch above its 50 DMA line ($47.91).
>>> FEATURED STOCK ARTICLE : Breakout Gain Backed By +462% Above Average Volme - 2/13/2020 |
View all notes |
Set NEW NOTE alert |
Company Profile |
SEC
News |
Chart |
Request a new note
C
A
S
I |
|
|
|
THESE ARE NOT BUY RECOMMENDATIONS!
Comments contained in the body of this report are technical
opinions only. The material herein has been obtained
from sources believed to be reliable and accurate, however,
its accuracy and completeness cannot be guaranteed.
This site is not an investment advisor, hence it does
not endorse or recommend any securities or other investments.
Any recommendation contained in this report may not
be suitable for all investors and it is not to be deemed
an offer or solicitation on our part with respect to
the purchase or sale of any securities. All trademarks,
service marks and trade names appearing in this report
are the property of their respective owners, and are
likewise used for identification purposes only.
This report is a service available
only to active Paid Premium Members.
You may opt-out of receiving report notifications
at any time. Questions or comments may be submitted
by writing to Premium Membership Services 665 S.E. 10 Street, Suite 201 Deerfield Beach, FL 33441-5634 or by calling 1-800-965-8307
or 954-785-1121.
|
|
|