You are not logged in.
This means you
CAN ONLY VIEW reports that were published prior to Monday, April 14, 2025.
You
MUST UPGRADE YOUR MEMBERSHIP if you want to see any current reports.
AFTER MARKET UPDATE - WEDNESDAY, FEBRUARY 24TH, 2010
Previous After Market Report Next After Market Report >>>
|
|
|
|
DOW |
+91.75 |
10,374.16 |
+0.89% |
|
Volume |
1,007,403,070 |
-7% |
|
Volume |
2,146,998,560 |
-7% |
|
NASDAQ |
+22.46 |
2,235.90 |
+1.01% |
|
Advancers |
2,217 |
71% |
|
Advancers |
1,670 |
59% |
|
S&P 500 |
+10.64 |
1,105.24 |
+0.97% |
|
Decliners |
823 |
26% |
|
Decliners |
1,003 |
36% |
|
Russell 2000 |
+5.36 |
630.43 |
+0.86% |
|
52 Wk Highs |
138 |
|
|
52 Wk Highs |
88 |
|
|
S&P 600 |
+3.24 |
336.03 |
+0.97% |
|
52 Wk Lows |
7 |
|
|
52 Wk Lows |
15 |
|
|
 |
Gains On Lighter Volume Reveal Low Level Of Buying Conviction
Adam Sarhan, Contributing Writer,
The major averages rallied for gains on the 13th day of the current rally attempt however volume, a critical gauge of institutional demand, fell compared to Tuesday's totals. Advancers led decliners by nearly a 3-to-1 ratio on the NYSE and by a 3-to-2 ratio on the Nasdaq exchange. New 52-week highs outnumbered new lows on both exchanges. There were 14 high-ranked companies from the CANSLIM.net Leaders List that made a new 52-week high and appeared on the CANSLIM.net BreakOuts Page, higher than the 10 issues that appeared on the prior session.
Federal Reserve Chairman Ben S. Bernanke spent the day testifying on Capital Hill. His comments helped send stocks higher and the dollar lower after he said the central bank will keep interest rates low to ensure the economy continues to recover. Bernanke told Congress that the Fed will eventually need to tighten monetary policy however we are still in the “nascent” stages of the economic rebound which still requires low interest rates for an extended period. This helped allay concerns that the Fed will begin raising rates more aggressively after last week's surprise discount rate hike. The Fed has left its federal funds rate, the rate banks charge each other for overnight loans, at a record low near zero for more than 14 months as the economy continues to recover.
Elsewhere, it was disconcerting to see US home sales unexpectedly drop to a record low. The tepid reading illustrates how weak this recovery actually is. In Washington D.C., the Senate approved a $15 billion plan to give companies tax breaks for hiring people. The Senate passed the jobs bill today by 70-28. The bill will now make its way to the House where Democratic leaders must decide whether to pass it without changes or to try to merge it with a $150 billion jobs bill it approved in December.
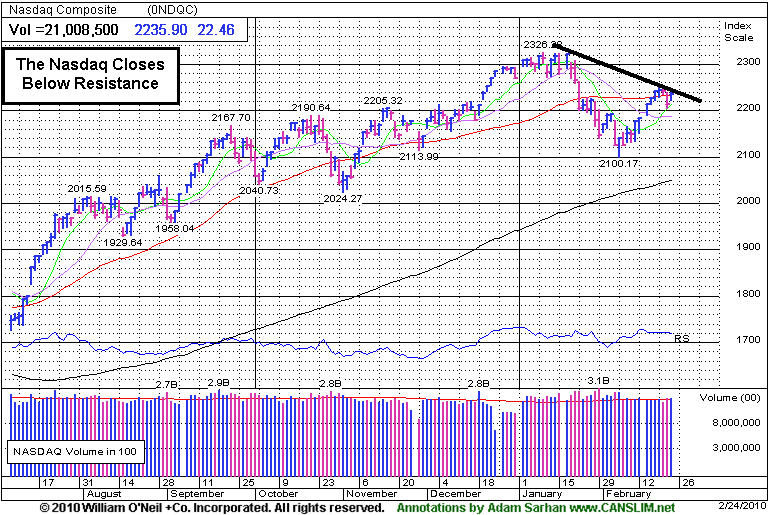
Looking at the market, Wednesday marked Day 13 of a new rally attempt which means that as long as the February 5th lows are not breached the window remains open for a new follow-through day (FTD) to emerge. A new follow-through day will confirm the current rally attempt and will be produced when one of the major averages rallies at least +1.7% on higher volume than the prior session as a new batch of leaders break out of fresh bases. However, if the February 5, 2010 lows are breached then the day count will be reset and a steeper correction may unfold. So far, the market’s reaction has been tepid at best to the latest round of economic and earnings data which remains a concern. Remember that the market remains in a correction until a new new follow-through day emerges. Until then, patience is paramount.
Professional Money Management Services - A Winning System - Inquire today!
Our skilled team of portfolio managers knows how to follow the rules of this fact-based investment system. We do not follow opinion or the "conviction list" of some large Wall Street institution which would have us fully invested even during horrific bear markets. Instead, we remain fluid and only buy the best stocks when they are triggering proper technical buy signals. If you are not completely satisfied with the way your portfolio is being managed, Click here to get connected with one of our portfolio managers. *Accounts over $250,000 please. ** Serious inquires only, please.
PICTURED: The Nasdaq Composite Index posted a gain to get back above its 50-day moving average (DMA) line, but it faces resistance at recent highs.
|
|
|
 |
Retail Index Roars To New Recovery High Close
Kenneth J. Gruneisen - Passed the CAN SLIM® Master's Exam
The Bank Index ($BKX +2.28%) and Retail Index ($RLX +1.96%) were among the best performing groups that had a positive influence on the major averages on Wednesday. Tech shares also had a positive impact as the Semiconductor Index ($SOX +1.92%) led the way higher while the Biotechnology Index ($BTK +1.26%), Networking Index ($NWX +1.24%), and Internet Index ($IIX +0.90%) posted unanimous gains. The Broker/Dealer Index ($XBD +0.58%), Healthcare Index ($HMO +0.92%), and Integrated Oil Index ($XOI +0.68%) also closed with modest gains. Meanwhile, the Gold & Silver Index ($XAU -0.66%) and Oil Services Index ($OSX -0.28%) lagged most other areas as they ended modestly lower.
Charts courtesy www.stockcharts.com
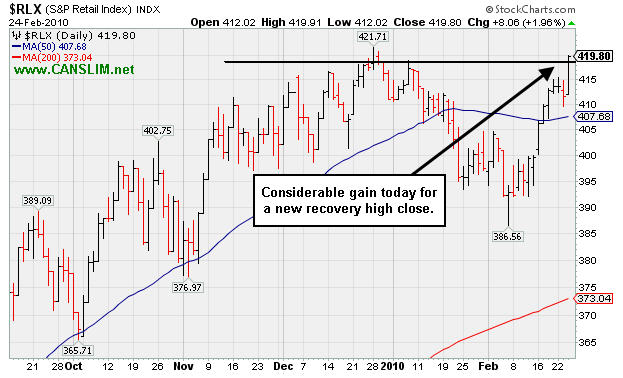
PICTURED: The Retail Index ($RLX +1.96%) posted a considerable gain today, rallying to a new recovery high close.
| Oil Services |
$OSX |
200.40 |
-0.57 |
-0.28% |
+2.81% |
| Healthcare |
$HMO |
1,412.02 |
+12.81 |
+0.92% |
-4.14% |
| Integrated Oil |
$XOI |
1,025.05 |
+6.94 |
+0.68% |
-4.04% |
| Semiconductor |
$SOX |
339.27 |
+6.40 |
+1.92% |
-5.73% |
| Networking |
$NWX |
236.36 |
+2.89 |
+1.24% |
+2.29% |
| Internet |
$IIX |
228.67 |
+2.05 |
+0.90% |
-2.22% |
| Broker/Dealer |
$XBD |
113.64 |
+0.65 |
+0.58% |
-1.23% |
| Retail |
$RLX |
419.80 |
+8.06 |
+1.96% |
+2.11% |
| Gold & Silver |
$XAU |
155.42 |
-1.04 |
-0.66% |
-7.63% |
| Bank |
$BKX |
47.49 |
+1.06 |
+2.28% |
+11.19% |
| Biotech |
$BTK |
1,034.46 |
+12.83 |
+1.26% |
+9.80% |
|
|
|
 |
Down Weeks On Volume Have Been Rare In This Strong Example
Kenneth J. Gruneisen - Passed the CAN SLIM® Master's Exam
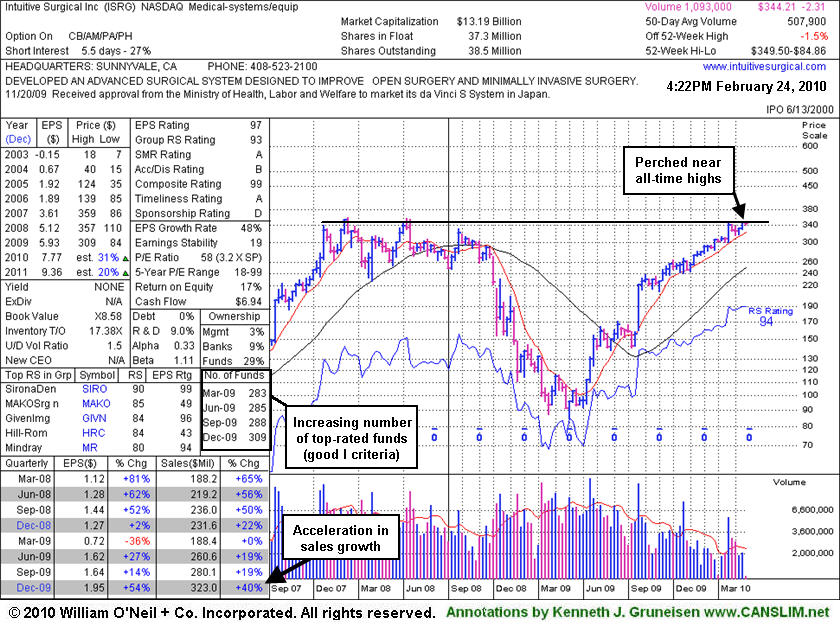
Intuitive Surgical Inc. (ISRG +$1.53 or +0.45% to $344.21) is quietly hovering near its 52-week high. The stock has barely encountered any distributional pressure, and its current Up/Down Volume Ratio of 1.5 provides an unbiased bullish statistic concerning its recent price/volume pattern. As the weekly graph below shows, down weeks with worrisome above average volume have been very rare since early-2009! The number of top-rated funds owning its shares has risen from 283 in Mar '09 to 320 in Dec '09, which is reassuring concerning the investment system's I criteria. ISRG was featured again most recently in the 1/22/10 mid-day report (read here), returning after some time off the Featured Stocks list. Subsequent gains into new high territory would have more serious bullish implications. The broader market (M criteria) outlook would be helped immensely by a powerful follow-through-day on higher volume from at least one of the major averages and better leadership to confirm a new rally of significance. Meanwhile, odds are less favorable for investors making profits with new buys, and caution is advised.
Its annual earnings history (the A criteria) has been very impressive. Although quarterly comparisons have not shown perfectly steady increases above the +25% guideline, the latest period ended December 31, 2009 showed an impressive acceleration in sales revenues and earnings growth. ISRG rebounded impressively from its March low ($84.86) and may be on course for its all-time high ($359 in 2007). Notes outlined technical deterioration before and when it was last dropped from the Featured Stocks list on 6/10/08. ISRG traded up more than 13-fold since first featured in yellow in CANSLIM.net reports in the summer of 2004.
|
|
|
Color Codes Explained :
Y - Better candidates highlighted by our
staff of experts.
G - Previously featured
in past reports as yellow but may no longer be buyable under the
guidelines.
***Last / Change / Volume quote data in this table corresponds with the timestamp on the note***
Symbol/Exchange
Company Name
Industry Group |
Last |
Chg. |
Vol
% DAV |
Date Featured |
Price Featured |
Latest Pivot Point
Featured |
Status |
| Latest Max Buy Price |
ARST
-
|
$26.97
|
+0.87
|
216,604
53% DAV
407,700
|
2/24/2010
(Date
Featured) |
$25.94
(Price
Featured) |
PP = $27.95 |
Y |
| MB = $29.35 |
Most Recent Note - 2/24/2010 4:51:57 PM
Y - Color code is changed to yellow with new pivot point noted based on the 1/14/10 high while it continues working on an 8-week "double bottom" type base. Gain today helped it stay above its 50 DMA line, while the next important support level to watch now is defined by its recent low ($22.58) and its 200 DMA line. ARST was first featured in yellow at $19.91 in the 9/01/09 mid-day report with an annotated daily graph (read here).
>>> The latest Featured Stock Update with an annotated graph appeared on 2/17/2010. click here.
|
|
C
A
S
I |
News |
Chart |
SEC
View all notes Alert
me of new notes
Company
Profile
|
ARUN
- NASDAQ
Aruba Networks Inc
COMPUTER HARDWARE - Networking & Communication Dev
|
$11.75
|
-0.21
|
1,455,756
114% DAV
1,274,700
|
2/19/2010
(Date
Featured) |
$12.71
(Price
Featured) |
PP = $11.94 |
Y |
| MB = $12.54 |
Most Recent Note - 2/24/2010 4:54:26 PM
Y - Consolidated to a close just under its pivot point today. Its 2/19/10 gap up gain on heavy volume was featured in the mid-day report (read here) as it rose from a flat base-on-base pattern above its 50-day moving average line. Quarterly earnings increases (excluding items - click here to read about "Q2 Loss" in the Business Journal) have been strong and sales revenues in the latest quarter ended Jan 31, 2010 showed impressive acceleration.
>>> The latest Featured Stock Update with an annotated graph appeared on 2/22/2010. click here.
|
|
C
A
S
I |
News |
Chart |
SEC
View all notes Alert
me of new notes
Company
Profile
|
BIDU
- NASDAQ
Baidu Inc Ads
INTERNET - Internet Information Providers
|
$505.47
|
+3.77
|
869,207
45% DAV
1,935,900
|
1/13/2010
(Date
Featured) |
$431.25
(Price
Featured) |
PP = $426.75 |
G |
| MB = $448.09 |
Most Recent Note - 2/24/2010 5:28:09 PM
G - Small gain today on light volume. In the past week it has been quietly wedging to new all-time highs, getting extended above its mid-January high. It did not form a recent sound base. Gapped up on 2/10/10 for a considerable gain with volume more than 3 times average.
>>> The latest Featured Stock Update with an annotated graph appeared on 2/11/2010. click here.
|
|
C
A
S
I |
News |
Chart |
SEC
View all notes Alert
me of new notes
Company
Profile
|
BRLI
- NASDAQ
Bio Reference Labs Inc
HEALTH SERVICES - Medical Laboratories & Researc
|
$40.79
|
+0.53
|
49,184
54% DAV
91,600
|
2/12/2010
(Date
Featured) |
$39.02
(Price
Featured) |
PP = $40.97 |
Y |
| MB = $43.02 |
Most Recent Note - 2/24/2010 5:33:33 PM
Y - Gain today with light volume another new high close, still below its pivot point. Its Up/Down Volume Ratio of 2.5 is a bullish indicator while consolidating for nearly 7-weeks above support at its 50 DMA line. This high-ranked Medical-Dental - Services firm was featured in yellow in the 2/12/10 mid-day report (read here). Earnings growth and sales revenues growth has accelerated, better than the +25% minimum guideline in recent quarters. Fundamentals are favorable with respect to the C and A criteria.
>>> The latest Featured Stock Update with an annotated graph appeared on 2/12/2010. click here.
|
|
C
A
S
I |
News |
Chart |
SEC
View all notes Alert
me of new notes
Company
Profile
|
CACC
- NASDAQ
Credit Acceptance Corp
FINANCIAL SERVICES - Credit Services
|
$41.32
|
+1.16
|
80,283
127% DAV
63,000
|
9/29/2009
(Date
Featured) |
$33.48
(Price
Featured) |
PP = $37.10 |
G |
| MB = $38.96 |
Most Recent Note - 2/24/2010 6:03:50 PM
G - Posted its best gain on heavier volume than any up session since 1/28/10 today. Volume totals cooled considerably while consolidating in a tight trading range in recent weeks. Holding its ground well above prior chart highs in the $37 area. This Financial firm's outlook is questionable until it trades back above its 50 DMA line.
>>> The latest Featured Stock Update with an annotated graph appeared on 2/9/2010. click here.
|
|
C
A
S
I |
News |
Chart |
SEC
View all notes Alert
me of new notes
Company
Profile
|
CRM
- NYSE
Salesforce.com Inc
INTERNET - Internet Software & Services
|
$69.44
|
+1.20
|
2,587,574
134% DAV
1,931,800
|
12/18/2009
(Date
Featured) |
$67.32
(Price
Featured) |
PP = $67.82 |
G |
| MB = $71.21 |
Most Recent Note - 2/24/2010 6:05:43 PM
G - Gain today on average volume, staying above its 50 DMA line. Recent chart low ($60.30 on 2/05/10) is an important support level to watch.
>>> The latest Featured Stock Update with an annotated graph appeared on 2/10/2010. click here.
|
|
C
A
S
I |
News |
Chart |
SEC
View all notes Alert
me of new notes
Company
Profile
|
EZPW
- NASDAQ
Ezcorp Inc Cl A
SPECIALTY RETAIL - Specialty Retail, Other
|
$19.86
|
+0.22
|
705,016
162% DAV
434,200
|
2/19/2010
(Date
Featured) |
$19.03
(Price
Featured) |
PP = $18.80 |
G |
| MB = $19.74 |
Most Recent Note - 2/24/2010 6:09:43 PM
G - Gain today with above average volume, closing just above its "max buy" level. Color code is changed to green. Gain on 2/22/10 with twice average volume triggered a technical buy signal. Featured in yellow in the 2/19/10 mid-day report (read here).
>>> The latest Featured Stock Update with an annotated graph appeared on 2/19/2010. click here.
|
|
C
A
S
I |
News |
Chart |
SEC
View all notes Alert
me of new notes
Company
Profile
|
GMCR
- NASDAQ
Green Mtn Coffee Roastrs
FOOD & BEVERAGE - Processed & Packaged Goods
|
$84.46
|
+3.34
|
2,502,920
177% DAV
1,410,300
|
12/28/2009
(Date
Featured) |
$77.49
(Price
Featured) |
PP = $76.50 |
G |
| MB = $80.33 |
Most Recent Note - 2/24/2010 6:13:17 PM
G - Gapped up today for a gain on heavy volume. This high-ranked leader has been base building above its 50 DMA line within close striking range of its 52-week high. Important initial support level to watch is recent lows in the $78 area.
>>> The latest Featured Stock Update with an annotated graph appeared on 2/23/2010. click here.
|
|
C
A
S
I |
News |
Chart |
SEC
View all notes Alert
me of new notes
Company
Profile
|
ISRG
- NASDAQ
Intuitive Surgical Inc
HEALTH SERVICES - Medical Appliances & Equipment
|
$344.21
|
+1.53
|
331,378
65% DAV
507,900
|
1/22/2010
(Date
Featured) |
$340.40
(Price
Featured) |
PP = $314.00 |
G |
| MB = $329.70 |
Most Recent Note - 2/24/2010 6:19:14 PM
G - Small gain on light volume today, perched near its 52-week high. Its 50 DMA line and recent chart lows in the $315 area define important technical support. ISRG was featured again most recently in the 1/22/10 mid-day report (read here).
>>> The latest Featured Stock Update with an annotated graph appeared on 2/24/2010. click here.
|
|
C
A
S
I |
News |
Chart |
SEC
View all notes Alert
me of new notes
Company
Profile
|
PCLN
- NASDAQ
Priceline.com Inc
INTERNET - Internet Software & Services
|
$399.55
|
-4.72
|
584,812
N/A
|
11/1/2002
(Date
Featured) |
$399.55
(Price
Featured) |
PP = $428.20 |
Y |
| MB = $449.61 |
Most Recent Note - 1/2/2011
Y - Returns to Featured Stocks list with its appearance in the January 2011 CANSLIM.net News including detailed analysis and annotated daily and weekly graphs.
>>> The latest Featured Stock Update with an annotated graph appeared on 2/18/2010. click here.
|
|
C
A
S
I |
News |
Chart |
SEC
View all notes Alert
me of new notes
Company
Profile
|
PEGA
- NASDAQ
Pegasystems Inc
COMPUTER SOFTWARE & SERVICES - Business Software & Services
|
$36.58
|
+0.04
|
202,790
97% DAV
209,600
|
1/4/2010
(Date
Featured) |
$34.00
(Price
Featured) |
PP = $36.19 |
G |
| MB = $38.00 |
Most Recent Note - 2/24/2010 6:23:09 PM
G - Held its ground today after a positive reversal on 2/23/10 for a small gain on heavy volume after gapping down following earnings news for the quarter ended Dec 31, 2009. Traded below its 50 DMA line intra-day and found prompt support near prior chart lows in the $32 area.
>>> The latest Featured Stock Update with an annotated graph appeared on 2/8/2010. click here.
|
|
C
A
S
I |
News |
Chart |
SEC
View all notes Alert
me of new notes
Company
Profile
|
SIRO
- NASDAQ
Sirona Dental Systems
HEALTH SERVICES - Medical Instruments & Supplies
|
$35.66
|
+0.04
|
308,736
53% DAV
581,100
|
2/16/2010
(Date
Featured) |
$36.43
(Price
Featured) |
PP = $36.15 |
Y |
| MB = $37.96 |
Most Recent Note - 2/24/2010 6:25:08 PM
Y - Quietly consolidating near its 52-week high, holding its ground above prior chart highs and well above its 50 DMA line since last week's pricing of another secondary offering of shares from which the company will not receive any proceeds. It was featured in yellow in the 2/16/10 mid-day report (read here) as it broke out from a 10-week flat base.
>>> The latest Featured Stock Update with an annotated graph appeared on 2/16/2010. click here.
|
|
C
A
S
I |
News |
Chart |
SEC
View all notes Alert
me of new notes
Company
Profile
|
|
|
|
THESE ARE NOT BUY RECOMMENDATIONS!
Comments contained in the body of this report are technical
opinions only. The material herein has been obtained
from sources believed to be reliable and accurate, however,
its accuracy and completeness cannot be guaranteed.
This site is not an investment advisor, hence it does
not endorse or recommend any securities or other investments.
Any recommendation contained in this report may not
be suitable for all investors and it is not to be deemed
an offer or solicitation on our part with respect to
the purchase or sale of any securities. All trademarks,
service marks and trade names appearing in this report
are the property of their respective owners, and are
likewise used for identification purposes only.
This report is a service available
only to active Paid Premium Members.
You may opt-out of receiving report notifications
at any time. Questions or comments may be submitted
by writing to Premium Membership Services 665 S.E. 10 Street, Suite 201 Deerfield Beach, FL 33441-5634 or by calling 1-800-965-8307
or 954-785-1121.
|
|
|


