You are not logged in.
This means you
CAN ONLY VIEW reports that were published prior to Monday, April 14, 2025.
You
MUST UPGRADE YOUR MEMBERSHIP if you want to see any current reports.
AFTER MARKET UPDATE - FRIDAY, FEBRUARY 22ND, 2013
Previous After Market Report Next After Market Report >>>
|
|
|
|
DOW |
+119.95 |
14,000.57 |
+0.86% |
|
Volume |
682,642,160 |
-16% |
|
Volume |
1,529,684,920 |
-23% |
|
NASDAQ |
+30.33 |
3,161.82 |
+0.97% |
|
Advancers |
2,246 |
73% |
|
Advancers |
1,785 |
69% |
|
S&P 500 |
+13.18 |
1,515.60 |
+0.88% |
|
Decliners |
733 |
24% |
|
Decliners |
674 |
26% |
|
Russell 2000 |
+10.76 |
916.16 |
+1.19% |
|
52 Wk Highs |
114 |
|
|
52 Wk Highs |
97 |
|
|
S&P 600 |
+4.92 |
512.53 |
+0.97% |
|
52 Wk Lows |
17 |
|
|
52 Wk Lows |
27 |
|
|
 |
Major Averages Rose With Light Volume Following Heavier Selling
Kenneth J. Gruneisen - Passed the CAN SLIM® Master's Exam
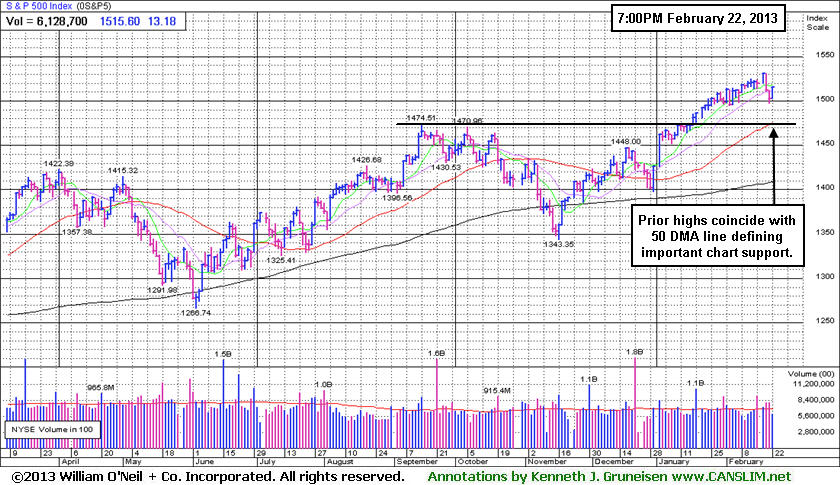
For the week, the Nasdaq Composite Index was down -0.9% and the S&P 500 Index broke a 7 week winning streak with a -0.3% loss, meanwhile the Dow Jones Industrial Average ended up by a mere +0.1%. The volume totals reported were lighter than the prior session on the NYSE and on the Nasdaq exchange and the totals were below average after 2 consecutive losses with above average volume totals.. Breadth was positive as advancers led decliners by more than 3-1 on the NYSE and nearly 3-1 on the Nasdaq exchange. The total number of stocks hitting new 52-week highs still outnumbered new 52-week lows on the NYSE and on the Nasdaq exchange. There were 22 high-ranked companies from the CANSLIM.net Leaders List making new 52-week highs and appearing on the CANSLIM.net BreakOuts Page, up from the prior session's total of only 9 stocks. There were of the 12 high-ranked companies currently included on the Featured Stocks Page.
The major averages recovered from a two day decline following positive data out of Europe. Stocks advanced after a report showed German business sentiment rose to a 10-month high in February. Equity markets were were higher from Friday's opening bell after regional Fed President James Bullard said the central bank's easy monetary policies would likely continue.
All 10 sectors in the S&P 500 were higher on the session led by tech. Shares of Hewlett-Packard Co (HPQ +12.28%) rose after reporting earnings that beat analyst estimates and encouraging full-year guidance. Texas Instruments (TXN +5.23%) rallied after the chipmaker increased its quarterly dividend and added $5 billion to its share buyback program. Financials and materials also outperformed as International Paper (IP +4.49%) posted a big gain while JP Morgan Chase & Co (JPM +1.37%) helped lead the financial space. In other news, Darden Restaurants Inc (DRI +3.33%) rose despite guiding full-year earnings below analysts' estimates. Insurer American International Group Inc (AIG +3.14%) rose on its better-than-expected quarterly results. Abercrombie & Fitch Co (ANF -4.46%) was the worst performing stock in the S&P 500 Friday as shares of the teen retailer fell after lowering its profit forecast.
Treasuries finished higher with the 10-year note up 1/16 of a point to yield 1.97%.
The market's (M criteria) uptrend has recently encountered distributional pressure. Leadership (stocks hitting new 52-week highs) has waned and several high-ranked leaders have recently triggered technical sell signals. Watch individual holdings closely and remain ready to reduce exposure. Only consider new buying efforts when all key criteria are solidly satisfied.
Watch for an announcement via email concerning the next WEBCAST. The webcast will also be available via an updated link highlighted at the top of the Premium Member Homepage.
PICTURED: The S&P 500 Index's prior highs and its 50-day moving average line coincide defining important chart support to watch.
|
 Kenneth J. Gruneisen started out as a licensed stockbroker in August 1987, a couple of months prior to the historic stock market crash that took the Dow Jones Industrial Average down -22.6% in a single day. He has published daily fact-based fundamental and technical analysis on high-ranked stocks online for two decades. Through FACTBASEDINVESTING.COM, Kenneth provides educational articles, news, market commentary, and other information regarding proven investment systems that work in good times and bad.
Comments contained in the body of this report are technical opinions only and are not necessarily those of Gruneisen Growth Corp. The material herein has been obtained from sources believed to be reliable and accurate, however, its accuracy and completeness cannot be guaranteed. Our firm, employees, and customers may effect transactions, including transactions contrary to any recommendation herein, or have positions in the securities mentioned herein or options with respect thereto. Any recommendation contained in this report may not be suitable for all investors and it is not to be deemed an offer or solicitation on our part with respect to the purchase or sale of any securities. |
|
 |
Financial, Tech, and Energy-Related Groups Rose
Kenneth J. Gruneisen - Passed the CAN SLIM® Master's Exam
Defensive groups fell as the Healthcare Index ($HMO -1.01%) and the Gold & Silver Index ($XAU -0.53%) were laggards on Friday's otherwise positive session. The Bank Index ($BKX +1.17%) and the Broker/Dealer Index ($XBD +1.39%) helped underpin the major averages as they advanced and the Retail Index ($RLX +0.38%) also posted a modest gain. The Semiconductor Index ($SOX +2.09%) and Biotechnology Index ($BTK +1.48%) led the tech sector while the Internet Index ($IIX +0.99%) and the Networking Index ($NWX +0.36%) followed with smaller gains. A bullish bias in energy-related shares boosted the Oil Services Index ($OSX +0.94%) and the Integrated Oil Index ($XOI +1.32%).
Charts courtesy www.stockcharts.com
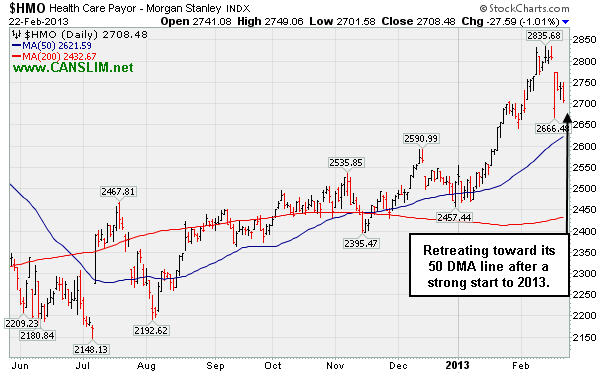
PICTURED: The Healthcare Index ($HMO -1.01%) is retreating toward its 50-day moving average (DMA) line after a strong start to 2013.
| Oil Services |
$OSX |
245.79 |
+2.28 |
+0.94% |
+11.64% |
| Healthcare |
$HMO |
2,708.48 |
-27.59 |
-1.01% |
+7.73% |
| Integrated Oil |
$XOI |
1,334.90 |
+17.42 |
+1.32% |
+7.49% |
| Semiconductor |
$SOX |
424.98 |
+8.71 |
+2.09% |
+10.65% |
| Networking |
$NWX |
238.12 |
+0.86 |
+0.36% |
+5.11% |
| Internet |
$IIX |
357.48 |
+3.50 |
+0.99% |
+9.32% |
| Broker/Dealer |
$XBD |
107.49 |
+1.47 |
+1.39% |
+13.95% |
| Retail |
$RLX |
696.44 |
+2.66 |
+0.38% |
+6.64% |
| Gold & Silver |
$XAU |
136.31 |
-0.73 |
-0.53% |
-17.69% |
| Bank |
$BKX |
54.50 |
+0.63 |
+1.17% |
+6.28% |
| Biotech |
$BTK |
1,669.84 |
+24.34 |
+1.48% |
+7.94% |
|
|
|
 |
Damaging Losses on Heavy Volume Violated Old Highs
Kenneth J. Gruneisen - Passed the CAN SLIM® Master's Exam
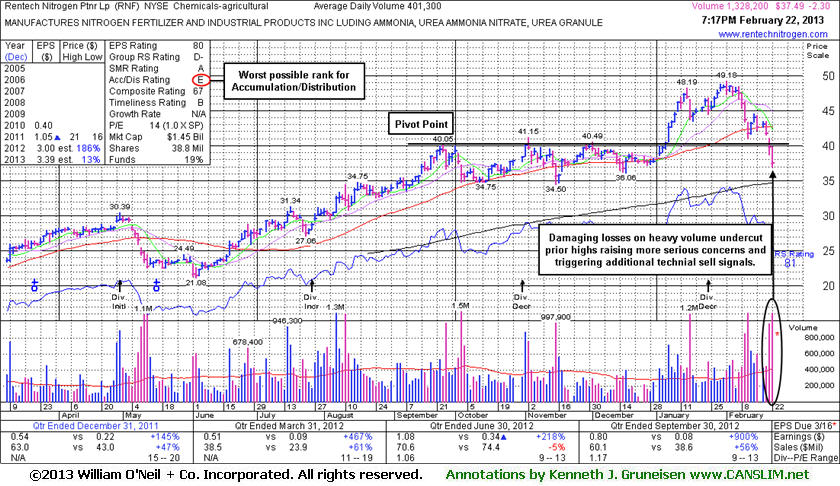
Rentech Nitrogen Ptnr LP (RNF -$2.30 or -5.78% to $37.49) fell today on heavy volume more than 3 times average following the prior session's gap down after violating its 50-day moving average (DMA) line. The more damaging losses late this week sent it below prior highs near $40-41 and they were volume-driven. The weak action raised serious concerns while triggering additional technical sell signals after showing signs of support near its 50-day moving average (DMA) line in the past week. It will be dropped from the Featured Stocks list tonight.
It was last shown in this FSU section on 2/12/13 with an annotated graph under the headline, "Violation of 50-Day Moving Average Came With Heavy Volume", and it was previously noted with caution - "The number of top-rated funds owning its shares had fallen from 52 in Jun '12 to 36 as of Dec '12, a disconcerting sign concerning the I criteria. It next earnings report is scheduled for Tuesday, March 19, 2013. Based on the weak technical action it has the worst possible Accumulation/Distribution rating of E (see red circle). Repeating a point emphasized before in this FSU section - "Disciplined investors avoid chasing extended stocks more than +5% above their pivot point. Making sloppy buy decisions by chasing extended stocks invites a much greater chance that an ordinary consolidation might prompt investors to invoke the investment system's strict loss-limiting sell rule after a pullback of -7% or more from their purchase price."
|
|
|
Color Codes Explained :
Y - Better candidates highlighted by our
staff of experts.
G - Previously featured
in past reports as yellow but may no longer be buyable under the
guidelines.
***Last / Change / Volume data in this table is the closing quote data***
Symbol/Exchange
Company Name
Industry Group |
PRICE |
CHANGE
(%Change) |
Day High |
Volume
(% DAV)
(% 50 day avg vol) |
52 Wk Hi
% From Hi |
Featured
Date |
Price
Featured |
Pivot Featured |
|
Max Buy |
CELG
-
NASDAQ
Celgene Corp
DRUGS - Drug Manufacturers - Major
|
$101.65
|
+2.22
2.23% |
$102.28
|
3,418,548
89.41% of 50 DAV
50 DAV is 3,823,600
|
$103.69
-1.97%
|
12/11/2012
|
$82.24
|
PP = $81.34
|
|
MB = $85.41
|
Most Recent Note - 2/21/2013 1:24:17 PM
G - Pulling back today following a worrisome "negative reversal" on the prior session, reversing into the red for a loss on heavy volume and closing near the session low after initial gains for new all-time highs. Its 50 DMA line (now $91.17) defines important support to watch on pullbacks.
>>> The latest Featured Stock Update with an annotated graph appeared on 2/4/2013. Click here.
View all notes |
Alert me of new notes |
CANSLIM.net Company Profile |
SEC |
Zacks Reports |
StockTalk |
News |
Chart |
Request a new note
C
A N
S L
I M


|
CFNL
-
NASDAQ
Cardinal Financial Corp
BANKING - Regional - Southeast Banks
|
$16.06
|
+0.04
0.25% |
$16.10
|
87,796
44.73% of 50 DAV
50 DAV is 196,300
|
$16.90
-4.97%
|
12/3/2012
|
$15.20
|
PP = $16.31
|
|
MB = $17.13
|
Most Recent Note - 2/21/2013 5:36:45 PM
G - Violated its 50 DMA line today with a loss on light volume triggering a technical sell signal. See the latest FSU analysis for more details and a new annotated graph.
>>> The latest Featured Stock Update with an annotated graph appeared on 2/21/2013. Click here.
View all notes |
Alert me of new notes |
CANSLIM.net Company Profile |
SEC |
Zacks Reports |
StockTalk |
News |
Chart |
Request a new note
C
A N
S L
I M
|
CMCSA
-
NASDAQ
Comcast Corp Cl A
MEDIA - CATV Systems
|
$39.91
|
-0.17
-0.42% |
$40.09
|
14,252,715
102.77% of 50 DAV
50 DAV is 13,869,000
|
$42.00
-4.98%
|
12/3/2012
|
$37.08
|
PP = $38.06
|
|
MB = $39.96
|
Most Recent Note - 2/19/2013 4:55:14 PM
G - Traded up today near its 52-week high hit during a streak of 5 consecutive gains backed by above average volume. Reported earnings +11% on +6% sales revenues for the Dec '12 quarter, below the +25% minimum earnings guideline (C criteria), raising fundamental concerns, yet bullish action has continued. See the latest FSU analysis for more details and a new annotated graph.
>>> The latest Featured Stock Update with an annotated graph appeared on 2/19/2013. Click here.
View all notes |
Alert me of new notes |
CANSLIM.net Company Profile |
SEC |
Zacks Reports |
StockTalk |
News |
Chart |
Request a new note
C
A N
S L
I M
|
KORS
-
NYSE
Michael Kors Hldgs Ltd
RETAIL - Apparel Stores
|
$59.11
|
+0.11
0.19% |
$59.95
|
6,343,507
125.88% of 50 DAV
50 DAV is 5,039,200
|
$65.10
-9.20%
|
1/23/2013
|
$54.98
|
PP = $58.72
|
|
MB = $61.66
|
Most Recent Note - 2/21/2013 1:28:56 PM
G - Gapped down for a 2nd consecutive session and another loss on heavy volume today. Completed another Secondary Offering on 2/20/13 while perched near its all-time high. Prior highs in the $58 area define important initial chart support to watch.
>>> The latest Featured Stock Update with an annotated graph appeared on 2/7/2013. Click here.
View all notes |
Alert me of new notes |
CANSLIM.net Company Profile |
SEC |
Zacks Reports |
StockTalk |
News |
Chart |
Request a new note
C
A N
S L
I M
|
LNKD
-
NYSE
Linkedin Corp Class A
INTERNET - Internet Information Providers
|
$160.44
|
+3.08
1.96% |
$160.95
|
1,720,537
79.41% of 50 DAV
50 DAV is 2,166,700
|
$165.20
-2.88%
|
2/8/2013
|
$147.04
|
PP = $127.55
|
|
MB = $133.93
|
Most Recent Note - 2/21/2013 1:30:29 PM
G - Endured some distributional pressure this week, yet it remains perched near its all-time high, extended from any sound base. Disciplined investors may watch for secondary buy points or additional bases to possibly form and be noted in the weeks ahead.
>>> The latest Featured Stock Update with an annotated graph appeared on 2/8/2013. Click here.
View all notes |
Alert me of new notes |
CANSLIM.net Company Profile |
SEC |
Zacks Reports |
StockTalk |
News |
Chart |
Request a new note
C
A N
S L
I M
|
Symbol/Exchange
Company Name
Industry Group |
PRICE |
CHANGE
(%Change) |
Day High |
Volume
(% DAV)
(% 50 day avg vol) |
52 Wk Hi
% From Hi |
Featured
Date |
Price
Featured |
Pivot Featured |
|
Max Buy |
LOPE
-
NASDAQ
Grand Canyon Education
DIVERSIFIED SERVICES - Education and; Training Services
|
$25.33
|
+0.34
1.36% |
$25.50
|
564,301
128.37% of 50 DAV
50 DAV is 439,600
|
$27.18
-6.81%
|
2/20/2013
|
$26.44
|
PP = $25.10
|
|
MB = $26.36
|
Most Recent Note - 2/21/2013 5:40:05 PM
Y - Closed near the session low today as a damaging loss with 2 times average volume led to an abrupt reversal and close back below its pivot point raising concerns. It was featured in the 2/20/13 mid-day report (read here) and the latest FSU analysis included more details and an annotated graph.
>>> The latest Featured Stock Update with an annotated graph appeared on 2/20/2013. Click here.
View all notes |
Alert me of new notes |
CANSLIM.net Company Profile |
SEC |
Zacks Reports |
StockTalk |
News |
Chart |
Request a new note
C
A N
S L
I M
|
MIDD
-
NASDAQ
Middleby Corp
MANUFACTURING - Diversified Machinery
|
$148.44
|
+2.30
1.57% |
$148.53
|
56,558
61.74% of 50 DAV
50 DAV is 91,600
|
$152.10
-2.40%
|
10/8/2012
|
$118.46
|
PP = $122.67
|
|
MB = $128.80
|
 Most Recent Note - 2/22/2013 7:40:45 PM
G - Still hovering near its all-time high with volume totals cooling over the past week. Fundamental concerns were recently noted and prior reports cautioned members that it is extended from any sound base. Prior highs and its 50 DMA line define important near-term chart support in the $134-135 area.
>>> The latest Featured Stock Update with an annotated graph appeared on 1/30/2013. Click here.
View all notes |
Alert me of new notes |
CANSLIM.net Company Profile |
SEC |
Zacks Reports |
StockTalk |
News |
Chart |
Request a new note
C
A N
S L
I M
|
N
-
NYSE
Netsuite Inc
DIVERSIFIED SERVICES - Business/Management Services
|
$68.83
|
+1.29
1.91% |
$68.95
|
236,328
65.92% of 50 DAV
50 DAV is 358,500
|
$75.75
-9.14%
|
12/12/2012
|
$64.75
|
PP = $67.12
|
|
MB = $70.48
|
Most Recent Note - 2/22/2013 7:45:35 PM
G - Posted a small gain on light volume today while consolidating above its 50 DMA line ($67.41 now). Damaging losses below that short-term average or the recent low ($65.31 on 2/13/13) may trigger technical sell signals. Concerns were raised following a worrisome "negative reversal" on 2/01/13 after initially gapping up for a new 52-week high, and recent notes have repeatedly cautioned - "Reported earnings +20% on +33% sales revenues for the Dec '12 quarter, below the +25% minimum earnings guideline (C criteria) raising fundamental concerns."
>>> The latest Featured Stock Update with an annotated graph appeared on 2/5/2013. Click here.
View all notes |
Alert me of new notes |
CANSLIM.net Company Profile |
SEC |
Zacks Reports |
StockTalk |
News |
Chart |
Request a new note
C
A N
S L
I M
|
NSR
-
NYSE
Neustar Inc
TELECOMMUNICATIONS - Diversified Communication Serv
|
$44.97
|
+0.91
2.07% |
$45.01
|
421,440
90.05% of 50 DAV
50 DAV is 468,000
|
$47.24
-4.81%
|
12/11/2012
|
$41.85
|
PP = $41.41
|
|
MB = $43.48
|
Most Recent Note - 2/21/2013 10:22:38 AM
G - Gapped down today, abruptly retreating from its 52-week high and violating its 50 DMA line with a damaging loss on higher volume raising concerns and triggering a technical sell signal.
>>> The latest Featured Stock Update with an annotated graph appeared on 2/1/2013. Click here.
View all notes |
Alert me of new notes |
CANSLIM.net Company Profile |
SEC |
Zacks Reports |
StockTalk |
News |
Chart |
Request a new note
C
A N
S L
I M
|
RNF
-
NYSE
Rentech Nitrogen Ptnr Lp
CHEMICALS - Agricultural Chemicals
|
$37.49
|
-2.30
-5.78% |
$39.75
|
1,328,428
331.03% of 50 DAV
50 DAV is 401,300
|
$49.18
-23.77%
|
11/1/2012
|
$39.11
|
PP = $40.15
|
|
MB = $42.16
|
Most Recent Note - 2/22/2013 3:59:11 PM
More damaging losses today violated its 2/12/13 low ($40.95) raising more serious concerns and triggering additional worrisome technical sell signals. Due to technical deterioration it faces overhead supply. It will be dropped from the Featured Stocks list tonight.
>>> The latest Featured Stock Update with an annotated graph appeared on 2/22/2013. Click here.
View all notes |
Alert me of new notes |
CANSLIM.net Company Profile |
SEC |
Zacks Reports |
StockTalk |
News |
Chart |
Request a new note
C
A N
S L
I M
|
Symbol/Exchange
Company Name
Industry Group |
PRICE |
CHANGE
(%Change) |
Day High |
Volume
(% DAV)
(% 50 day avg vol) |
52 Wk Hi
% From Hi |
Featured
Date |
Price
Featured |
Pivot Featured |
|
Max Buy |
SFUN
-
NYSE
Soufun Hldgs Ltd Ads A
INTERNET - Internet Information Providers
|
$26.92
|
+2.22
8.99% |
$26.97
|
373,790
123.20% of 50 DAV
50 DAV is 303,400
|
$29.16
-7.68%
|
2/11/2013
|
$27.46
|
PP = $29.26
|
|
MB = $30.72
|
Most Recent Note - 2/22/2013 3:56:55 PM
Y- Prompt rebound above its 50 DMA line is an encouraging sign of institutional support today after prior losses triggered a technical sell signal. Its color code is changed to yellow, meanwhile it still needs to produce gains above its pivot point before buying efforts may be justified under the fact-based system.
>>> The latest Featured Stock Update with an annotated graph appeared on 2/11/2013. Click here.
View all notes |
Alert me of new notes |
CANSLIM.net Company Profile |
SEC |
Zacks Reports |
StockTalk |
News |
Chart |
Request a new note
C
A N
S L
I M
|
VRX
-
NYSE
Valeant Pharmaceuticals
DRUGS - Drug Manufacturers - Other
|
$65.74
|
+0.05
0.08% |
$66.03
|
862,008
63.47% of 50 DAV
50 DAV is 1,358,100
|
$67.98
-3.30%
|
12/20/2012
|
$60.24
|
PP = $61.21
|
|
MB = $64.27
|
Most Recent Note - 2/22/2013 7:44:05 PM
G - Consolidating just -3.3% off its 52-week high after losses on near average volume this week tested support at the previously noted upward trendline connecting its November - December lows. Its 50 DMA line (now $63.52) defines the next important support area to watch.
>>> The latest Featured Stock Update with an annotated graph appeared on 2/15/2013. Click here.
View all notes |
Alert me of new notes |
CANSLIM.net Company Profile |
SEC |
Zacks Reports |
StockTalk |
News |
Chart |
Request a new note
C
A N
S L
I M
|
|
|
|
THESE ARE NOT BUY RECOMMENDATIONS!
Comments contained in the body of this report are technical
opinions only. The material herein has been obtained
from sources believed to be reliable and accurate, however,
its accuracy and completeness cannot be guaranteed.
This site is not an investment advisor, hence it does
not endorse or recommend any securities or other investments.
Any recommendation contained in this report may not
be suitable for all investors and it is not to be deemed
an offer or solicitation on our part with respect to
the purchase or sale of any securities. All trademarks,
service marks and trade names appearing in this report
are the property of their respective owners, and are
likewise used for identification purposes only.
This report is a service available
only to active Paid Premium Members.
You may opt-out of receiving report notifications
at any time. Questions or comments may be submitted
by writing to Premium Membership Services 665 S.E. 10 Street, Suite 201 Deerfield Beach, FL 33441-5634 or by calling 1-800-965-8307
or 954-785-1121.
|
|
|

