You are not logged in.
This means you
CAN ONLY VIEW reports that were published prior to Monday, April 14, 2025.
You
MUST UPGRADE YOUR MEMBERSHIP if you want to see any current reports.
AFTER MARKET UPDATE - THURSDAY, FEBRUARY 21ST, 2013
Previous After Market Report Next After Market Report >>>
|
|
|
|
DOW |
-46.92 |
13,880.62 |
-0.34% |
|
Volume |
813,949,460 |
-0% |
|
Volume |
1,988,738,580 |
+3% |
|
NASDAQ |
-32.92 |
3,131.49 |
-1.04% |
|
Advancers |
892 |
28% |
|
Advancers |
765 |
30% |
|
S&P 500 |
-9.53 |
1,502.42 |
-0.63% |
|
Decliners |
2,116 |
68% |
|
Decliners |
1,721 |
67% |
|
Russell 2000 |
-8.10 |
905.40 |
-0.89% |
|
52 Wk Highs |
56 |
|
|
52 Wk Highs |
48 |
|
|
S&P 600 |
-4.29 |
507.61 |
-0.84% |
|
52 Wk Lows |
42 |
|
|
52 Wk Lows |
36 |
|
|
 |
Leadership Waned as Indices Fell Again
Kenneth J. Gruneisen - Passed the CAN SLIM® Master's Exam
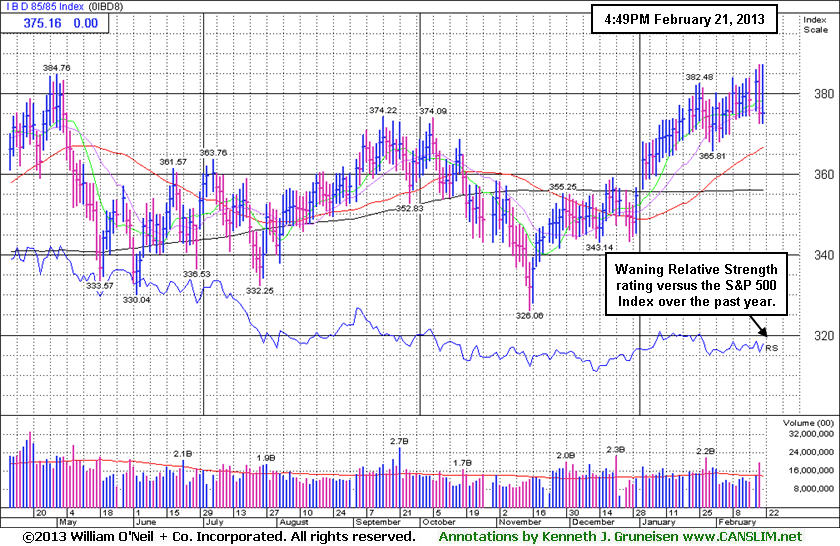
The major averages suffered additional losses on Thursday. The volume totals were reported mixed, slightly lower than the prior session on the NYSE and slightly higher on the Nasdaq exchange. Breadth was negative as decliners led advancers by more than 2-1 on the NYSE and on the Nasdaq exchange. The total number of stocks hitting new 52-week highs contracted substantially yet still outnumbered new 52-week lows on the NYSE and on the Nasdaq exchange. There were only 9 high-ranked companies from the CANSLIM.net Leaders List making new 52-week highs and appearing on the CANSLIM.net BreakOuts Page, down abruptly from the prior session total of 78 stocks. There were losses for all of the 12 high-ranked companies currently included on the Featured Stocks Page.
Equity markets were lower at the opening bell following several disappointing economic reports. Looking at the data, weekly jobless claims, PMI manufacturing and the February Philly Fed survey all fell short of consensus estimates.
All 10 sectors on the S&P were lower. On the earnings front, Wal-Mart Stores Inc (WMT +1.52%) rose after posting a better-than-expected quarterly report. On the downside, Chesapeake Energy Corp (CHK -0.2%) edged lower following their earnings. On the M&A front, Berry Petroleum (BRY +19.25%) rallied on news that the company was being acquired by Linn Energy LLC (LINE +2.81%) in a $2.5 billion deal.
The market's (M criteria) uptrend has recently encountered distributional pressure. Leadership (stocks hitting new 52-week highs) has waned and several high-ranked leaders have recently triggered technical sell signals. Watch individual holdings closely and remain ready to reduce exposure. Only consider new buying efforts when all key criteria are solidly satisfied.
Watch for an announcement via email concerning the next WEBCAST. The webcast will also be available via an updated link highlighted at the top of the Premium Member Homepage.
PICTURED: The IBD 85/85 Index has seen its Relative Strength rating versus the S&P 500 Index waning over the past year.
|
 Kenneth J. Gruneisen started out as a licensed stockbroker in August 1987, a couple of months prior to the historic stock market crash that took the Dow Jones Industrial Average down -22.6% in a single day. He has published daily fact-based fundamental and technical analysis on high-ranked stocks online for two decades. Through FACTBASEDINVESTING.COM, Kenneth provides educational articles, news, market commentary, and other information regarding proven investment systems that work in good times and bad.
Comments contained in the body of this report are technical opinions only and are not necessarily those of Gruneisen Growth Corp. The material herein has been obtained from sources believed to be reliable and accurate, however, its accuracy and completeness cannot be guaranteed. Our firm, employees, and customers may effect transactions, including transactions contrary to any recommendation herein, or have positions in the securities mentioned herein or options with respect thereto. Any recommendation contained in this report may not be suitable for all investors and it is not to be deemed an offer or solicitation on our part with respect to the purchase or sale of any securities. |
|
 |
Financial, Tech, Retail, and Energy Related Groups Fell
Kenneth J. Gruneisen - Passed the CAN SLIM® Master's Exam
Weakness in the Broker/Dealer Index ($XBD -1.94%) and Bank Index ($BKX -1.23%) was a negative influence on the major averages on Thursday. The Retail Index ($RLX -0.81%) and the tech sector also fell as the Networking Index ($NWX -1.84%), Semiconductor Index ($SOX -1.81%), Biotechnology Index ($BTK -1.11%), and the Internet Index ($IIX -1.06%) finished the day with unanimous losses. Weakness in the energy-related areas dragged the Oil Services Index ($OSX -1.49%) and the Integrated Oil Index ($XOI -0.57%) lower. Defensive groups fared better, with the Healthcare Index ($HMO +0.10%) holding its ground and the Gold & Silver Index ($XAU +1.84%) rebounding from its steep recent losses.
Charts courtesy www.stockcharts.com
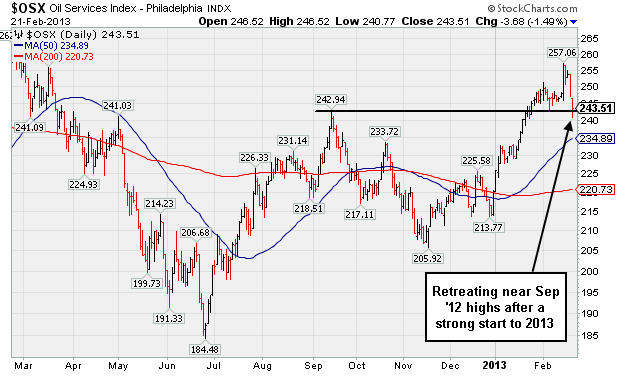
PICTURED: The Oil Services Index ($OSX -1.49%) losses have it retreating near its September 2012 highs after a strong start to 2013.
| Oil Services |
$OSX |
243.51 |
-3.68 |
-1.49% |
+10.61% |
| Healthcare |
$HMO |
2,736.07 |
+2.77 |
+0.10% |
+8.83% |
| Integrated Oil |
$XOI |
1,317.48 |
-7.58 |
-0.57% |
+6.09% |
| Semiconductor |
$SOX |
416.27 |
-7.68 |
-1.81% |
+8.39% |
| Networking |
$NWX |
237.26 |
-4.45 |
-1.84% |
+4.73% |
| Internet |
$IIX |
353.98 |
-3.79 |
-1.06% |
+8.25% |
| Broker/Dealer |
$XBD |
106.02 |
-2.10 |
-1.94% |
+12.40% |
| Retail |
$RLX |
693.78 |
-5.65 |
-0.81% |
+6.24% |
| Gold & Silver |
$XAU |
137.04 |
+2.47 |
+1.84% |
-17.25% |
| Bank |
$BKX |
53.87 |
-0.67 |
-1.23% |
+5.05% |
| Biotech |
$BTK |
1,645.50 |
-18.42 |
-1.11% |
+6.37% |
|
|
|
 |
Violation of 50-Day Moving Average on Light Volume
Kenneth J. Gruneisen - Passed the CAN SLIM® Master's Exam
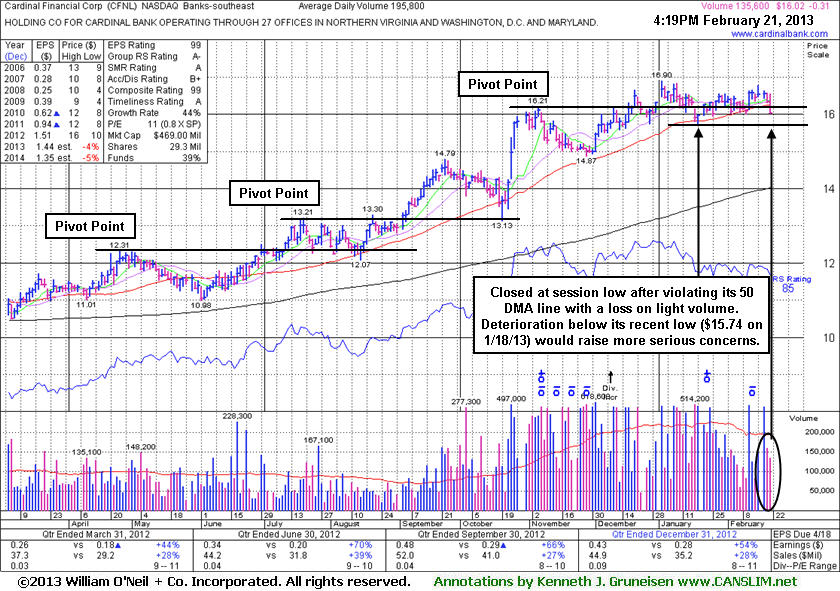
Cardinal Financial Corp (CFNL -$0.31 or -1.90% to $16.02 ) violated its 50-day moving average (DMA) line today and finished the session at its low with a loss on below average volume. The deterioration raised concerns and triggered technical sell signal. Only a prompt rebound above its 50 DMA line would help its outlook improve. It has been trading in a tight range in recent weeks without making meaningful progress above its latest pivot point. It may find support and make a stand near that important short-term average, however the weak finish at the session's low does not bode well for Friday's session. Meanwhile, more damaging losses leading to a slump below the recent low ($15.74 on 1/18/13) would raise more serious concerns and trigger an additional technical sell signal. Disciplined investors always limit losses if any stock ever falls more than -7% from their purchase price.
It was last shown in this FSU section on 1/31/13 with an annotated graph under the headline, "Found Support Above 50-Day Moving Average But Relative Strength Has Been Waning". It did not ever trade above its "max buy" level after the rally above its pivot point on 1/02/13 with +72% above average volume triggered a technical buy signal. Its 85 Relative Strength Rating remains above the 80+ minimum for buy candidates, however that rank has been slumping.
The high-ranked leader hailing from the Banks - Southeast industry group reported earnings +54% on +28% sales revenues for the quarter ended December 31, 2012 versus the year ago period, continuing its track record of strong quarterly earnings comparisons underpinned by encouraging sales revenues increases. It has earned the highest possible 99 Earnings Per Share (EPS) rank, and its high ranks and long term earnings history help it match favorably with the C and A criteria. The number of top-rated funds owning its shares rose from 172 in Sep '11 to 205 in Dec '12, a reassuring trend concerning the I criteria. Its current Up/Down Volume Ratio of 1.3 also offers an unbiased indication that its shares have been under accumulation over the past 50 days. Its small supply (S criteria) of only 29.3 millions shares outstanding is a favorable characteristic, yet it can contribute to greater price volatility in the event of institutional accumulation or distributional pressure.
|
|
|
Color Codes Explained :
Y - Better candidates highlighted by our
staff of experts.
G - Previously featured
in past reports as yellow but may no longer be buyable under the
guidelines.
***Last / Change / Volume data in this table is the closing quote data***
Symbol/Exchange
Company Name
Industry Group |
PRICE |
CHANGE
(%Change) |
Day High |
Volume
(% DAV)
(% 50 day avg vol) |
52 Wk Hi
% From Hi |
Featured
Date |
Price
Featured |
Pivot Featured |
|
Max Buy |
CELG
-
NASDAQ
Celgene Corp
DRUGS - Drug Manufacturers - Major
|
$99.43
|
-0.97
-0.97% |
$100.29
|
3,713,762
98.00% of 50 DAV
50 DAV is 3,789,500
|
$103.69
-4.11%
|
12/11/2012
|
$82.24
|
PP = $81.34
|
|
MB = $85.41
|
 Most Recent Note - 2/21/2013 1:24:17 PM
G - Pulling back today following a worrisome "negative reversal" on the prior session, reversing into the red for a loss on heavy volume and closing near the session low after initial gains for new all-time highs. Its 50 DMA line (now $91.17) defines important support to watch on pullbacks.
>>> The latest Featured Stock Update with an annotated graph appeared on 2/4/2013. Click here.
View all notes |
Alert me of new notes |
CANSLIM.net Company Profile |
SEC |
Zacks Reports |
StockTalk |
News |
Chart |
Request a new note
C
A N
S L
I M


|
CFNL
-
NASDAQ
Cardinal Financial Corp
BANKING - Regional - Southeast Banks
|
$16.02
|
-0.31
-1.90% |
$16.56
|
137,601
70.28% of 50 DAV
50 DAV is 195,800
|
$16.90
-5.21%
|
12/3/2012
|
$15.20
|
PP = $16.31
|
|
MB = $17.13
|
Most Recent Note - 2/21/2013 5:36:45 PM
G - Violated its 50 DMA line today with a loss on light volume triggering a technical sell signal. See the latest FSU analysis for more details and a new annotated graph.
>>> The latest Featured Stock Update with an annotated graph appeared on 2/21/2013. Click here.
View all notes |
Alert me of new notes |
CANSLIM.net Company Profile |
SEC |
Zacks Reports |
StockTalk |
News |
Chart |
Request a new note
C
A N
S L
I M
|
CMCSA
-
NASDAQ
Comcast Corp Cl A
MEDIA - CATV Systems
|
$40.08
|
-0.87
-2.12% |
$40.83
|
13,057,866
94.32% of 50 DAV
50 DAV is 13,844,400
|
$42.00
-4.57%
|
12/3/2012
|
$37.08
|
PP = $38.06
|
|
MB = $39.96
|
Most Recent Note - 2/19/2013 4:55:14 PM
G - Traded up today near its 52-week high hit during a streak of 5 consecutive gains backed by above average volume. Reported earnings +11% on +6% sales revenues for the Dec '12 quarter, below the +25% minimum earnings guideline (C criteria), raising fundamental concerns, yet bullish action has continued. See the latest FSU analysis for more details and a new annotated graph.
>>> The latest Featured Stock Update with an annotated graph appeared on 2/19/2013. Click here.
View all notes |
Alert me of new notes |
CANSLIM.net Company Profile |
SEC |
Zacks Reports |
StockTalk |
News |
Chart |
Request a new note
C
A N
S L
I M
|
KORS
-
NYSE
Michael Kors Hldgs Ltd
RETAIL - Apparel Stores
|
$59.00
|
-2.50
-4.07% |
$60.98
|
25,672,244
563.00% of 50 DAV
50 DAV is 4,559,900
|
$65.10
-9.37%
|
1/23/2013
|
$54.98
|
PP = $58.72
|
|
MB = $61.66
|
Most Recent Note - 2/21/2013 1:28:56 PM
G - Gapped down for a 2nd consecutive session and another loss on heavy volume today. Completed another Secondary Offering on 2/20/13 while perched near its all-time high. Prior highs in the $58 area define important initial chart support to watch.
>>> The latest Featured Stock Update with an annotated graph appeared on 2/7/2013. Click here.
View all notes |
Alert me of new notes |
CANSLIM.net Company Profile |
SEC |
Zacks Reports |
StockTalk |
News |
Chart |
Request a new note
C
A N
S L
I M
|
LNKD
-
NYSE
Linkedin Corp Class A
INTERNET - Internet Information Providers
|
$157.36
|
-0.73
-0.46% |
$159.97
|
2,747,806
128.52% of 50 DAV
50 DAV is 2,138,100
|
$165.20
-4.75%
|
2/8/2013
|
$147.04
|
PP = $127.55
|
|
MB = $133.93
|
Most Recent Note - 2/21/2013 1:30:29 PM
G - Endured some distributional pressure this week, yet it remains perched near its all-time high, extended from any sound base. Disciplined investors may watch for secondary buy points or additional bases to possibly form and be noted in the weeks ahead.
>>> The latest Featured Stock Update with an annotated graph appeared on 2/8/2013. Click here.
View all notes |
Alert me of new notes |
CANSLIM.net Company Profile |
SEC |
Zacks Reports |
StockTalk |
News |
Chart |
Request a new note
C
A N
S L
I M
|
Symbol/Exchange
Company Name
Industry Group |
PRICE |
CHANGE
(%Change) |
Day High |
Volume
(% DAV)
(% 50 day avg vol) |
52 Wk Hi
% From Hi |
Featured
Date |
Price
Featured |
Pivot Featured |
|
Max Buy |
LOPE
-
NASDAQ
Grand Canyon Education
DIVERSIFIED SERVICES - Education and; Training Services
|
$24.99
|
-1.39
-5.27% |
$26.51
|
877,682
204.59% of 50 DAV
50 DAV is 429,000
|
$27.18
-8.06%
|
2/20/2013
|
$26.44
|
PP = $25.10
|
|
MB = $26.36
|
Most Recent Note - 2/21/2013 5:40:05 PM
Y - Closed near the session low today as a damaging loss with 2 times average volume led to an abrupt reversal and close back below its pivot point raising concerns. It was featured in the 2/20/13 mid-day report (read here) and the latest FSU analysis included more details and an annotated graph.
>>> The latest Featured Stock Update with an annotated graph appeared on 2/20/2013. Click here.
View all notes |
Alert me of new notes |
CANSLIM.net Company Profile |
SEC |
Zacks Reports |
StockTalk |
News |
Chart |
Request a new note
C
A N
S L
I M
|
MIDD
-
NASDAQ
Middleby Corp
MANUFACTURING - Diversified Machinery
|
$146.14
|
-1.02
-0.69% |
$148.05
|
38,146
41.24% of 50 DAV
50 DAV is 92,500
|
$152.10
-3.92%
|
10/8/2012
|
$118.46
|
PP = $122.67
|
|
MB = $128.80
|
Most Recent Note - 2/15/2013 12:33:30 PM
G - Hovering near its all-time high still, but enduring distributional pressure this week with above average volume behind 2 recent losses. Fundamental concerns were recently noted and prior reports cautioned members that it is extended from any sound base. Prior highs and its 50 DMA line define important near-term chart support in the $134-135 area.
>>> The latest Featured Stock Update with an annotated graph appeared on 1/30/2013. Click here.
View all notes |
Alert me of new notes |
CANSLIM.net Company Profile |
SEC |
Zacks Reports |
StockTalk |
News |
Chart |
Request a new note
C
A N
S L
I M
|
N
-
NYSE
Netsuite Inc
DIVERSIFIED SERVICES - Business/Management Services
|
$67.54
|
-0.46
-0.68% |
$68.07
|
431,415
121.80% of 50 DAV
50 DAV is 354,200
|
$75.75
-10.84%
|
12/12/2012
|
$64.75
|
PP = $67.12
|
|
MB = $70.48
|
Most Recent Note - 2/19/2013 1:28:56 PM
G - Consolidating above its 50 DMA line ($66.74 now) today. Damaging losses below that short-term average or the recent low ($65.31 on 2/13/13) may trigger technical sell signals. Concerns were raised following a worrisome "negative reversal" on 2/01/13 after initially gapping up for a new 52-week high, and recent notes have repeatedly cautioned - "Reported earnings +20% on +33% sales revenues for the Dec '12 quarter, below the +25% minimum earnings guideline (C criteria) raising fundamental concerns."
>>> The latest Featured Stock Update with an annotated graph appeared on 2/5/2013. Click here.
View all notes |
Alert me of new notes |
CANSLIM.net Company Profile |
SEC |
Zacks Reports |
StockTalk |
News |
Chart |
Request a new note
C
A N
S L
I M
|
NSR
-
NYSE
Neustar Inc
TELECOMMUNICATIONS - Diversified Communication Serv
|
$44.06
|
-1.80
-3.92% |
$45.69
|
1,678,162
384.02% of 50 DAV
50 DAV is 437,000
|
$47.24
-6.73%
|
12/11/2012
|
$41.85
|
PP = $41.41
|
|
MB = $43.48
|
Most Recent Note - 2/21/2013 10:22:38 AM
G - Gapped down today, abruptly retreating from its 52-week high and violating its 50 DMA line with a damaging loss on higher volume raising concerns and triggering a technical sell signal.
>>> The latest Featured Stock Update with an annotated graph appeared on 2/1/2013. Click here.
View all notes |
Alert me of new notes |
CANSLIM.net Company Profile |
SEC |
Zacks Reports |
StockTalk |
News |
Chart |
Request a new note
C
A N
S L
I M
|
RNF
-
NYSE
Rentech Nitrogen Ptnr Lp
CHEMICALS - Agricultural Chemicals
|
$39.79
|
-1.89
-4.53% |
$41.12
|
983,068
256.61% of 50 DAV
50 DAV is 383,100
|
$49.18
-19.09%
|
11/1/2012
|
$39.11
|
PP = $40.15
|
|
MB = $42.16
|
Most Recent Note - 2/21/2013 10:24:30 AM
G - Slumped below its 50 DMA line again on the prior session, then gapped down today violating its 2/12/13 low ($40.95) raising more serious concerns and triggering additional worrisome technical sell signals.
>>> The latest Featured Stock Update with an annotated graph appeared on 2/12/2013. Click here.
View all notes |
Alert me of new notes |
CANSLIM.net Company Profile |
SEC |
Zacks Reports |
StockTalk |
News |
Chart |
Request a new note
C
A N
S L
I M
|
Symbol/Exchange
Company Name
Industry Group |
PRICE |
CHANGE
(%Change) |
Day High |
Volume
(% DAV)
(% 50 day avg vol) |
52 Wk Hi
% From Hi |
Featured
Date |
Price
Featured |
Pivot Featured |
|
Max Buy |
SFUN
-
NYSE
Soufun Hldgs Ltd Ads A
INTERNET - Internet Information Providers
|
$24.70
|
-1.20
-4.63% |
$25.48
|
546,028
182.56% of 50 DAV
50 DAV is 299,100
|
$29.16
-15.29%
|
2/11/2013
|
$27.46
|
PP = $29.26
|
|
MB = $30.72
|
Most Recent Note - 2/21/2013 10:26:57 AM
G - Gapped down today violating its 50 DMA line raising concerns and triggering a technical sell signal. Its color code is changed to green while deterioration takes it further from its pivot point.
>>> The latest Featured Stock Update with an annotated graph appeared on 2/11/2013. Click here.
View all notes |
Alert me of new notes |
CANSLIM.net Company Profile |
SEC |
Zacks Reports |
StockTalk |
News |
Chart |
Request a new note
C
A N
S L
I M
|
VRX
-
NYSE
Valeant Pharmaceuticals
DRUGS - Drug Manufacturers - Other
|
$65.69
|
-0.55
-0.83% |
$66.32
|
1,369,013
101.51% of 50 DAV
50 DAV is 1,348,600
|
$67.98
-3.37%
|
12/20/2012
|
$60.24
|
PP = $61.21
|
|
MB = $64.27
|
Most Recent Note - 2/15/2013 6:29:48 PM
G - Consolidating near its 52-week high. An upward trendline connecting its November - December lows defines initial chart support to watch above its 50 DMA line. See the latest FSU analysis for more details and a new annotated graph.
>>> The latest Featured Stock Update with an annotated graph appeared on 2/15/2013. Click here.
View all notes |
Alert me of new notes |
CANSLIM.net Company Profile |
SEC |
Zacks Reports |
StockTalk |
News |
Chart |
Request a new note
C
A N
S L
I M
|
|
|
|
THESE ARE NOT BUY RECOMMENDATIONS!
Comments contained in the body of this report are technical
opinions only. The material herein has been obtained
from sources believed to be reliable and accurate, however,
its accuracy and completeness cannot be guaranteed.
This site is not an investment advisor, hence it does
not endorse or recommend any securities or other investments.
Any recommendation contained in this report may not
be suitable for all investors and it is not to be deemed
an offer or solicitation on our part with respect to
the purchase or sale of any securities. All trademarks,
service marks and trade names appearing in this report
are the property of their respective owners, and are
likewise used for identification purposes only.
This report is a service available
only to active Paid Premium Members.
You may opt-out of receiving report notifications
at any time. Questions or comments may be submitted
by writing to Premium Membership Services 665 S.E. 10 Street, Suite 201 Deerfield Beach, FL 33441-5634 or by calling 1-800-965-8307
or 954-785-1121.
|
|
|

