You are not logged in.
This means you
CAN ONLY VIEW reports that were published prior to Monday, April 14, 2025.
You
MUST UPGRADE YOUR MEMBERSHIP if you want to see any current reports.
AFTER MARKET UPDATE - WEDNESDAY, FEBRUARY 20TH, 2013
Previous After Market Report Next After Market Report >>>
|
|
|
|
DOW |
-108.13 |
13,927.54 |
-0.77% |
|
Volume |
816,007,670 |
+11% |
|
Volume |
1,923,359,800 |
+8% |
|
NASDAQ |
-49.18 |
3,164.41 |
-1.53% |
|
Advancers |
715 |
23% |
|
Advancers |
546 |
21% |
|
S&P 500 |
-18.99 |
1,511.95 |
-1.24% |
|
Decliners |
2,327 |
74% |
|
Decliners |
1,963 |
76% |
|
Russell 2000 |
-18.50 |
913.50 |
-1.99% |
|
52 Wk Highs |
284 |
|
|
52 Wk Highs |
177 |
|
|
S&P 600 |
-10.04 |
511.90 |
-1.92% |
|
52 Wk Lows |
40 |
|
|
52 Wk Lows |
18 |
|
|
 |
Major Averages Posted Largest One-Day Declines of 2013
Kenneth J. Gruneisen - Passed the CAN SLIM® Master's Exam
The major averages suffered their worst one-day losses of 2013 as traders were spooked by comments from the latest Fed minutes concerning the potential for future tapering of its quantitative easing efforts. Wednesday's volume totals were reported higher that the prior session on both the NYSE and on the Nasdaq exchange, which indicated distributional pressure as institutional investors locked in profits following the S&P 500 Index's 7-week winning streak which saw an +8.3% advance by the benchmark average. Breadth was negative as decliners led advancers by more than 3-1 on the NYSE and by nearly 4-1 on the Nasdaq exchange. The total number of stocks hitting new 52-week highs still solidly outnumbered new 52-week lows on the NYSE and on the Nasdaq exchange. There were 78 high-ranked companies from the CANSLIM.net Leaders List making new 52-week highs and appearing on the CANSLIM.net BreakOuts Page, down from the prior session total of 91 stocks. There were gains for only 2 of the 12 high-ranked companies currently included on the Featured Stocks Page.
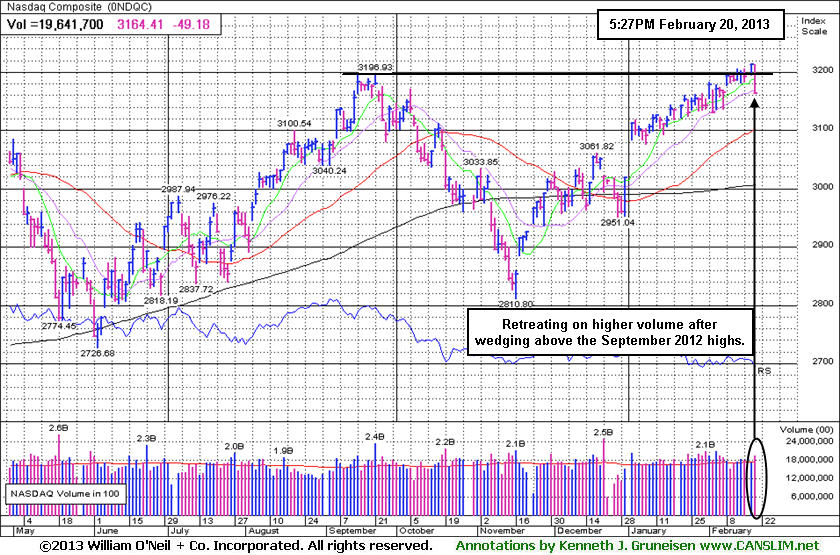
The major averages retreated from their 5-year highs after the release of the minutes of the January Fed meeting showed policymakers debated whether to continue its bond buying program. On the economic front, housing starts fell -8.5% in January while a separate report showed producer prices increased +0.2% last month.
All 10 sectors in the S&P 500 declined with materials and energy the worst performing groups. Freeport McMoRan Copper & Gold Inc (FCX -6.0%) plunged as gold and copper prices retreated. Newfield Exploration Co (NFX -9.34%) dove after posting a quarterly loss. In the industrials, Joy Global Inc (JOYG +2.69%) rose after its CEO said at an investor conference the company may seek acquisitions. Caterpillar Inc (CAT -2.49%) fell after saying global retail machine sales fell. Shares of Apple Inc (AAPL -2.42%) fell on news the company's supplier Foxconn Technology instituted a hiring freeze. Office Max Inc (OMX -7%) retreated after agreeing to be acquired by Office Depot Inc (ODP -16.73%) for $1.17 billion.
Treasuries finished higher with the 10-year note gaining 5/32 to yield 2.01%.
The market's (M criteria) confirmed uptrend has been comprised by great leadership (stocks hitting new 52-week highs) in the broader market. Widespread gains helped the Dow Jones Industrial Average and the S&P 500 Index rally near their October 2007 all-time highs.
Watch for an announcement via email concerning the next WEBCAST. The webcast will also be available via an updated link highlighted at the top of the Premium Member Homepage.
PICTURED: The Nasdaq Composite Index fell on higher volume after recently wedging above its September 2012 highs.
|
 Kenneth J. Gruneisen started out as a licensed stockbroker in August 1987, a couple of months prior to the historic stock market crash that took the Dow Jones Industrial Average down -22.6% in a single day. He has published daily fact-based fundamental and technical analysis on high-ranked stocks online for two decades. Through FACTBASEDINVESTING.COM, Kenneth provides educational articles, news, market commentary, and other information regarding proven investment systems that work in good times and bad.
Comments contained in the body of this report are technical opinions only and are not necessarily those of Gruneisen Growth Corp. The material herein has been obtained from sources believed to be reliable and accurate, however, its accuracy and completeness cannot be guaranteed. Our firm, employees, and customers may effect transactions, including transactions contrary to any recommendation herein, or have positions in the securities mentioned herein or options with respect thereto. Any recommendation contained in this report may not be suitable for all investors and it is not to be deemed an offer or solicitation on our part with respect to the purchase or sale of any securities. |
|
 |
Commodity-Linked Groups Led Broad Retreat
Kenneth J. Gruneisen - Passed the CAN SLIM® Master's Exam
Commodity-linked groups were Wednesday's worst decliners as the Gold & Silver Index ($XAU -5.23%) plunged and the Oil Services Index ($OSX -2.55%) and Integrated Oil Index ($XOI -2.29%) each fell more than -2%. The tech sector saw unanimous losses from the Semiconductor Index ($SOX -2.23%), Internet Index ($IIX -1.81%), Networking Index ($NWX -1.59%), and Biotechnology Index ($BTK -1.48%). The Healthcare Index ($HMO -1.46%) and the Retail Index ($RLX -1.34%) both had a negative bias. Financial groups also ended lower as the Bank Index ($BKX -1.66%) and the Broker/Dealer Index ($XBD -1.65%) fell.
Charts courtesy www.stockcharts.com
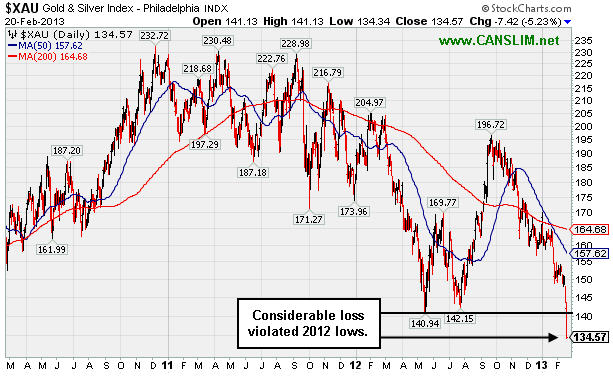
PICTURED: The Gold & Silver Index ($XAU -5.23%) violated its 2012 lows and plunged to new multi-year lows.
| Oil Services |
$OSX |
247.19 |
-6.47 |
-2.55% |
+12.28% |
| Healthcare |
$HMO |
2,733.30 |
-40.43 |
-1.46% |
+8.72% |
| Integrated Oil |
$XOI |
1,325.06 |
-31.04 |
-2.29% |
+6.70% |
| Semiconductor |
$SOX |
423.95 |
-9.69 |
-2.23% |
+10.39% |
| Networking |
$NWX |
241.71 |
-3.91 |
-1.59% |
+6.69% |
| Internet |
$IIX |
357.77 |
-6.59 |
-1.81% |
+9.41% |
| Broker/Dealer |
$XBD |
108.12 |
-1.81 |
-1.65% |
+14.62% |
| Retail |
$RLX |
699.43 |
-9.47 |
-1.34% |
+7.10% |
| Gold & Silver |
$XAU |
134.57 |
-7.42 |
-5.23% |
-18.74% |
| Bank |
$BKX |
54.54 |
-0.92 |
-1.66% |
+6.36% |
| Biotech |
$BTK |
1,663.92 |
-24.96 |
-1.48% |
+7.56% |
|
|
|
 |
Follow Up Gains on Higher Volume Clinched Technical Breakout
Kenneth J. Gruneisen - Passed the CAN SLIM® Master's Exam
Often, when a leading stock is breaking out of a solid base it is highlighted in CANSLIM.net's Mid-Day Breakouts Report. The most relevant factors are noted in the report which alerts prudent CANSLIM oriented investors. After doing any necessary backup research, the investor is prepared to act. Disciplined investors know to buy as near as possible to the pivot point and avoid chasing stocks after they have rallied more than +5% above their pivot point. It is crucial to always limit losses whenever any stock heads the wrong direction, and disciplined investors sell if a struggling stock ever falls more than -7% from their purchase price.
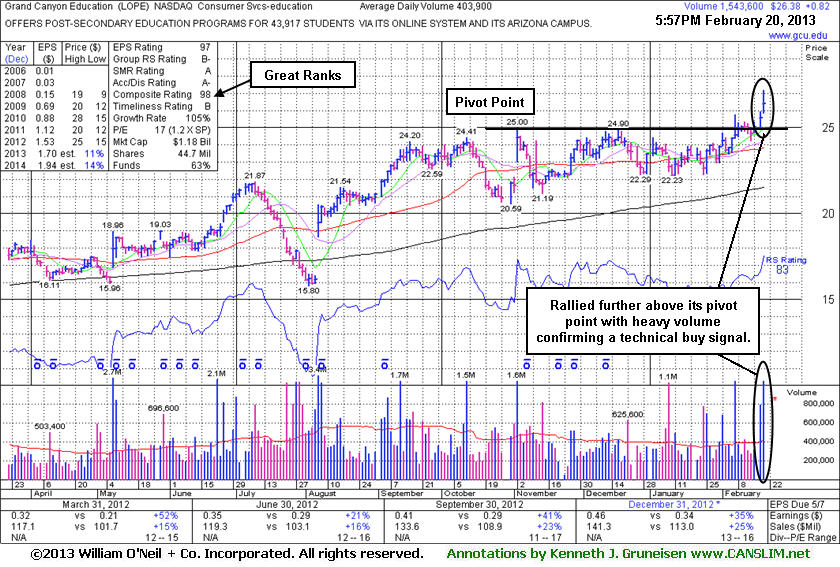
Grand Canyon Education (LOPE +$0.82 or +3.21% to $26.38) was highlighted in yellow with pivot point based on its 11/02/12 high plus 10 cents in the earlier mid-day report (read here). It recently encountered resistance in the $25 area. Its volume-driven gain on the prior session clinched a technical buy signal, and it gapped up today hitting new 52-week highs while approaching its all-time high ($28.46 in April 2010). It has earned great ranks, and Relative Strength Rating (83) is above the 80+ minimum guideline for buy candidates under the fact-based investment system. Its Relative Strength line (the jagged blue line) has simultaneously confirmed the rally into new high territory.
It most recently reported earnings +35% on +25% sales revenues for the Dec '12 quarter, and earnings increases were above the +25% minimum earnings guideline (C criteria) in 3 of the past 4 quarterly comparisons. It traded above and below its 50-day moving average (DMA) line (the red line) while consolidating since last noted in the 11/02/12 mid-day report with caution. It was last shown in this FSU section on 5/27/10 with an annotated graph under the headline, "Education Firm Enduring Distributional Pressure", as it fell on heavy volume in the wake of recently proposed regulatory changes.
Leadership in the Commercial Services - Schools group is a nice reassurance for the L criteria. The number of top-rated funds owning its shares rose from 200 in Mar '12 to 254 in Dec '12, a reassuring trend concerning the I criteria. Its current Up/Down Volume Ratio of 1.4 also is an unbiased indication that its shares have been under accumulation over the past 50 days.
|
|
|
Color Codes Explained :
Y - Better candidates highlighted by our
staff of experts.
G - Previously featured
in past reports as yellow but may no longer be buyable under the
guidelines.
***Last / Change / Volume data in this table is the closing quote data***
Symbol/Exchange
Company Name
Industry Group |
PRICE |
CHANGE
(%Change) |
Day High |
Volume
(% DAV)
(% 50 day avg vol) |
52 Wk Hi
% From Hi |
Featured
Date |
Price
Featured |
Pivot Featured |
|
Max Buy |
CELG
-
NASDAQ
Celgene Corp
DRUGS - Drug Manufacturers - Major
|
$100.40
|
-0.06
-0.06% |
$103.69
|
6,129,811
165.39% of 50 DAV
50 DAV is 3,706,300
|
$102.29
-1.85%
|
12/11/2012
|
$82.24
|
PP = $81.34
|
|
MB = $85.41
|
Most Recent Note - 2/14/2013 7:02:13 PM
G - Volume totals have been cooling in recent weeks while it has stubbornly hovered near its all-time high, holding its ground. That price/volume action is an encouraging indication that few investors have been headed for the exit. Its 50 DMA line (now $89.92) defines important support to watch on pullbacks.
>>> The latest Featured Stock Update with an annotated graph appeared on 2/4/2013. Click here.
View all notes |
Alert me of new notes |
CANSLIM.net Company Profile |
SEC |
Zacks Reports |
StockTalk |
News |
Chart |
Request a new note
C
A N
S L
I M


|
CFNL
-
NASDAQ
Cardinal Financial Corp
BANKING - Regional - Southeast Banks
|
$16.33
|
-0.23
-1.39% |
$16.58
|
161,153
82.39% of 50 DAV
50 DAV is 195,600
|
$16.90
-3.37%
|
12/3/2012
|
$15.20
|
PP = $16.31
|
|
MB = $17.13
|
Most Recent Note - 2/19/2013 12:24:20 PM
Y - Consolidating above its 50 DMA line today, and trading in a tight range in recent weeks without making meaningful progress above prior highs. Subsequent losses leading to a damaging 50 DMA line violation or a slump below the recent low ($15.74 on 1/18/13) would raise concerns and trigger technical sell signals.
>>> The latest Featured Stock Update with an annotated graph appeared on 1/31/2013. Click here.
View all notes |
Alert me of new notes |
CANSLIM.net Company Profile |
SEC |
Zacks Reports |
StockTalk |
News |
Chart |
Request a new note
C
A N
S L
I M
|
CMCSA
-
NASDAQ
Comcast Corp Cl A
MEDIA - CATV Systems
|
$40.95
|
-0.50
-1.21% |
$41.73
|
15,627,882
114.10% of 50 DAV
50 DAV is 13,697,100
|
$42.00
-2.50%
|
12/3/2012
|
$37.08
|
PP = $38.06
|
|
MB = $39.96
|
Most Recent Note - 2/19/2013 4:55:14 PM
G - Traded up today near its 52-week high hit during a streak of 5 consecutive gains backed by above average volume. Reported earnings +11% on +6% sales revenues for the Dec '12 quarter, below the +25% minimum earnings guideline (C criteria), raising fundamental concerns, yet bullish action has continued. See the latest FSU analysis for more details and a new annotated graph.
>>> The latest Featured Stock Update with an annotated graph appeared on 2/19/2013. Click here.
View all notes |
Alert me of new notes |
CANSLIM.net Company Profile |
SEC |
Zacks Reports |
StockTalk |
News |
Chart |
Request a new note
C
A N
S L
I M
|
KORS
-
NYSE
Michael Kors Hldgs Ltd
RETAIL - Apparel Stores
|
$61.50
|
-3.34
-5.15% |
$63.69
|
9,545,209
215.82% of 50 DAV
50 DAV is 4,422,800
|
$65.10
-5.53%
|
1/23/2013
|
$54.98
|
PP = $58.72
|
|
MB = $61.66
|
 Most Recent Note - 2/20/2013 12:17:04 PM
G - Proposed another Secondary Offering while trading at an all-time high, and it gapped down today for a small loss. Reported earnings +129% on +70% sales revenues for the Dec '12 quarter versus the year ago period. A considerable "breakaway gap" for a new high with heavy volume on 2/12/13 triggered a convincing technical buy signal.
>>> The latest Featured Stock Update with an annotated graph appeared on 2/7/2013. Click here.
View all notes |
Alert me of new notes |
CANSLIM.net Company Profile |
SEC |
Zacks Reports |
StockTalk |
News |
Chart |
Request a new note
C
A N
S L
I M
|
LNKD
-
NYSE
Linkedin Corp Class A
INTERNET - Internet Information Providers
|
$158.09
|
-2.67
-1.66% |
$165.20
|
2,827,485
134.30% of 50 DAV
50 DAV is 2,105,400
|
$163.00
-3.01%
|
2/8/2013
|
$147.04
|
PP = $127.55
|
|
MB = $133.93
|
Most Recent Note - 2/14/2013 6:53:28 PM
G - Finished near the session high as it tallied another gain today with +34% above average volume while getting even more extended. Disciplined investors may watch for secondary buy points or additional bases to possibly form and be noted in the weeks ahead.
>>> The latest Featured Stock Update with an annotated graph appeared on 2/8/2013. Click here.
View all notes |
Alert me of new notes |
CANSLIM.net Company Profile |
SEC |
Zacks Reports |
StockTalk |
News |
Chart |
Request a new note
C
A N
S L
I M
|
Symbol/Exchange
Company Name
Industry Group |
PRICE |
CHANGE
(%Change) |
Day High |
Volume
(% DAV)
(% 50 day avg vol) |
52 Wk Hi
% From Hi |
Featured
Date |
Price
Featured |
Pivot Featured |
|
Max Buy |
LOPE
-
NASDAQ
Grand Canyon Education
DIVERSIFIED SERVICES - Education and; Training Services
|
$26.38
|
+0.82
3.21% |
$27.18
|
1,549,845
383.72% of 50 DAV
50 DAV is 403,900
|
$25.96
1.62%
|
2/20/2013
|
$26.44
|
PP = $25.10
|
|
MB = $26.36
|
Most Recent Note - 2/20/2013 6:24:29 PM
Y - Finished strong today after highlighted in yellow with pivot point based on its 11/02/12 high plus 10 cents in the earlier mid-day report (read here). See the latest FSU analysis for more details and a new annotated graph.
>>> The latest Featured Stock Update with an annotated graph appeared on 2/20/2013. Click here.
View all notes |
Alert me of new notes |
CANSLIM.net Company Profile |
SEC |
Zacks Reports |
StockTalk |
News |
Chart |
Request a new note
C
A N
S L
I M
|
MIDD
-
NASDAQ
Middleby Corp
MANUFACTURING - Diversified Machinery
|
$147.16
|
-2.55
-1.70% |
$152.10
|
46,688
50.04% of 50 DAV
50 DAV is 93,300
|
$151.49
-2.86%
|
10/8/2012
|
$118.46
|
PP = $122.67
|
|
MB = $128.80
|
Most Recent Note - 2/15/2013 12:33:30 PM
G - Hovering near its all-time high still, but enduring distributional pressure this week with above average volume behind 2 recent losses. Fundamental concerns were recently noted and prior reports cautioned members that it is extended from any sound base. Prior highs and its 50 DMA line define important near-term chart support in the $134-135 area.
>>> The latest Featured Stock Update with an annotated graph appeared on 1/30/2013. Click here.
View all notes |
Alert me of new notes |
CANSLIM.net Company Profile |
SEC |
Zacks Reports |
StockTalk |
News |
Chart |
Request a new note
C
A N
S L
I M
|
N
-
NYSE
Netsuite Inc
DIVERSIFIED SERVICES - Business/Management Services
|
$68.00
|
+0.34
0.50% |
$68.86
|
321,826
91.69% of 50 DAV
50 DAV is 351,000
|
$75.75
-10.23%
|
12/12/2012
|
$64.75
|
PP = $67.12
|
|
MB = $70.48
|
Most Recent Note - 2/19/2013 1:28:56 PM
G - Consolidating above its 50 DMA line ($66.74 now) today. Damaging losses below that short-term average or the recent low ($65.31 on 2/13/13) may trigger technical sell signals. Concerns were raised following a worrisome "negative reversal" on 2/01/13 after initially gapping up for a new 52-week high, and recent notes have repeatedly cautioned - "Reported earnings +20% on +33% sales revenues for the Dec '12 quarter, below the +25% minimum earnings guideline (C criteria) raising fundamental concerns."
>>> The latest Featured Stock Update with an annotated graph appeared on 2/5/2013. Click here.
View all notes |
Alert me of new notes |
CANSLIM.net Company Profile |
SEC |
Zacks Reports |
StockTalk |
News |
Chart |
Request a new note
C
A N
S L
I M
|
NSR
-
NYSE
Neustar Inc
TELECOMMUNICATIONS - Diversified Communication Serv
|
$45.86
|
-0.81
-1.74% |
$46.90
|
412,923
95.17% of 50 DAV
50 DAV is 433,900
|
$47.24
-2.92%
|
12/11/2012
|
$41.85
|
PP = $41.41
|
|
MB = $43.48
|
Most Recent Note - 2/19/2013 1:35:47 PM
G - Still hovering near its 52-week high, and volume totals have been cooling while holding its ground stubbornly. Extended from its prior base above which its 50 DMA line (now $43.72) defines near-term support.
>>> The latest Featured Stock Update with an annotated graph appeared on 2/1/2013. Click here.
View all notes |
Alert me of new notes |
CANSLIM.net Company Profile |
SEC |
Zacks Reports |
StockTalk |
News |
Chart |
Request a new note
C
A N
S L
I M
|
RNF
-
NYSE
Rentech Nitrogen Ptnr Lp
CHEMICALS - Agricultural Chemicals
|
$41.68
|
-1.34
-3.11% |
$43.50
|
456,975
121.02% of 50 DAV
50 DAV is 377,600
|
$49.18
-15.25%
|
11/1/2012
|
$39.11
|
PP = $40.15
|
|
MB = $42.16
|
Most Recent Note - 2/15/2013 6:36:09 PM
G - Slumped back near its 50 DMA line today with above average volume behind its loss. Showed a prompt and encouraging sign of support near that important short-term average and prior highs in the $41 area this week. Subsequent damaging losses below the prior session's low ($40.95) would raise more serious concerns and trigger additional worrisome technical sell signals.
>>> The latest Featured Stock Update with an annotated graph appeared on 2/12/2013. Click here.
View all notes |
Alert me of new notes |
CANSLIM.net Company Profile |
SEC |
Zacks Reports |
StockTalk |
News |
Chart |
Request a new note
C
A N
S L
I M
|
Symbol/Exchange
Company Name
Industry Group |
PRICE |
CHANGE
(%Change) |
Day High |
Volume
(% DAV)
(% 50 day avg vol) |
52 Wk Hi
% From Hi |
Featured
Date |
Price
Featured |
Pivot Featured |
|
Max Buy |
SFUN
-
NYSE
Soufun Hldgs Ltd Ads A
INTERNET - Internet Information Providers
|
$25.90
|
-0.48
-1.82% |
$26.71
|
547,833
188.65% of 50 DAV
50 DAV is 290,400
|
$29.16
-11.18%
|
2/11/2013
|
$27.46
|
PP = $29.26
|
|
MB = $30.72
|
Most Recent Note - 2/19/2013 11:57:51 AM
Y - Trading down today with volume running at an above average pace while retreating toward important near-term support at its 50 DMA line. Disciplined investors may watch for subsequent volume-driven gains to confirm a proper technical buy signal.
>>> The latest Featured Stock Update with an annotated graph appeared on 2/11/2013. Click here.
View all notes |
Alert me of new notes |
CANSLIM.net Company Profile |
SEC |
Zacks Reports |
StockTalk |
News |
Chart |
Request a new note
C
A N
S L
I M
|
VRX
-
NYSE
Valeant Pharmaceuticals
DRUGS - Drug Manufacturers - Other
|
$66.24
|
-0.78
-1.16% |
$67.65
|
1,087,092
80.53% of 50 DAV
50 DAV is 1,350,000
|
$67.98
-2.56%
|
12/20/2012
|
$60.24
|
PP = $61.21
|
|
MB = $64.27
|
Most Recent Note - 2/15/2013 6:29:48 PM
G - Consolidating near its 52-week high. An upward trendline connecting its November - December lows defines initial chart support to watch above its 50 DMA line. See the latest FSU analysis for more details and a new annotated graph.
>>> The latest Featured Stock Update with an annotated graph appeared on 2/15/2013. Click here.
View all notes |
Alert me of new notes |
CANSLIM.net Company Profile |
SEC |
Zacks Reports |
StockTalk |
News |
Chart |
Request a new note
C
A N
S L
I M
|
|
|
|
THESE ARE NOT BUY RECOMMENDATIONS!
Comments contained in the body of this report are technical
opinions only. The material herein has been obtained
from sources believed to be reliable and accurate, however,
its accuracy and completeness cannot be guaranteed.
This site is not an investment advisor, hence it does
not endorse or recommend any securities or other investments.
Any recommendation contained in this report may not
be suitable for all investors and it is not to be deemed
an offer or solicitation on our part with respect to
the purchase or sale of any securities. All trademarks,
service marks and trade names appearing in this report
are the property of their respective owners, and are
likewise used for identification purposes only.
This report is a service available
only to active Paid Premium Members.
You may opt-out of receiving report notifications
at any time. Questions or comments may be submitted
by writing to Premium Membership Services 665 S.E. 10 Street, Suite 201 Deerfield Beach, FL 33441-5634 or by calling 1-800-965-8307
or 954-785-1121.
|
|
|

