You are not logged in.
This means you
CAN ONLY VIEW reports that were published prior to Monday, April 14, 2025.
You
MUST UPGRADE YOUR MEMBERSHIP if you want to see any current reports.
AFTER MARKET UPDATE - TUESDAY, FEBRUARY 19TH, 2013
Previous After Market Report Next After Market Report >>>
|
|
|
|
DOW |
+53.91 |
14,035.67 |
+0.39% |
|
Volume |
734,588,750 |
-22% |
|
Volume |
1,780,177,830 |
-2% |
|
NASDAQ |
+21.56 |
3,213.59 |
+0.68% |
|
Advancers |
2,085 |
67% |
|
Advancers |
1,677 |
65% |
|
S&P 500 |
+11.15 |
1,530.94 |
+0.73% |
|
Decliners |
931 |
30% |
|
Decliners |
815 |
32% |
|
Russell 2000 |
+8.85 |
932.00 |
+0.96% |
|
52 Wk Highs |
400 |
|
|
52 Wk Highs |
240 |
|
|
S&P 600 |
+5.51 |
521.94 |
+1.07% |
|
52 Wk Lows |
21 |
|
|
52 Wk Lows |
18 |
|
|
 |
Major Averages Posted Gains With Positive Breadth
Kenneth J. Gruneisen - Passed the CAN SLIM® Master's Exam
The major averages rose as investors returned from the long holiday weekend in a buying mood. The volume totals were reported lighter on the NYSE and on the Nasdaq exchange, down from Friday's totals which were inflated by options expirations. Breadth was positive as advancing issues led decliners by 2-1 on the NYSE and on the Nasdaq exchange. The total number of stocks hitting new 52-week highs easily outnumbered new 52-week lows on the NYSE and on the Nasdaq exchange. There were 91 high-ranked companies from the CANSLIM.net Leaders List making new 52-week highs and appearing on the CANSLIM.net BreakOuts Page, down slightly from the prior session total of 95 stocks. There were gains for 9 of the 13 high-ranked companies currently included on the Featured Stocks Page.
Stocks rallied from the opening bell as investors overlooked tepid economic data following reports of fresh M&A activity. Looking at the data, U.S. home builder confidence fell to 46 in February, falling short of the expected reading of 48. Pulte Group Inc (PHM -1.8%) fell after the report.
Nine of the 10 sectors on the S&P were higher, led by gains in energy stocks with ConocoPhillips (COP +2.77%) among the session's solid winners. On the earnings front, Express Scripts Holding Co (ESRX +2.56%) rallied after topping estimates in the quarter. Industrials outperformed with Sealed Air (SEE +9.0%) rallying on its positive earnings results. Materials were the laggard with miner Freeport McMoRan Copper & Gold Inc (FCX -2.2%) falling amid weakness in metal prices. Office Depot Inc (ODP +9.37%) and Office Max Inc (OMX +20.93%) rallied on reports that the two companies were in advanced merger talks. In other news, shares of Google Inc (GOOG +1.76%) topped $800 a share for the first time in its history.
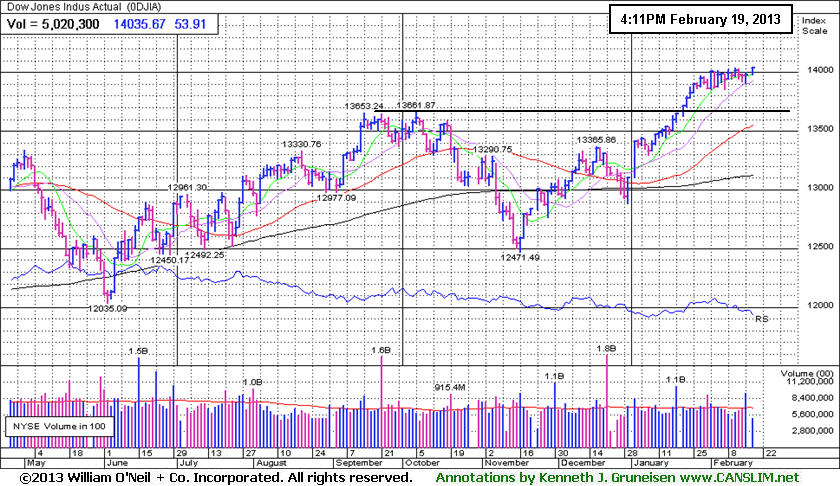
The latest rally has produced a few action worthy candidates meeting all of the fact-based investment system's criteria. Selectivity and discipline are required, as always. Investors may consider new buying efforts in stocks meeting all key criteria, as the market's (M criteria) confirmed uptrend has been comprised by great leadership (stocks hitting new 52-week highs) in the broader market. Widespread gains helped all of the major averages blast higher, and the benchmark S&P 500 Index is perched at its best level in more than five years and just off its October 2007 all-time high.
Watch for an announcement via email concerning the next WEBCAST. The webcast will also be available via an updated link highlighted at the top of the Premium Member Homepage.
PICTURED: The Dow Jones Industrial Average managed its best close of 2013 and it is now perched only -1.1% off its October 2007 all-time high.
|
 Kenneth J. Gruneisen started out as a licensed stockbroker in August 1987, a couple of months prior to the historic stock market crash that took the Dow Jones Industrial Average down -22.6% in a single day. He has published daily fact-based fundamental and technical analysis on high-ranked stocks online for two decades. Through FACTBASEDINVESTING.COM, Kenneth provides educational articles, news, market commentary, and other information regarding proven investment systems that work in good times and bad.
Comments contained in the body of this report are technical opinions only and are not necessarily those of Gruneisen Growth Corp. The material herein has been obtained from sources believed to be reliable and accurate, however, its accuracy and completeness cannot be guaranteed. Our firm, employees, and customers may effect transactions, including transactions contrary to any recommendation herein, or have positions in the securities mentioned herein or options with respect thereto. Any recommendation contained in this report may not be suitable for all investors and it is not to be deemed an offer or solicitation on our part with respect to the purchase or sale of any securities. |
|
 |
Financial, Retail, Tech and Energy-Related Groups Rose
Kenneth J. Gruneisen - Passed the CAN SLIM® Master's Exam
The Bank Index ($BKX +0.64%) and Broker/Dealer Index ($XBD +0.65%) posted modest gains underpinning the major averages' rally. The Retail Index ($RLX +0.77%) also was a positive influence, and the Internet Index ($IIX +0.73%), Networking Index ($NWX +0.95%), Semiconductor Index ($SOX +1.20%), and Biotechnology Index ($BTK +0.32%) tallied unanimous gains. Strength in energy-related stocks gave the Integrated Oil Index ($XOI +1.47%) and the Oil Services Index ($OSX +0.67%) a boost. Meanwhile, defensive groups were laggards as the Gold & Silver Index ($XAU -1.33%) and the Healthcare Index ($HMO -1.24%) lost ground.
Charts courtesy www.stockcharts.com
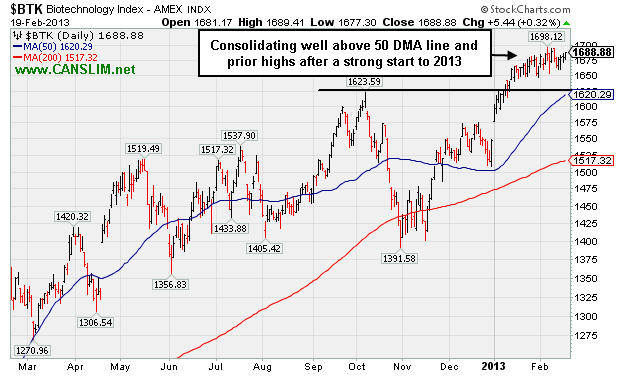
PICTURED: The Biotechnology Index ($BTK +0.32%) is consolidating well above its 50-day moving average (DMA) line and prior highs after a strong start to 2013.
| Oil Services |
$OSX |
253.66 |
+1.70 |
+0.67% |
+15.22% |
| Healthcare |
$HMO |
2,773.72 |
-34.80 |
-1.24% |
+10.32% |
| Integrated Oil |
$XOI |
1,356.11 |
+19.58 |
+1.47% |
+9.20% |
| Semiconductor |
$SOX |
433.64 |
+5.14 |
+1.20% |
+12.91% |
| Networking |
$NWX |
245.62 |
+2.32 |
+0.95% |
+8.42% |
| Internet |
$IIX |
364.36 |
+2.65 |
+0.73% |
+11.43% |
| Broker/Dealer |
$XBD |
109.93 |
+0.71 |
+0.65% |
+16.54% |
| Retail |
$RLX |
708.90 |
+5.41 |
+0.77% |
+8.55% |
| Gold & Silver |
$XAU |
141.99 |
-1.91 |
-1.33% |
-14.26% |
| Bank |
$BKX |
55.46 |
+0.35 |
+0.64% |
+8.15% |
| Biotech |
$BTK |
1,688.88 |
+5.44 |
+0.32% |
+9.17% |
|
|
|
 |
Following Sub Par Earnings Bullish Action Has Continued
Kenneth J. Gruneisen - Passed the CAN SLIM® Master's Exam
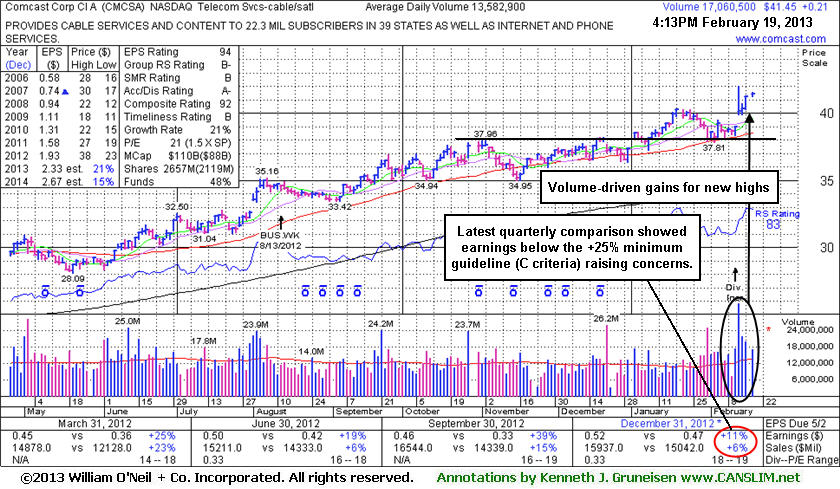
Comcast Corp Cl A (CMCSA +$0.21 or +0.51% to $41.45) traded up today near its 52-week high hit during a streak of 5 consecutive gains backed by above average volume. It remains free to rally unhindered by resistance due to overhead supply, and patient investors may give it the benefit of the doubt while watching out for technical sell signals, seeing if it may go on to tally more climactic gains. Recently the company reported earnings +11% on +6% sales revenues (see red circle) for the Dec '12 quarter, below the +25% minimum earnings guideline (C criteria), raising fundamental concerns, yet bullish action has continued. It was last shown in this FSU section on 1/29/13 with an annotated graph under the headline "Distributional Pressure After Wedging Higher Following Breakout". It recently found support after dipping near its 50-day moving average (DMA) line again. Closely coinciding with that important short-term average, the prior highs in the $38 area also helped define chart support to watch.
The high-ranked Telecom Services - Cable/Satellite firm has earned good ranks. Its annual earnings (A criteria) history has been strong and leadership from other firms in the industry group is a reassuring sign concerning the L criteria. The number of top-rated funds owning its shares rose from 1,916 in Jun '11 to 2,256 in Dec '12, a reassuring sign concerning the I criteria. Its huge supply of 2.097 billion shares in the float could make it less likely to be a great sprinter, meanwhile, the S criteria calls for investors to usually look at small-cap or mid-cap companies.
|
|
|
Color Codes Explained :
Y - Better candidates highlighted by our
staff of experts.
G - Previously featured
in past reports as yellow but may no longer be buyable under the
guidelines.
***Last / Change / Volume data in this table is the closing quote data***
Symbol/Exchange
Company Name
Industry Group |
PRICE |
CHANGE
(%Change) |
Day High |
Volume
(% DAV)
(% 50 day avg vol) |
52 Wk Hi
% From Hi |
Featured
Date |
Price
Featured |
Pivot Featured |
|
Max Buy |
BGS
-
NYSE
B & G Foods Inc
FOOD andamp; BEVERAGE - Processed andamp; Packaged Goods
|
$30.00
|
-0.04
-0.13% |
$30.03
|
731,041
220.53% of 50 DAV
50 DAV is 331,500
|
$33.14
-9.47%
|
2/14/2013
|
$32.82
|
PP = $32.50
|
|
MB = $34.13
|
 Most Recent Note - 2/19/2013 1:41:31 PM
Edging lower with above average volume today. A gap down and violation of its 50 DMA line triggered a technical sell signal on the prior session. Finished near the session low and virtually unchanged after highlighted in yellow in the 2/14/13 mid-day report (read here) with pivot point cited based on its 1/28/13 high, failing to clinch a proper technical buy signal. Damaging weakness came after it reported earnings +7% on +16% sales revenues for the Dec '12 quarter, below the +25% minimum guideline (C criteria). Based on recent fundamental and technical deterioration it will be dropped from the Featured Stocks list tonight.
>>> The latest Featured Stock Update with an annotated graph appeared on 2/14/2013. Click here.
View all notes |
Alert me of new notes |
CANSLIM.net Company Profile |
SEC |
Zacks Reports |
StockTalk |
News |
Chart |
Request a new note
C
A N
S L
I M


|
CELG
-
NASDAQ
Celgene Corp
DRUGS - Drug Manufacturers - Major
|
$100.46
|
+1.69
1.71% |
$100.56
|
2,370,584
63.92% of 50 DAV
50 DAV is 3,708,400
|
$102.29
-1.79%
|
12/11/2012
|
$82.24
|
PP = $81.34
|
|
MB = $85.41
|
Most Recent Note - 2/14/2013 7:02:13 PM
G - Volume totals have been cooling in recent weeks while it has stubbornly hovered near its all-time high, holding its ground. That price/volume action is an encouraging indication that few investors have been headed for the exit. Its 50 DMA line (now $89.92) defines important support to watch on pullbacks.
>>> The latest Featured Stock Update with an annotated graph appeared on 2/4/2013. Click here.
View all notes |
Alert me of new notes |
CANSLIM.net Company Profile |
SEC |
Zacks Reports |
StockTalk |
News |
Chart |
Request a new note
C
A N
S L
I M
|
CFNL
-
NASDAQ
Cardinal Financial Corp
BANKING - Regional - Southeast Banks
|
$16.56
|
+0.02
0.12% |
$16.63
|
359,042
186.23% of 50 DAV
50 DAV is 192,800
|
$16.90
-2.01%
|
12/3/2012
|
$15.20
|
PP = $16.31
|
|
MB = $17.13
|
Most Recent Note - 2/19/2013 12:24:20 PM
Y - Consolidating above its 50 DMA line today, and trading in a tight range in recent weeks without making meaningful progress above prior highs. Subsequent losses leading to a damaging 50 DMA line violation or a slump below the recent low ($15.74 on 1/18/13) would raise concerns and trigger technical sell signals.
>>> The latest Featured Stock Update with an annotated graph appeared on 1/31/2013. Click here.
View all notes |
Alert me of new notes |
CANSLIM.net Company Profile |
SEC |
Zacks Reports |
StockTalk |
News |
Chart |
Request a new note
C
A N
S L
I M
|
CMCSA
-
NASDAQ
Comcast Corp Cl A
MEDIA - CATV Systems
|
$41.45
|
+0.21
0.51% |
$41.57
|
17,080,729
125.75% of 50 DAV
50 DAV is 13,582,900
|
$42.00
-1.31%
|
12/3/2012
|
$37.08
|
PP = $38.06
|
|
MB = $39.96
|
Most Recent Note - 2/19/2013 4:55:14 PM
G - Traded up today near its 52-week high hit during a streak of 5 consecutive gains backed by above average volume. Reported earnings +11% on +6% sales revenues for the Dec '12 quarter, below the +25% minimum earnings guideline (C criteria), raising fundamental concerns, yet bullish action has continued. See the latest FSU analysis for more details and a new annotated graph.
>>> The latest Featured Stock Update with an annotated graph appeared on 2/19/2013. Click here.
View all notes |
Alert me of new notes |
CANSLIM.net Company Profile |
SEC |
Zacks Reports |
StockTalk |
News |
Chart |
Request a new note
C
A N
S L
I M
|
KORS
-
NYSE
Michael Kors Hldgs Ltd
RETAIL - Apparel Stores
|
$64.84
|
+1.57
2.48% |
$65.10
|
6,978,639
160.64% of 50 DAV
50 DAV is 4,344,200
|
$64.80
0.06%
|
1/23/2013
|
$54.98
|
PP = $58.72
|
|
MB = $61.66
|
Most Recent Note - 2/15/2013 6:39:18 PM
G - Tallied additional volume-driven gains and finished the week strong. On Tuesday it gapped up after reporting earnings +129% on +70% sales revenues for the Dec '12 quarter versus the year ago period. Its considerable "breakaway gap" for a new high with heavy volume while blasting above the pivot point triggered a convincing technical buy signal. Color code is changed to green after getting more extended beyond its "max buy" level.
>>> The latest Featured Stock Update with an annotated graph appeared on 2/7/2013. Click here.
View all notes |
Alert me of new notes |
CANSLIM.net Company Profile |
SEC |
Zacks Reports |
StockTalk |
News |
Chart |
Request a new note
C
A N
S L
I M
|
Symbol/Exchange
Company Name
Industry Group |
PRICE |
CHANGE
(%Change) |
Day High |
Volume
(% DAV)
(% 50 day avg vol) |
52 Wk Hi
% From Hi |
Featured
Date |
Price
Featured |
Pivot Featured |
|
Max Buy |
LNKD
-
NYSE
Linkedin Corp Class A
INTERNET - Internet Information Providers
|
$160.76
|
-1.90
-1.17% |
$161.20
|
2,705,170
129.96% of 50 DAV
50 DAV is 2,081,500
|
$163.00
-1.37%
|
2/8/2013
|
$147.04
|
PP = $127.55
|
|
MB = $133.93
|
Most Recent Note - 2/14/2013 6:53:28 PM
G - Finished near the session high as it tallied another gain today with +34% above average volume while getting even more extended. Disciplined investors may watch for secondary buy points or additional bases to possibly form and be noted in the weeks ahead.
>>> The latest Featured Stock Update with an annotated graph appeared on 2/8/2013. Click here.
View all notes |
Alert me of new notes |
CANSLIM.net Company Profile |
SEC |
Zacks Reports |
StockTalk |
News |
Chart |
Request a new note
C
A N
S L
I M
|
MIDD
-
NASDAQ
Middleby Corp
MANUFACTURING - Diversified Machinery
|
$149.71
|
+1.63
1.10% |
$150.61
|
60,954
64.91% of 50 DAV
50 DAV is 93,900
|
$151.49
-1.17%
|
10/8/2012
|
$118.46
|
PP = $122.67
|
|
MB = $128.80
|
Most Recent Note - 2/15/2013 12:33:30 PM
G - Hovering near its all-time high still, but enduring distributional pressure this week with above average volume behind 2 recent losses. Fundamental concerns were recently noted and prior reports cautioned members that it is extended from any sound base. Prior highs and its 50 DMA line define important near-term chart support in the $134-135 area.
>>> The latest Featured Stock Update with an annotated graph appeared on 1/30/2013. Click here.
View all notes |
Alert me of new notes |
CANSLIM.net Company Profile |
SEC |
Zacks Reports |
StockTalk |
News |
Chart |
Request a new note
C
A N
S L
I M
|
N
-
NYSE
Netsuite Inc
DIVERSIFIED SERVICES - Business/Management Services
|
$67.66
|
-0.70
-1.02% |
$68.47
|
579,479
166.37% of 50 DAV
50 DAV is 348,300
|
$75.75
-10.68%
|
12/12/2012
|
$64.75
|
PP = $67.12
|
|
MB = $70.48
|
Most Recent Note - 2/19/2013 1:28:56 PM
G - Consolidating above its 50 DMA line ($66.74 now) today. Damaging losses below that short-term average or the recent low ($65.31 on 2/13/13) may trigger technical sell signals. Concerns were raised following a worrisome "negative reversal" on 2/01/13 after initially gapping up for a new 52-week high, and recent notes have repeatedly cautioned - "Reported earnings +20% on +33% sales revenues for the Dec '12 quarter, below the +25% minimum earnings guideline (C criteria) raising fundamental concerns."
>>> The latest Featured Stock Update with an annotated graph appeared on 2/5/2013. Click here.
View all notes |
Alert me of new notes |
CANSLIM.net Company Profile |
SEC |
Zacks Reports |
StockTalk |
News |
Chart |
Request a new note
C
A N
S L
I M
|
NP
-
NYSE
Neenah Paper Inc
CONSUMER NON-DURABLES - Paper and Paper Products
|
$29.95
|
+0.36
1.22% |
$29.99
|
122,629
154.44% of 50 DAV
50 DAV is 79,400
|
$32.57
-8.04%
|
1/25/2013
|
$31.80
|
PP = $31.76
|
|
MB = $33.35
|
Most Recent Note - 2/19/2013 1:33:35 PM
Tallying small gains after a recent slump below its 50 DMA line raised more concerns. A prompt rebound above that important short-term average would be a reassuring sign. However, its Relative Strength (RS) rating has slumped to a 63, well below the 80+ minimum guideline for buy candidates under the fact-based investment system. Based on the recent weakness it faces resistance due to overhead supply up through the $31-31 area, and it will be dropped from the Featured Stocks list tonight.
>>> The latest Featured Stock Update with an annotated graph appeared on 2/13/2013. Click here.
View all notes |
Alert me of new notes |
CANSLIM.net Company Profile |
SEC |
Zacks Reports |
StockTalk |
News |
Chart |
Request a new note
C
A N
S L
I M
|
NSR
-
NYSE
Neustar Inc
TELECOMMUNICATIONS - Diversified Communication Serv
|
$46.67
|
+0.25
0.54% |
$46.98
|
392,719
90.53% of 50 DAV
50 DAV is 433,800
|
$47.24
-1.21%
|
12/11/2012
|
$41.85
|
PP = $41.41
|
|
MB = $43.48
|
Most Recent Note - 2/19/2013 1:35:47 PM
G - Still hovering near its 52-week high, and volume totals have been cooling while holding its ground stubbornly. Extended from its prior base above which its 50 DMA line (now $43.72) defines near-term support.
>>> The latest Featured Stock Update with an annotated graph appeared on 2/1/2013. Click here.
View all notes |
Alert me of new notes |
CANSLIM.net Company Profile |
SEC |
Zacks Reports |
StockTalk |
News |
Chart |
Request a new note
C
A N
S L
I M
|
Symbol/Exchange
Company Name
Industry Group |
PRICE |
CHANGE
(%Change) |
Day High |
Volume
(% DAV)
(% 50 day avg vol) |
52 Wk Hi
% From Hi |
Featured
Date |
Price
Featured |
Pivot Featured |
|
Max Buy |
RNF
-
NYSE
Rentech Nitrogen Ptnr Lp
CHEMICALS - Agricultural Chemicals
|
$43.02
|
+0.47
1.10% |
$43.43
|
433,693
116.12% of 50 DAV
50 DAV is 373,500
|
$49.18
-12.53%
|
11/1/2012
|
$39.11
|
PP = $40.15
|
|
MB = $42.16
|
Most Recent Note - 2/15/2013 6:36:09 PM
G - Slumped back near its 50 DMA line today with above average volume behind its loss. Showed a prompt and encouraging sign of support near that important short-term average and prior highs in the $41 area this week. Subsequent damaging losses below the prior session's low ($40.95) would raise more serious concerns and trigger additional worrisome technical sell signals.
>>> The latest Featured Stock Update with an annotated graph appeared on 2/12/2013. Click here.
View all notes |
Alert me of new notes |
CANSLIM.net Company Profile |
SEC |
Zacks Reports |
StockTalk |
News |
Chart |
Request a new note
C
A N
S L
I M
|
SFUN
-
NYSE
Soufun Hldgs Ltd Ads A
INTERNET - Internet Information Providers
|
$26.38
|
-1.64
-5.85% |
$27.85
|
464,335
159.62% of 50 DAV
50 DAV is 290,900
|
$29.16
-9.53%
|
2/11/2013
|
$27.46
|
PP = $29.26
|
|
MB = $30.72
|
Most Recent Note - 2/19/2013 11:57:51 AM
Y - Trading down today with volume running at an above average pace while retreating toward important near-term support at its 50 DMA line. Disciplined investors may watch for subsequent volume-driven gains to confirm a proper technical buy signal.
>>> The latest Featured Stock Update with an annotated graph appeared on 2/11/2013. Click here.
View all notes |
Alert me of new notes |
CANSLIM.net Company Profile |
SEC |
Zacks Reports |
StockTalk |
News |
Chart |
Request a new note
C
A N
S L
I M
|
VRX
-
NYSE
Valeant Pharmaceuticals
DRUGS - Drug Manufacturers - Other
|
$67.02
|
+0.49
0.74% |
$67.15
|
687,270
49.56% of 50 DAV
50 DAV is 1,386,700
|
$67.98
-1.41%
|
12/20/2012
|
$60.24
|
PP = $61.21
|
|
MB = $64.27
|
Most Recent Note - 2/15/2013 6:29:48 PM
G - Consolidating near its 52-week high. An upward trendline connecting its November - December lows defines initial chart support to watch above its 50 DMA line. See the latest FSU analysis for more details and a new annotated graph.
>>> The latest Featured Stock Update with an annotated graph appeared on 2/15/2013. Click here.
View all notes |
Alert me of new notes |
CANSLIM.net Company Profile |
SEC |
Zacks Reports |
StockTalk |
News |
Chart |
Request a new note
C
A N
S L
I M
|
|
|
|
THESE ARE NOT BUY RECOMMENDATIONS!
Comments contained in the body of this report are technical
opinions only. The material herein has been obtained
from sources believed to be reliable and accurate, however,
its accuracy and completeness cannot be guaranteed.
This site is not an investment advisor, hence it does
not endorse or recommend any securities or other investments.
Any recommendation contained in this report may not
be suitable for all investors and it is not to be deemed
an offer or solicitation on our part with respect to
the purchase or sale of any securities. All trademarks,
service marks and trade names appearing in this report
are the property of their respective owners, and are
likewise used for identification purposes only.
This report is a service available
only to active Paid Premium Members.
You may opt-out of receiving report notifications
at any time. Questions or comments may be submitted
by writing to Premium Membership Services 665 S.E. 10 Street, Suite 201 Deerfield Beach, FL 33441-5634 or by calling 1-800-965-8307
or 954-785-1121.
|
|
|

