You are not logged in.
This means you
CAN ONLY VIEW reports that were published prior to Monday, February 26, 2024.
You
MUST UPGRADE YOUR MEMBERSHIP if you want to see any current reports.
AFTER MARKET UPDATE - TUESDAY, FEBRUARY 18TH, 2020
Previous After Market Report Next After Market Report >>>
|
|
|
|
DOW |
-165.89 |
29,232.19 |
-0.56% |
|
Volume |
916,399,670 |
+9% |
|
Volume |
2,239,166,760 |
+1% |
|
NASDAQ |
+1.56 |
9,732.74 |
+0.02% |
|
Advancers |
1,190 |
41% |
|
Advancers |
1,455 |
45% |
|
S&P 500 |
-9.87 |
3,370.29 |
-0.29% |
|
Decliners |
1,685 |
59% |
|
Decliners |
1,758 |
55% |
|
Russell 2000 |
-4.06 |
1,683.52 |
-0.24% |
|
52 Wk Highs |
241 |
|
|
52 Wk Highs |
200 |
|
|
S&P 600 |
-5.60 |
1,012.67 |
-0.55% |
|
52 Wk Lows |
75 |
|
|
52 Wk Lows |
63 |
|
|
 |
Mixed Session as Major Indices Remain Perched at Record Highs
Kenneth J. Gruneisen - Passed the CAN SLIM® Master's Exam
The Dow fell 165 points, while the S&P 500 declined 0.3%. The Nasdaq Composite edged up less than 0.1% to close at a fresh record high. Decliners led advancers by a 4-3 margin on the NYSE and by 9-7 on the Nasdaq exchange. The reported volume totals were higher than the prior session totals on the NYSE and on the Nasdaq exchange. There were 90 high-ranked companies from the Leaders List that hit a new 52-week high and were listed on the BreakOuts Page, versus 92 on the prior session. New 52-week highs totals again solidly outnumbered new 52-week lows on the NYSE and on the Nasdaq exchange. The major indices' (M criteria) remain in a confirmed uptrend. Disciplined investors buy individual stocks on a case-by-case basis only if all key criteria are met. The Featured Stocks Page provides the most timely analysis on high-ranked leaders. Charts used courtesy of www.stockcharts.com
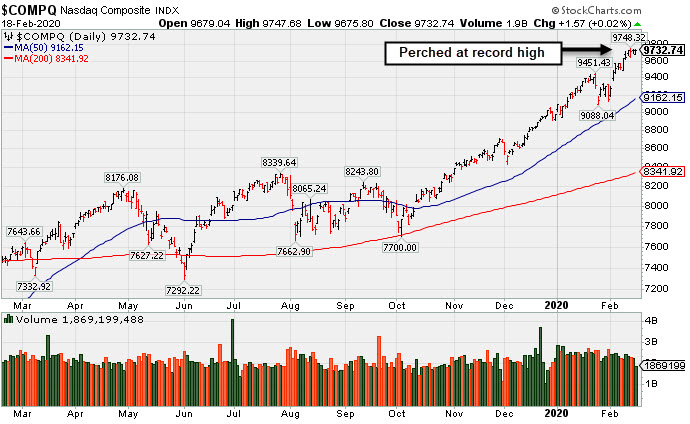
PICTURED: The Nasdaq Composite Index is perched near its all-time high.
Stocks finished mixed on Tuesday. Risk sentiment wavered after Apple (AAPL -1.83%) warned that the coronavirus could negatively impact Chinese growth more than previously expected. With the region accounting for roughly 20% of total sales, the iPhone maker cautioned investors that it would likely miss its quarterly revenue target.
In earnings, Walmart (WMT +1.48%) rose despite posting disappointing quarterly figures. Elsewhere, HSBC (HSBC -5.59%) fell after Europe’s largest bank by assets widely missed analyst profit expectations and announced a broad restructuring. In other corporate news, Kroger (KR +5.24%) rose after Warren Buffett’s Berkshire Hathaway disclosed a $500 million stake in the grocery chain. In M&A activity, investment management firm Legg Mason (LM +24.41%) rose following an announced acquisition by Franklin Resources (BEN +6.94%) worth $4.5 billion.
Treasuries strengthened amid increased demand for perceived safe haven assets. The yield on the 10-year note was down three basis points to 1.56%. The yield curve flattened, with the spread between the two- and 10-year rates narrowing to the smallest gap since November on global growth worries. In commodities, COMEX gold jumped 1.2%, breaching the $1,600 mark for the first time since 2013. WTI crude erased an early session loss to finish unchanged at $52.05/barrel.
On the data front, the Empire Manufacturing survey registered its best reading since last May this month. Separately, the NAHB revealed U.S. homebuilder sentiment decreased slightly in February, but remains near the highest level in 20 years. |
 Kenneth J. Gruneisen started out as a licensed stockbroker in August 1987, a couple of months prior to the historic stock market crash that took the Dow Jones Industrial Average down -22.6% in a single day. He has published daily fact-based fundamental and technical analysis on high-ranked stocks online for two decades. Through FACTBASEDINVESTING.COM, Kenneth provides educational articles, news, market commentary, and other information regarding proven investment systems that work in good times and bad.
Comments contained in the body of this report are technical opinions only and are not necessarily those of Gruneisen Growth Corp. The material herein has been obtained from sources believed to be reliable and accurate, however, its accuracy and completeness cannot be guaranteed. Our firm, employees, and customers may effect transactions, including transactions contrary to any recommendation herein, or have positions in the securities mentioned herein or options with respect thereto. Any recommendation contained in this report may not be suitable for all investors and it is not to be deemed an offer or solicitation on our part with respect to the purchase or sale of any securities. |
|
 |
Gold & Silver Index Posted Standout Gain
Kenneth J. Gruneisen - Passed the CAN SLIM® Master's Exam
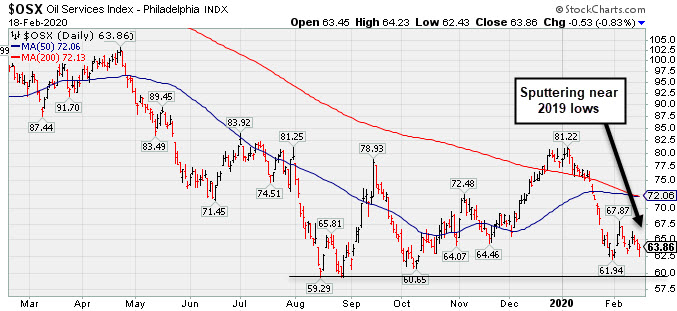
The Bank Index ($BKX -1.38%) outpaced the Broker/Dealer Index ($XBD -0.30%) to the downside, meanwhile the Retail Index ($RLX +0.45%) posted a modest gain. The Biotech Index ($BTK +0.12%) eked out a small gain while the Networking Index ($NWX -0.68%) edged lower and the Semiconductor Index ($SOX -1.40%) suffered a larger loss. Energy-linked groups had a negative bias as the Oil Services Index ($OSX -0.83%) and Integrated Oil Index ($XOI -0.59%) both fell. The Gold & Silver Index ($XAU +3.86%) was a standout gainer.
PICTURED: The Oil Services Index ($OSX -0.83%) has been sputtering near its 2019 lows.
| Oil Services |
$OSX |
63.86 |
-0.53 |
-0.82% |
-18.43% |
| Integrated Oil |
$XOI |
1,116.42 |
-6.63 |
-0.59% |
-12.13% |
| Semiconductor |
$SOX |
1,929.12 |
-27.44 |
-1.40% |
+4.30% |
| Networking |
$NWX |
559.88 |
-3.86 |
-0.68% |
-4.03% |
| Broker/Dealer |
$XBD |
301.80 |
-0.90 |
-0.30% |
+3.93% |
| Retail |
$RLX |
2,676.78 |
+12.12 |
+0.45% |
+9.29% |
| Gold & Silver |
$XAU |
105.95 |
+3.94 |
+3.86% |
-0.91% |
| Bank |
$BKX |
107.72 |
-1.51 |
-1.38% |
-4.98% |
| Biotech |
$BTK |
5,261.33 |
+6.09 |
+0.12% |
+3.83% |
|
|
|
 |
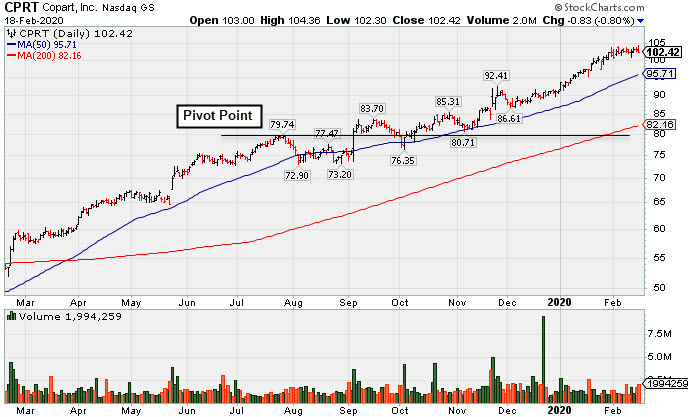
Perched at Record High With Earnings News Due
Kenneth J. Gruneisen - Passed the CAN SLIM® Master's Exam
Copart Inc (CPRT -$0.83 or -0.80% to $102.42) reversed into the red today after touching a new all-time high. It has been stubbornly holding its ground, extended from any sound base. Its 50-day moving average (DMA) line ($95.71) defines near-term support above prior highs in the $91-92 area. Keep in mind that it is due to report earnings news after the close on Wednesday, February 19, 2020. Volume and volatility often increase near earnings news.
Bullish action came after it reported earnings +38% on +20% sales revenues for the Oct '19 quarter, continuing its strong earnings track record. The past 3 quarterly earnings increases were above the +25% minimum guideline (C criteria) and its sales revenues growth rate has accelerated. Annual earnings (A criteria) history has been strong and steady since a downturn in FY '13.
CPRT has rallied as much as +31.9% since 9/05/19 when it was first highlighted in yellow with pivot point cited based on its 7/26/19 high plus 10 cents (read here). It was last shown in this FSU session on 1/28/20 with an annotated graph under the headline, "New High With Yet Another Gain Backed by Light Volume".
The number of top-rated funds owning its shares rose from 1,120 in Sep '18 to 1,525 in Dec '19, a reassuring sign concerning the I criteria. It has a Timeliness Rating of B and Sponsorship Rating of B. Its current Up/Down Volume Ratio of 1.8 is an unbiased indication its shares have been under accumulation over the past 50 days. |
|
|
Color Codes Explained :
Y - Better candidates highlighted by our
staff of experts.
G - Previously featured
in past reports as yellow but may no longer be buyable under the
guidelines.
***Last / Change / Volume data in this table is the closing quote data***
Symbol/Exchange
Company Name
Industry Group |
PRICE |
CHANGE
(%Change) |
Day High |
Volume
(% DAV)
(% 50 day avg vol) |
52 Wk Hi
% From Hi |
Featured
Date |
Price
Featured |
Pivot Featured |
|
Max Buy |
 FTNT
-
NASDAQ
FTNT
-
NASDAQ
Fortinet Inc
Computer Sftwr-Security
|
$119.45
|
+0.26
0.22% |
$121.27
|
917,181
82.63% of 50 DAV
50 DAV is 1,110,000
|
$121.82
-1.95%
|
12/9/2019
|
$103.85
|
PP = $106.10
|
|
MB = $111.41
|
Most Recent Note - 2/12/2020 6:32:47 PM
G - Reported earnings +29% on +21% sales revenues for the Dec '19 quarter, continuing its strong earnings track record above the +25% minimum guideline (C criteria). Consolidating above the prior low ($112.06) and 50 DMA line ($112.05) which coincide defining important near-term support to watch.
>>> FEATURED STOCK ARTICLE : Fortinet Posted Gain for Best-Ever Close - 2/4/2020 |
View all notes |
Set NEW NOTE alert |
Company Profile |
SEC
News |
Chart |
Request a new note
C
A
S
I |
SPSC
-
NASDAQ
S P S Commerce Inc
COMPUTER SOFTWARE and SERVICES - Application Software
|
$60.98
|
+0.51
0.84% |
$61.28
|
270,421
162.22% of 50 DAV
50 DAV is 166,700
|
$62.26
-2.06%
|
11/29/2019
|
$56.59
|
PP = $59.24
|
|
MB = $62.20
|
Most Recent Note - 2/14/2020 12:28:26 PM
Y - Hit a new all-time high with today's early gain. Reported earnings +30% on +12% sales revenues for the Dec '19 quarter versus the year ago period. Volume and volatility often increase near earnings news. Found support near its 50 DMA line ($57) during its recent consolidation. Its current Relative Strength Rating of 75 is below the 80+ minimum guideline for buy candidates. A gain and strong close above its pivot point backed by at least +40% above average volume may trigger a new technical buy signal.
>>> FEATURED STOCK ARTICLE : Perched Near High Finding Support at 50-Day Average - 2/3/2020 |
View all notes |
Set NEW NOTE alert |
Company Profile |
SEC
News |
Chart |
Request a new note
C
A
S
I |
AUDC
-
NASDAQ
Audiocodes Ltd
ELECTRONICS - Scientific and Technical Instrum
|
$23.39
|
-0.76
-3.15% |
$24.10
|
235,443
66.89% of 50 DAV
50 DAV is 352,000
|
$28.73
-18.59%
|
9/13/2019
|
$19.68
|
PP = $19.84
|
|
MB = $20.83
|
Most Recent Note - 2/14/2020 5:25:30 PM
G - Met resistance today after rebounding near its 50 DMA line ($24.94). That short-term average may act as resistance after damaging volume-driven losses triggered technical sell signals. Fundamentals remain strong after it reported earnings +30% on +15% sales revenues for the Dec '19 quarter. See the latest FSU analysis for more details and a new annotated graph.
>>> FEATURED STOCK ARTICLE : Rebounding After Damaging Losses Triggered Sell Signals - 2/14/2020 |
View all notes |
Set NEW NOTE alert |
Company Profile |
SEC
News |
Chart |
Request a new note
C
A
S
I |
CHDN
-
NASDAQ
Churchill Downs Inc
LEISURE - Gaming Activities
|
$164.21
|
+2.02
1.25% |
$164.22
|
283,388
144.59% of 50 DAV
50 DAV is 196,000
|
$163.63
0.35%
|
10/8/2019
|
$129.77
|
PP = $132.83
|
|
MB = $139.47
|
 Most Recent Note - 2/18/2020 12:16:54 PM
G - Perched at its 52-week high following a streak of gains. Its 50 DMA line ($141.79) defines near-term support above the prior low ($132.55 on 1/03/19) The Jun and Sep '19 quarterly earnings versus the year ago periods were both below the +25% minimum guideline (C criteria) and raised fundamental concerns.
>>> FEATURED STOCK ARTICLE : Perched at New Record High After Recent Gains on Average Volume - 2/7/2020 |
View all notes |
Set NEW NOTE alert |
Company Profile |
SEC
News |
Chart |
Request a new note
C
A
S
I |
LULU
-
NASDAQ
Lululemon Athletica
MANUFACTURING - Textile Manufacturing
|
$259.23
|
+4.82
1.89% |
$259.74
|
1,269,439
68.58% of 50 DAV
50 DAV is 1,851,000
|
$256.80
0.95%
|
9/6/2019
|
$201.25
|
PP = $194.35
|
|
MB = $204.07
|
Most Recent Note - 2/18/2020 5:21:44 PM
G - Extended from any sound base and it hit yet another new all-time high with today's gain backed by light volume. Its 50 DMA line ($237.81) and prior low ($231.84 on 1/27/20) define important near-term support to watch. Fundamentals remain strong.
>>> FEATURED STOCK ARTICLE : Volume Totals Cooling While Hovering Near All-Time High - 1/30/2020 |
View all notes |
Set NEW NOTE alert |
Company Profile |
SEC
News |
Chart |
Request a new note
C
A
S
I |
Symbol/Exchange
Company Name
Industry Group |
PRICE |
CHANGE
(%Change) |
Day High |
Volume
(% DAV)
(% 50 day avg vol) |
52 Wk Hi
% From Hi |
Featured
Date |
Price
Featured |
Pivot Featured |
|
Max Buy |
CPRT
-
NASDAQ
Copart Inc
SPECIALTY RETAIL - Auto Dealerships
|
$102.42
|
-0.83
-0.80% |
$104.36
|
1,994,259
126.14% of 50 DAV
50 DAV is 1,581,000
|
$104.10
-1.61%
|
1/2/2020
|
$92.80
|
PP = $92.51
|
|
MB = $97.14
|
Most Recent Note - 2/18/2020 5:18:32 PM
G - Due to report earning news after the close on Wednesday. Touched a new all-time high today but reversed into the red. Stubbornly holding its ground, extended from any sound base. Its 50 DMA line ($95.71) defines near-term support above prior highs in the $91-92 area. See the latest FSU analysis for more details and a new annotated graph.
>>> FEATURED STOCK ARTICLE : Perched at Record High With Earnings News Due - 2/18/2020 |
View all notes |
Set NEW NOTE alert |
Company Profile |
SEC
News |
Chart |
Request a new note
C
A
S
I |
SPLK
-
NASDAQ
Splunk Inc
Computer Sftwr-Database
|
$172.88
|
+0.36
0.21% |
$174.08
|
843,501
55.79% of 50 DAV
50 DAV is 1,512,000
|
$173.84
-0.55%
|
11/25/2019
|
$147.79
|
PP = $142.16
|
|
MB = $149.27
|
Most Recent Note - 2/18/2020 5:23:58 PM
G - Posted a 6th consecutive gain on light volume today for a new all-time high. It is extended from the previously noted base. Its 50 DMA line ($155.61) defines important support to watch on pullbacks.
>>> FEATURED STOCK ARTICLE : Volume Totals Cooling While Hovering Near All-Time High - 1/29/2020 |
View all notes |
Set NEW NOTE alert |
Company Profile |
SEC
News |
Chart |
Request a new note
C
A
S
I |
PAYC
-
NYSE
Paycom Software Inc
COMPUTER SOFTWARE and SERVICES - Application Software
|
$318.16
|
+3.73
1.19% |
$318.51
|
665,447
76.14% of 50 DAV
50 DAV is 874,000
|
$342.00
-6.97%
|
11/20/2019
|
$252.97
|
PP = $259.81
|
|
MB = $272.80
|
Most Recent Note - 2/14/2020 5:27:50 PM
G - Posted a 3rd consecutive gain, rebounding after an abrupt retreat near its 50 DMA line ($286.64) and prior high ($279.95 on 11/27/19). More damaging losses would raise concerns and trigger a technical sell signal. Fundamentals remain strong after it reported earnings +41% on +29% for the Dec '19 quarter.
>>> FEATURED STOCK ARTICLE : Pulled Back Near 50-Day Average Following Strong Earnings Report - 2/11/2020 |
View all notes |
Set NEW NOTE alert |
Company Profile |
SEC
News |
Chart |
Request a new note
C
A
S
I |
BLD
-
NYSE
Topbuild Corp
Bldg-Constr Prds/Misc
|
$120.63
|
+2.05
1.73% |
$120.74
|
213,574
76.28% of 50 DAV
50 DAV is 280,000
|
$120.71
-0.07%
|
12/9/2019
|
$109.71
|
PP = $113.84
|
|
MB = $119.53
|
Most Recent Note - 2/18/2020 5:20:14 PM
G - Touched a new 52-week high today and its color code is changed to green after closing above its "max buy" level. Prior high ($113.74) defines near-term support above its 50 DMA line ($109.79).
>>> FEATURED STOCK ARTICLE : Volume Totals Cooling While Consolidating Near All-Time High - 2/6/2020 |
View all notes |
Set NEW NOTE alert |
Company Profile |
SEC
News |
Chart |
Request a new note
C
A
S
I |
TEAM
-
NASDAQ
Atlassian Corp Plc Cl A
Comp Sftwr-Spec Enterprs
|
$153.88
|
-0.54
-0.35% |
$155.78
|
1,620,531
106.26% of 50 DAV
50 DAV is 1,525,000
|
$155.00
-0.72%
|
1/24/2020
|
$144.66
|
PP = $140.49
|
|
MB = $147.51
|
Most Recent Note - 2/18/2020 5:26:54 PM
G - Extended from the prior base and perched above its "max buy" level. Rallied from a cup-with-handle base pattern with volume +514% above average behind the considerable gain on 1/24/20 triggering a technical buy signal. Bullish action came after it reported earnings +48% on +37% sales revenues for the Dec '19 quarter.
>>> FEATURED STOCK ARTICLE : Atlassian Has Been Hovering Near its All-Time High - 2/12/2020 |
View all notes |
Set NEW NOTE alert |
Company Profile |
SEC
News |
Chart |
Request a new note
C
A
S
I |
Symbol/Exchange
Company Name
Industry Group |
PRICE |
CHANGE
(%Change) |
Day High |
Volume
(% DAV)
(% 50 day avg vol) |
52 Wk Hi
% From Hi |
Featured
Date |
Price
Featured |
Pivot Featured |
|
Max Buy |
GLOB
-
NYSE
Globant SA
Computer-Tech Services
|
$128.61
|
+0.63
0.49% |
$130.44
|
184,128
76.72% of 50 DAV
50 DAV is 240,000
|
$131.00
-1.82%
|
11/14/2019
|
$106.87
|
PP = $112.43
|
|
MB = $118.05
|
Most Recent Note - 2/12/2020 6:25:24 PM
G - Consolidating near its high after wedging to new highs with gains lacking great volume conviction. Its prior high ($112.33) and 50 DMA line ($112.68) define important near-term support to watch.
>>> FEATURED STOCK ARTICLE : Encountering Distributional Pressure After Wedging to New Highs - 2/5/2020 |
View all notes |
Set NEW NOTE alert |
Company Profile |
SEC
News |
Chart |
Request a new note
C
A
S
I |
STNE
-
NASDAQ
Stoneco Ltd Cl A
Finance-CrdtCard/PmtPr
|
$41.82
|
+0.00
0.00% |
$42.17
|
1,592,853
94.14% of 50 DAV
50 DAV is 1,692,000
|
$45.72
-8.53%
|
1/22/2020
|
$43.94
|
PP = $45.72
|
|
MB = $48.01
|
Most Recent Note - 2/18/2020 5:25:36 PM
Y - Consolidating above its 50 DMA line ($40.99) and its color code is changed to yellow. Subsequent gains above the pivot point backed by at least +40% above average volume are needed to trigger a technical buy signal.
>>> FEATURED STOCK ARTICLE : 50-Day Moving Average Line Violation Hurts Outlook - 2/10/2020 |
View all notes |
Set NEW NOTE alert |
Company Profile |
SEC
News |
Chart |
Request a new note
C
A
S
I |
DAVA
-
NYSE
Endava Plc Cl A Ads
Computer-Tech Services
|
$53.39
|
+0.07
0.13% |
$53.71
|
178,846
173.64% of 50 DAV
50 DAV is 103,000
|
$55.50
-3.80%
|
2/13/2020
|
$53.71
|
PP = $49.86
|
|
MB = $52.35
|
Most Recent Note - 2/18/2020 12:19:50 PM
Y - Pulling back for a 2nd session following a considerable gain for a new all-time high triggering a technical buy signal when highlighted in the 2/13/20 mid-day report. Found prompt support near its 50 DMA line ($47.26) during recent consolidations. Bullish action came after it reported earnings +60% on +24% sales revenues for the quarter ended December 31, 2019 versus the year ago period, marking its 6th consecutive quarter with earnings increasing above the +25 minimum guideline (C criteria). Completed a Secondary Offering on 4/17/19. Limited history was noted as a concern for this UK-based Computer - Tech Services firm since it completed its $20 IPO on 7/27/18.
>>> FEATURED STOCK ARTICLE : Breakout Gain Backed By +462% Above Average Volme - 2/13/2020 |
View all notes |
Set NEW NOTE alert |
Company Profile |
SEC
News |
Chart |
Request a new note
C
A
S
I |
|
|
|
THESE ARE NOT BUY RECOMMENDATIONS!
Comments contained in the body of this report are technical
opinions only. The material herein has been obtained
from sources believed to be reliable and accurate, however,
its accuracy and completeness cannot be guaranteed.
This site is not an investment advisor, hence it does
not endorse or recommend any securities or other investments.
Any recommendation contained in this report may not
be suitable for all investors and it is not to be deemed
an offer or solicitation on our part with respect to
the purchase or sale of any securities. All trademarks,
service marks and trade names appearing in this report
are the property of their respective owners, and are
likewise used for identification purposes only.
This report is a service available
only to active Paid Premium Members.
You may opt-out of receiving report notifications
at any time. Questions or comments may be submitted
by writing to Premium Membership Services 665 S.E. 10 Street, Suite 201 Deerfield Beach, FL 33441-5634 or by calling 1-800-965-8307
or 954-785-1121.
|
|
|