***Last / Change / Volume data in this table is the closing quote data***
Symbol/Exchange
Company Name
Industry Group |
PRICE |
CHANGE
(%Change) |
Day High |
Volume
(% DAV)
(% 50 day avg vol) |
52 Wk Hi
% From Hi |
Featured
Date |
Price
Featured |
Pivot Featured |
|
Max Buy |
ADS
-
NYSE
Alliance Data Sys Corp
COMPUTER SOFTWARE and SERVICES - Information and Delivery Service
|
$119.68
|
-0.94
-0.78% |
$120.73
|
921,108
128.00% of 50 DAV
50 DAV is 719,600
|
$122.62
-2.40%
|
1/17/2012
|
$108.24
|
PP = $107.43
|
|
MB = $112.80
|
 Most Recent Note - 2/16/2012 11:18:48 AM
G - Pulling back today after a streak of 6 consecutive gains into new high territory. Its 50 DMA line defines support to watch on pullbacks while it is now extended from its latest base.
>>> The latest Featured Stock Update with an annotated graph appeared on 1/17/2012. Click here.
View all notes |
Alert me of new notes |
CANSLIM.net Company Profile |
SEC |
Zacks Reports |
StockTalk |
News |
Chart |
Request a new note
C
A N
S L
I M


|
ALXN
-
NASDAQ
Alexion Pharmaceuticals
DRUGS - Drug Manufacturers - Other
|
$83.00
|
-0.01
-0.01% |
$84.00
|
982,756
80.49% of 50 DAV
50 DAV is 1,221,000
|
$85.48
-2.90%
|
11/30/2011
|
$68.66
|
PP = $70.52
|
|
MB = $74.05
|
Most Recent Note - 2/16/2012 11:21:48 AM
G - Quietly holding its ground following volume-driven gains for new all-time highs. Extended from its prior base. Prior resistance in the $70 area defines chart support coinciding with its 50 DMA line.
>>> The latest Featured Stock Update with an annotated graph appeared on 1/13/2012. Click here.
View all notes |
Alert me of new notes |
CANSLIM.net Company Profile |
SEC |
Zacks Reports |
StockTalk |
News |
Chart |
Request a new note
C
A N
S L
I M
|
BODY
-
NASDAQ
Body Central Corp
RETAIL - Catalog andamp; Mail Order Houses
|
$28.46
|
+0.32
1.14% |
$28.93
|
390,700
243.73% of 50 DAV
50 DAV is 160,300
|
$28.67
-0.73%
|
1/27/2012
|
$26.69
|
PP = $25.46
|
|
MB = $26.73
|
Most Recent Note - 2/16/2012 11:23:36 AM
G - Up today for another new all-time high, getting more extended from its prior base. Prior highs in the $25-26 area recently acted as support after encountering some distributional pressure.
>>> The latest Featured Stock Update with an annotated graph appeared on 1/27/2012. Click here.
View all notes |
Alert me of new notes |
CANSLIM.net Company Profile |
SEC |
Zacks Reports |
StockTalk |
News |
Chart |
Request a new note
C
A N
S L
I M
|
CATM
-
NASDAQ
Cardtronics Inc
DIVERSIFIED SERVICES - Business/Management Services
|
$27.03
|
+0.40
1.50% |
$27.23
|
323,932
77.50% of 50 DAV
50 DAV is 418,000
|
$28.74
-5.95%
|
12/23/2011
|
$28.64
|
PP = $28.56
|
|
MB = $29.99
|
Most Recent Note - 2/13/2012 6:13:43 PM
G - Consolidating near its 50 DMA line today, it found prompt support after it tested its 200 DMA line recently. Reported earnings +38% on +29% sales revenues for the quarter ended December 31, 2011 versus the year ago period.
>>> The latest Featured Stock Update with an annotated graph appeared on 1/30/2012. Click here.
View all notes |
Alert me of new notes |
CANSLIM.net Company Profile |
SEC |
Zacks Reports |
StockTalk |
News |
Chart |
Request a new note
C
A N
S L
I M
|
CDNS
-
NASDAQ
Cadence Design Systems
COMPUTER SOFTWARE and SERVICES - Technical and System Software
|
$12.03
|
+0.09
0.75% |
$12.06
|
3,136,030
107.70% of 50 DAV
50 DAV is 2,911,700
|
$12.00
0.25%
|
2/3/2012
|
$11.66
|
PP = $11.15
|
|
MB = $11.71
|
Most Recent Note - 2/13/2012 5:42:43 PM
G - Down today on lighter than average volume, finishing near the session low and near its "max buy" level. No resistance remains due to overhead supply following strong technical action.
>>> The latest Featured Stock Update with an annotated graph appeared on 2/3/2012. Click here.
View all notes |
Alert me of new notes |
CANSLIM.net Company Profile |
SEC |
Zacks Reports |
StockTalk |
News |
Chart |
Request a new note
C
A N
S L
I M
|
Symbol/Exchange
Company Name
Industry Group |
PRICE |
CHANGE
(%Change) |
Day High |
Volume
(% DAV)
(% 50 day avg vol) |
52 Wk Hi
% From Hi |
Featured
Date |
Price
Featured |
Pivot Featured |
|
Max Buy |
CELG
-
NASDAQ
Celgene Corp
DRUGS - Drug Manufacturers - Major
|
$75.50
|
+0.90
1.21% |
$75.74
|
2,648,954
77.10% of 50 DAV
50 DAV is 3,435,700
|
$76.09
-0.78%
|
2/2/2012
|
$74.16
|
PP = $75.21
|
|
MB = $78.97
|
Most Recent Note - 2/14/2012 6:53:11 PM
Y - Finished the session at its high and just 2 cents off its best-ever close with a gain on average volume. Held its ground in a tight range since the advanced "3-weeks tight" base pattern was previously noted. Still perched within close striking distance of its all-time high ($77.39 in Aug '08). Its 50 DMA line defines initial support above its prior highs in the $68 area.
>>> The latest Featured Stock Update with an annotated graph appeared on 2/2/2012. Click here.
View all notes |
Alert me of new notes |
CANSLIM.net Company Profile |
SEC |
Zacks Reports |
StockTalk |
News |
Chart |
Request a new note
C
A N
S L
I M
|
FEIC
-
NASDAQ
F E I Co
ELECTRONICS - Diversified Electronics
|
$45.99
|
+1.50
3.37% |
$46.04
|
529,118
196.11% of 50 DAV
50 DAV is 269,800
|
$48.31
-4.80%
|
12/7/2011
|
$41.41
|
PP = $42.35
|
|
MB = $44.47
|
Most Recent Note - 2/16/2012 5:30:14 PM
G - Consolidating above its 50 DMA line and prior highs in the $43 area defining important chart support. Reported earnings +21% on +14% sales revenues for the latest quarter ended December 31, 2011 versus the year ago period (below the +25% minimum guideline for earnings growth).
>>> The latest Featured Stock Update with an annotated graph appeared on 1/25/2012. Click here.
View all notes |
Alert me of new notes |
CANSLIM.net Company Profile |
SEC |
Zacks Reports |
StockTalk |
News |
Chart |
Request a new note
C
A N
S L
I M
|
GNC
-
NYSE
G N C Holdings Inc
RETAIL - Drug Stores
|
$32.66
|
+2.66
8.87% |
$32.74
|
4,808,655
504.47% of 50 DAV
50 DAV is 953,200
|
$30.32
7.72%
|
1/19/2012
|
$28.99
|
PP = $29.60
|
|
MB = $31.08
|
Most Recent Note - 2/16/2012 12:03:56 PM
Y - Reported earnings +106% on +17% sales revenues for the quarter ended Dec 31, 2011 versus the year ago period. Gapped up today for a new high and volume is nearly 3 times its average daily total, triggering a technical buy signal and quickly getting extended from prior highs in the $29.50 area.
>>> The latest Featured Stock Update with an annotated graph appeared on 1/19/2012. Click here.
View all notes |
Alert me of new notes |
CANSLIM.net Company Profile |
SEC |
Zacks Reports |
StockTalk |
News |
Chart |
Request a new note
C
A N
S L
I M
|
GOLD
-
NASDAQ
Randgold Resources Adr
METALS and MINING - Gold
|
$111.38
|
+0.02
0.02% |
$112.14
|
518,872
101.16% of 50 DAV
50 DAV is 512,900
|
$120.73
-7.74%
|
2/7/2012
|
$116.21
|
PP = $120.83
|
|
MB = $126.87
|
Most Recent Note - 2/14/2012 6:45:23 PM
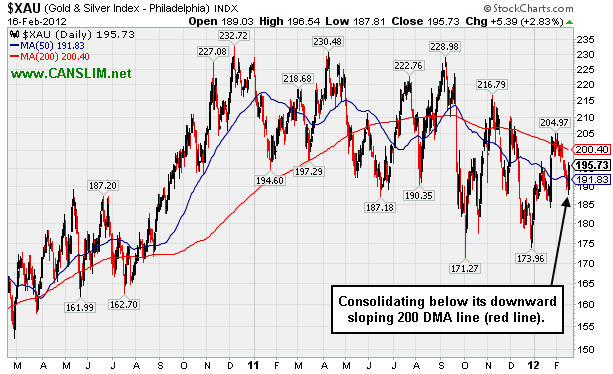
Y - Recent losses on quiet volume have formed a downward sloping "handle" on the previously noted base pattern. Featured in the 2/07/12 mid-day report in yellow with pivot point based on its 52-week high plus 10 cents after a 13-week cup shaped base. This UK-headquartered firm in the Mining - Gold/Silver/Gems group showed very strong sales revenues and earnings increases in the Mar, Jun, Sep, and Dec '11 quarterly comparisons much greater than the +25% minimum guideline. Subsequent volume-driven gains into new high territory may trigger a technical buy signal.
>>> The latest Featured Stock Update with an annotated graph appeared on 2/8/2012. Click here.
View all notes |
Alert me of new notes |
CANSLIM.net Company Profile |
SEC |
Zacks Reports |
StockTalk |
News |
Chart |
Request a new note
C
A N
S L
I M
|
HMSY
-
NASDAQ
H M S Holdings Corp
COMPUTER SOFTWARE and SERVICES - Healthcare Information Service
|
$33.61
|
+0.07
0.21% |
$34.01
|
1,260,897
146.36% of 50 DAV
50 DAV is 861,500
|
$34.98
-3.91%
|
10/27/2011
|
$26.44
|
PP = $28.37
|
|
MB = $29.79
|
Most Recent Note - 2/14/2012 6:47:35 PM
G - Touched a new all-time high but reversed into the red and ended with a small loss on higher (but still below average) volume. Volume totals have been cooling in recent weeks while hovering near its all-time high. No resistance remains to hinder its progress, but it is extended from its prior base. Its 50 DMA line and prior highs near $32 define near-term chart support to watch.
>>> The latest Featured Stock Update with an annotated graph appeared on 2/9/2012. Click here.
View all notes |
Alert me of new notes |
CANSLIM.net Company Profile |
SEC |
Zacks Reports |
StockTalk |
News |
Chart |
Request a new note
C
A N
S L
I M
|
Symbol/Exchange
Company Name
Industry Group |
PRICE |
CHANGE
(%Change) |
Day High |
Volume
(% DAV)
(% 50 day avg vol) |
52 Wk Hi
% From Hi |
Featured
Date |
Price
Featured |
Pivot Featured |
|
Max Buy |
ISRG
-
NASDAQ
Intuitive Surgical Inc
HEALTH SERVICES - Medical Appliances and Equipment
|
$507.54
|
+2.31
0.46% |
$513.25
|
364,874
96.99% of 50 DAV
50 DAV is 376,200
|
$515.61
-1.57%
|
12/20/2011
|
$442.43
|
PP = $449.16
|
|
MB = $471.62
|
Most Recent Note - 2/13/2012 5:51:47 PM
G - Up today with above average volume for another new all-time high, getting more extended from prior highs in the $475 area that may now act as support. Reported earnings +24% on +28% sales revenues for the quarter ended December 31, 2011 versus the year ago period.
>>> The latest Featured Stock Update with an annotated graph appeared on 1/18/2012. Click here.
View all notes |
Alert me of new notes |
CANSLIM.net Company Profile |
SEC |
Zacks Reports |
StockTalk |
News |
Chart |
Request a new note
C
A N
S L
I M
|
LULU
-
NASDAQ
Lululemon Athletica
MANUFACTURING - Textile Manufacturing
|
$65.59
|
+0.72
1.11% |
$65.89
|
1,774,558
60.22% of 50 DAV
50 DAV is 2,947,000
|
$67.22
-2.42%
|
1/10/2012
|
$60.97
|
PP = $59.46
|
|
MB = $62.43
|
Most Recent Note - 2/16/2012 11:27:59 AM
G - Hovering near its all-time high, stubbornly holding its ground with cooling volume totals in recent weeks suggesting that very few are exiting. No resistance remains due to overhead supply, but it is extended from the base pattern previously noted.
>>> The latest Featured Stock Update with an annotated graph appeared on 1/10/2012. Click here.
View all notes |
Alert me of new notes |
CANSLIM.net Company Profile |
SEC |
Zacks Reports |
StockTalk |
News |
Chart |
Request a new note
C
A N
S L
I M
|
MA
-
NYSE
Mastercard Inc Cl A
DIVERSIFIED SERVICES - Business/Management Services
|
$393.15
|
+0.19
0.05% |
$395.87
|
721,613
66.53% of 50 DAV
50 DAV is 1,084,600
|
$401.79
-2.15%
|
2/2/2012
|
$379.05
|
PP = $381.32
|
|
MB = $400.39
|
Most Recent Note - 2/13/2012 6:23:11 PM
Y - Quietly holding its ground perched at its all-time high after a streak of consecutive gains. Prior highs in the mid-$380 area define initial chart support to watch.
>>> The latest Featured Stock Update with an annotated graph appeared on 1/3/2012. Click here.
View all notes |
Alert me of new notes |
CANSLIM.net Company Profile |
SEC |
Zacks Reports |
StockTalk |
News |
Chart |
Request a new note
C
A N
S L
I M
|
MELI
-
NASDAQ
Mercadolibre Inc
INTERNET - Internet Software and; Services
|
$96.88
|
-2.36
-2.38% |
$101.84
|
1,104,105
203.33% of 50 DAV
50 DAV is 543,000
|
$100.43
-3.53%
|
2/6/2012
|
$97.09
|
PP = $95.58
|
|
MB = $100.36
|
Most Recent Note - 2/16/2012 12:22:28 PM
Y - Reversed into the red today after early gains into new 52-week and all-time high territory. Its weakness has quickly erased the prior session's impressive gain backed by 2 times average volume.
>>> The latest Featured Stock Update with an annotated graph appeared on 2/6/2012. Click here.
View all notes |
Alert me of new notes |
CANSLIM.net Company Profile |
SEC |
Zacks Reports |
StockTalk |
News |
Chart |
Request a new note
C
A N
S L
I M
|
MKTX
-
NASDAQ
Marketaxess Holdings Inc
FINANCIAL SERVICES - Investment Brokerage - Nationa
|
$32.65
|
+0.79
2.48% |
$33.25
|
128,903
69.53% of 50 DAV
50 DAV is 185,400
|
$35.42
-7.82%
|
10/28/2011
|
$29.79
|
PP = $31.05
|
|
MB = $32.60
|
Most Recent Note - 2/16/2012 5:31:44 PM
G - Up with lighter than average volume today. Prior highs in the $31-32 area recently acted as chart support when consolidating after volume-driven gains into new high territory.
>>> The latest Featured Stock Update with an annotated graph appeared on 1/24/2012. Click here.
View all notes |
Alert me of new notes |
CANSLIM.net Company Profile |
SEC |
Zacks Reports |
StockTalk |
News |
Chart |
Request a new note
C
A N
S L
I M
|
Symbol/Exchange
Company Name
Industry Group |
PRICE |
CHANGE
(%Change) |
Day High |
Volume
(% DAV)
(% 50 day avg vol) |
52 Wk Hi
% From Hi |
Featured
Date |
Price
Featured |
Pivot Featured |
|
Max Buy |
OSIS
-
NASDAQ
O S I Systems Inc
ELECTRONICS - Semiconductor Equipment and Mate
|
$53.50
|
+1.04
1.98% |
$54.07
|
115,140
118.58% of 50 DAV
50 DAV is 97,100
|
$57.51
-6.97%
|
11/1/2011
|
$42.07
|
PP = $45.57
|
|
MB = $47.85
|
Most Recent Note - 2/15/2012 3:12:28 PM
G - Down today with slightly higher volume indicative of distributional pressure, slumping toward its 50 DMA line which defines important support to watch. Reported earnings +20% on +11% sales revenues for the Dec '11 quarter, which raised concerns as earnings growth was below the +25% minimum earnings guideline.
>>> The latest Featured Stock Update with an annotated graph appeared on 1/31/2012. Click here.
View all notes |
Alert me of new notes |
CANSLIM.net Company Profile |
SEC |
Zacks Reports |
StockTalk |
News |
Chart |
Request a new note
C
A N
S L
I M
|
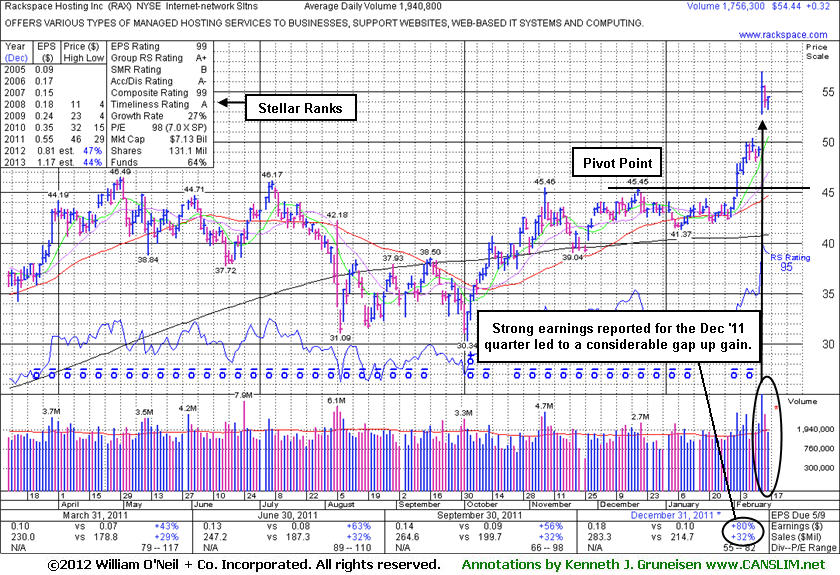
RAX
-
NYSE
Rackspace Hosting Inc
INTERNET - Internet Software and; Services
|
$54.44
|
+0.32
0.59% |
$54.48
|
1,757,660
90.56% of 50 DAV
50 DAV is 1,940,800
|
$56.94
-4.39%
|
2/2/2012
|
$46.69
|
PP = $45.55
|
|
MB = $47.83
|
Most Recent Note - 2/16/2012 5:26:54 PM
G - Holding its ground since its considerable gap up gain with very heavy on 2/14/12 following strong earnings news. It is extended from the previously noted orderly flat base. See the latest FSU analysis for more details and a new annotated graph.
>>> The latest Featured Stock Update with an annotated graph appeared on 2/16/2012. Click here.
View all notes |
Alert me of new notes |
CANSLIM.net Company Profile |
SEC |
Zacks Reports |
StockTalk |
News |
Chart |
Request a new note
C
A N
S L
I M
|
RRTS
-
NYSE
Roadrunner Trans Systems
TRANSPORTATION - Air Delivery and Freight Service
|
$18.25
|
+0.00
0.00% |
$18.30
|
297,751
226.25% of 50 DAV
50 DAV is 131,600
|
$18.44
-1.03%
|
2/10/2012
|
$17.40
|
PP = $17.50
|
|
MB = $18.38
|
Most Recent Note - 2/16/2012 12:29:31 PM
Y - Holding its ground today following a gap up gain with 3 times average volume on the prior session while surging to a new 52-week high near its "max buy" level. Prior highs in the $17 area define initial support to watch on pullbacks.
>>> The latest Featured Stock Update with an annotated graph appeared on 2/13/2012. Click here.
View all notes |
Alert me of new notes |
CANSLIM.net Company Profile |
SEC |
Zacks Reports |
StockTalk |
News |
Chart |
Request a new note
C
A N
S L
I M
|
SWI
-
NYSE
Solarwinds Inc
COMPUTER SOFTWARE and SERVICES - Application Software
|
$37.63
|
+0.68
1.84% |
$37.94
|
986,357
83.14% of 50 DAV
50 DAV is 1,186,400
|
$38.59
-2.49%
|
1/26/2012
|
$32.36
|
PP = $33.78
|
|
MB = $35.47
|
Most Recent Note - 2/15/2012 3:15:16 PM
G - Pulling back from its all-time high with a loss on slightly higher volume today indicative of mild distributional pressure. It is extended from its latest base. Reported earnings +21% on +34% sales revenues for the quarter ended December 31, 2011 versus the year ago period. Earnings below the +25% guideline raise fundamental concerns.
>>> The latest Featured Stock Update with an annotated graph appeared on 1/26/2012. Click here.
View all notes |
Alert me of new notes |
CANSLIM.net Company Profile |
SEC |
Zacks Reports |
StockTalk |
News |
Chart |
Request a new note
C
A N
S L
I M
|
SXCI
-
NASDAQ
S X C Health Solutions
COMPUTER SOFTWARE and SERVICES - Healthcare Information Service
|
$61.20
|
-0.23
-0.37% |
$61.60
|
309,716
93.49% of 50 DAV
50 DAV is 331,300
|
$66.40
-7.83%
|
1/10/2012
|
$62.05
|
PP = $60.10
|
|
MB = $63.11
|
Most Recent Note - 2/14/2012 6:31:17 PM
G - Small gain today with above average volume. Prior highs in the $60 area and its 50 DMA line define chart support to watch. Due to release its fiscal 2011 fourth quarter and year-end financial results before the open on Thursday, February 23, 2012.
>>> The latest Featured Stock Update with an annotated graph appeared on 1/20/2012. Click here.
View all notes |
Alert me of new notes |
CANSLIM.net Company Profile |
SEC |
Zacks Reports |
StockTalk |
News |
Chart |
Request a new note
C
A N
S L
I M
|
Symbol/Exchange
Company Name
Industry Group |
PRICE |
CHANGE
(%Change) |
Day High |
Volume
(% DAV)
(% 50 day avg vol) |
52 Wk Hi
% From Hi |
Featured
Date |
Price
Featured |
Pivot Featured |
|
Max Buy |
TDG
-
NYSE
Transdigm Group Inc
AEROSPACE/DEFENSE - Aerospace/Defense Products and; Services
|
$116.35
|
+1.35
1.17% |
$117.00
|
392,295
117.14% of 50 DAV
50 DAV is 334,900
|
$118.83
-2.09%
|
1/10/2012
|
$98.83
|
PP = $102.83
|
|
MB = $107.97
|
Most Recent Note - 2/14/2012 6:32:48 PM
G - Hovering near its all-time high, extended from its prior base after a spurt of volume-driven gains. Prior highs near $102 define the initial support level to watch above its 50 DMA line.
>>> The latest Featured Stock Update with an annotated graph appeared on 2/10/2012. Click here.
View all notes |
Alert me of new notes |
CANSLIM.net Company Profile |
SEC |
Zacks Reports |
StockTalk |
News |
Chart |
Request a new note
C
A N
S L
I M
|
TNGO
-
NASDAQ
Tangoe Inc
COMPUTER SOFTWARE and SERVICES - Technical and System Software
|
$18.10
|
+1.29
7.67% |
$18.29
|
1,655,802
736.24% of 50 DAV
50 DAV is 224,900
|
$17.89
1.20%
|
2/13/2012
|
$15.39
|
PP = $16.51
|
|
MB = $17.34
|
Most Recent Note - 2/16/2012 12:40:08 PM
G - Following earnings news it rallied with heavy volume and hit another new 52-week high today. Its color code is changed to green after rallying back above its "max buy" level. TNGO was featured in yellow in the 2/13/12 mid-day report (read here) with a pivot point cited based on its 52-week high plus 10 cents. See the latest FSU analysis for more details and an annotated graph.
>>> The latest Featured Stock Update with an annotated graph appeared on 2/14/2012. Click here.
View all notes |
Alert me of new notes |
CANSLIM.net Company Profile |
SEC |
Zacks Reports |
StockTalk |
News |
Chart |
Request a new note
C
A N
S L
I M
|
TSCO
-
NASDAQ
Tractor Supply Co
SPECIALTY RETAIL - Specialty Retail, Other
|
$83.39
|
-0.27
-0.32% |
$84.87
|
434,534
60.13% of 50 DAV
50 DAV is 722,700
|
$87.13
-4.29%
|
1/12/2012
|
$79.12
|
PP = $75.58
|
|
MB = $79.36
|
Most Recent Note - 2/14/2012 6:49:22 PM
G - Volume totals have been cooling while stubbornly holding its ground near its all-time high. Reported earnings +43% on +20% sales revenues for the quarter ended December 31, 2011 versus the year ago period. Prior highs in the mid-$70s which were a resistance area now define initial support to watch on pullbacks.
>>> The latest Featured Stock Update with an annotated graph appeared on 1/12/2012. Click here.
View all notes |
Alert me of new notes |
CANSLIM.net Company Profile |
SEC |
Zacks Reports |
StockTalk |
News |
Chart |
Request a new note
C
A N
S L
I M
|
UA
-
NYSE
Under Armour Inc Cl A
CONSUMER NON-DURABLES - Textile - Apparel Clothing
|
$85.63
|
+1.58
1.88% |
$85.76
|
1,193,535
95.03% of 50 DAV
50 DAV is 1,256,000
|
$87.40
-2.03%
|
2/15/2012
|
$85.77
|
PP = $84.86
|
|
MB = $89.10
|
Most Recent Note - 2/16/2012 5:44:20 PM
Y - Closed above the new pivot point cited but today's gain did not have sufficient volume to trigger a proper technical buy signal following a "negative reversal" on the prior session. See the latest FSU analysis for more details and a new annotated graph.
>>> The latest Featured Stock Update with an annotated graph appeared on 2/15/2012. Click here.
View all notes |
Alert me of new notes |
CANSLIM.net Company Profile |
SEC |
Zacks Reports |
StockTalk |
News |
Chart |
Request a new note
C
A N
S L
I M
|
UBNT
-
NASDAQ
Ubiquiti Networks Inc
TELECOMMUNICATIONS - Diversified Communication Serv
|
$24.12
|
+0.84
3.61% |
$24.76
|
179,543
65.67% of 50 DAV
50 DAV is 273,400
|
$27.23
-11.42%
|
1/27/2012
|
$22.25
|
PP = $23.14
|
|
MB = $24.30
|
Most Recent Note - 2/16/2012 5:28:42 PM
Y - Posted a gain today with below average volume following 3 consecutive losses on below average volume. Consolidating above prior highs in the $23 area noted as initial support to watch on pullbacks.
>>> The latest Featured Stock Update with an annotated graph appeared on 2/1/2012. Click here.
View all notes |
Alert me of new notes |
CANSLIM.net Company Profile |
SEC |
Zacks Reports |
StockTalk |
News |
Chart |
Request a new note
C
A N
S L
I M
|
Symbol/Exchange
Company Name
Industry Group |
PRICE |
CHANGE
(%Change) |
Day High |
Volume
(% DAV)
(% 50 day avg vol) |
52 Wk Hi
% From Hi |
Featured
Date |
Price
Featured |
Pivot Featured |
|
Max Buy |
ULTA
-
NASDAQ
Ulta Salon Cosm & Frag
SPECIALTY RETAIL - Specialty Retail, Other
|
$84.17
|
+0.64
0.77% |
$84.46
|
702,735
88.06% of 50 DAV
50 DAV is 798,000
|
$84.48
-0.37%
|
1/11/2012
|
$71.97
|
PP = $75.80
|
|
MB = $79.59
|
Most Recent Note - 2/16/2012 11:31:36 AM
G - Inching further into all-time high territory, it is extended from any sound base pattern. Prior highs near $75 define initial chart support above its 50 DMA line.
>>> The latest Featured Stock Update with an annotated graph appeared on 1/11/2012. Click here.
View all notes |
Alert me of new notes |
CANSLIM.net Company Profile |
SEC |
Zacks Reports |
StockTalk |
News |
Chart |
Request a new note
C
A N
S L
I M
|
V
-
NYSE
Visa Inc Cl A
DIVERSIFIED SERVICES - Business/Management Services
|
$113.80
|
-1.30
-1.13% |
$115.73
|
3,992,828
96.80% of 50 DAV
50 DAV is 4,124,700
|
$117.18
-2.88%
|
2/2/2012
|
$105.43
|
PP = $104.30
|
|
MB = $109.52
|
Most Recent Note - 2/14/2012 6:38:36 PM
G - Ended at a best-ever close today with a gain on average volume. Prior highs in the $103-104 area define initial support to watch on pullbacks.
>>> The latest Featured Stock Update with an annotated graph appeared on 1/23/2012. Click here.
View all notes |
Alert me of new notes |
CANSLIM.net Company Profile |
SEC |
Zacks Reports |
StockTalk |
News |
Chart |
Request a new note
C
A N
S L
I M
|