Symbol/Exchange
Company Name
Industry Group |
PRICE |
CHANGE
(%Change) |
Day High |
Volume
(% DAV)
(% 50 day avg vol) |
52 Wk Hi
% From Hi |
Featured
Date |
Price
Featured |
Pivot Featured |
|
Max Buy |
BIDU
-
NASDAQ
Baidu Inc Ads
INTERNET - Internet Information Providers
|
$128.71
|
+0.67
0.52% |
$129.75
|
4,243,299
55.03% of 50 DAV
50 DAV is 7,711,500
|
$131.63
-2.22%
|
2/1/2011
|
$117.74
|
PP = $112.08
|
|
MB = $117.68
|
Most Recent Note - 2/11/2011 5:36:29 PM
G - Hit another new all-time high with today's 5th consecutive gain on average volume. Prior highs in the $112-115 area define initial chart support to watch now.
>>> The latest Featured Stock Update with an annotated graph appeared on 2/2/2011. Click here.
View all notes |
Alert me of new notes |
CANSLIM.net Company Profile |
SEC |
Zacks Reports |
StockTalk |
News |
Chart |
Request a new note
C
A N
S L
I M


|
CMG
-
NYSE
Chipotle Mexican Grill
LEISURE - Restaurants
|
$264.01
|
-1.57
-0.59% |
$270.51
|
1,333,829
122.90% of 50 DAV
50 DAV is 1,085,300
|
$275.00
-4.00%
|
2/11/2011
|
$271.15
|
PP = $262.87
|
|
MB = $276.01
|
Most Recent Note - 2/15/2011 3:52:33 PM
Y - Down on near average volume today after a recent spurt of gains with above average volume. Reported strong earnings and technically rallied "straight up from the bottom" from an 11-week cup shaped base without a handle.
>>> The latest Featured Stock Update with an annotated graph appeared on 2/11/2011. Click here.
View all notes |
Alert me of new notes |
CANSLIM.net Company Profile |
SEC |
Zacks Reports |
StockTalk |
News |
Chart |
Request a new note
C
A N
S L
I M
|
CRUS
-
NASDAQ
Cirrus Logic Inc
ELECTRONICS - Semiconductor - Specialized
|
$25.00
|
+0.41
1.67% |
$25.21
|
2,440,893
73.17% of 50 DAV
50 DAV is 3,336,000
|
$25.48
-1.88%
|
1/28/2011
|
$20.69
|
PP = $19.17
|
|
MB = $20.13
|
 Most Recent Note - 2/16/2011 6:25:27 PM
G - Gain on light volume today for a new high close. Holding its ground stubbornly after volume-driven gains, it is extended from its latest sound base pattern. Patience may allow for secondary buy points to develop. Prior highs define chart support levels to watch on pullbacks.
>>> The latest Featured Stock Update with an annotated graph appeared on 1/28/2011. Click here.
View all notes |
Alert me of new notes |
CANSLIM.net Company Profile |
SEC |
Zacks Reports |
StockTalk |
News |
Chart |
Request a new note
C
A N
S L
I M
|
CTSH
-
NASDAQ
Cognizant Tech Sol Cl A
COMPUTER SOFTWARE and SERVICES - Business Software and Services
|
$76.64
|
+0.14
0.18% |
$76.88
|
1,675,981
75.49% of 50 DAV
50 DAV is 2,220,000
|
$77.08
-0.57%
|
2/7/2011
|
$75.09
|
PP = $76.46
|
|
MB = $80.28
|
Most Recent Note - 2/16/2011 6:26:58 PM
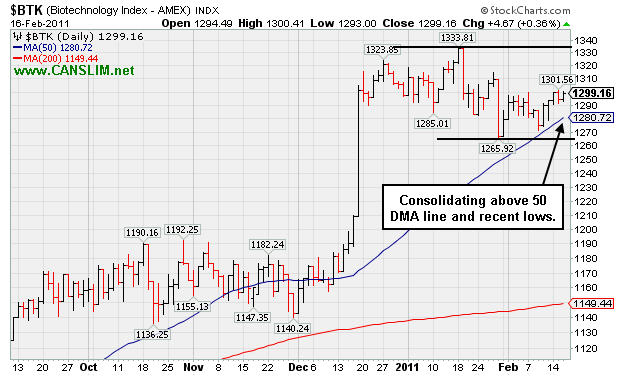
Y - Inched higher for a 4th consecutive small gain today on below average volume. Consolidating above its 50 DMA line, it faces no resistance due to overhead supply after closing the session -0.6% off its 52-week high. See the latest FSU analysis for details and a new annotated graph.
>>> The latest Featured Stock Update with an annotated graph appeared on 2/8/2011. Click here.
View all notes |
Alert me of new notes |
CANSLIM.net Company Profile |
SEC |
Zacks Reports |
StockTalk |
News |
Chart |
Request a new note
C
A N
S L
I M
|
DECK
-
NASDAQ
Deckers Outdoor Corp
CONSUMER NON-DURABLES - Textile - Apparel Footwear
|
$84.25
|
-0.29
-0.34% |
$85.70
|
759,905
45.05% of 50 DAV
50 DAV is 1,686,700
|
$87.88
-4.13%
|
2/3/2011
|
$79.61
|
PP = $82.67
|
|
MB = $86.80
|
Most Recent Note - 2/15/2011 3:59:06 PM
Y - Today quiet loss ends a streak of 10 consecutive gains with below average volume. No gains above the new pivot point came with at least +50% above average volume necessary to technically trigger a proper new (or add-on) buy signal.
>>> The latest Featured Stock Update with an annotated graph appeared on 1/26/2011. Click here.
View all notes |
Alert me of new notes |
CANSLIM.net Company Profile |
SEC |
Zacks Reports |
StockTalk |
News |
Chart |
Request a new note
C
A N
S L
I M
|
Symbol/Exchange
Company Name
Industry Group |
PRICE |
CHANGE
(%Change) |
Day High |
Volume
(% DAV)
(% 50 day avg vol) |
52 Wk Hi
% From Hi |
Featured
Date |
Price
Featured |
Pivot Featured |
|
Max Buy |
EZCH
-
NASDAQ
Ezchip Semiconductor Ltd
ELECTRONICS - Semiconductor - Specialized
|
$30.29
|
+0.17
0.56% |
$30.66
|
289,530
75.46% of 50 DAV
50 DAV is 383,700
|
$33.48
-9.53%
|
12/2/2010
|
$27.53
|
PP = $26.00
|
|
MB = $27.30
|
Most Recent Note - 2/14/2011 3:21:00 PM
G - Today's gain with above average volume is indicative of support near its 50 DMA line. On 2/10/11 it reported earnings +41% on +33% sales revenues for the quarter ended December 31, 2010, and gapped down undercutting its 50 DMA line and prior chart highs in the $29 area then rebounded to close well above both. As previously noted - "Volume and volatility often increase near corporate earnings news."
>>> The latest Featured Stock Update with an annotated graph appeared on 1/21/2011. Click here.
View all notes |
Alert me of new notes |
CANSLIM.net Company Profile |
SEC |
Zacks Reports |
StockTalk |
News |
Chart |
Request a new note
C
A N
S L
I M
|
EZPW
-
NASDAQ
Ezcorp Inc Cl A
SPECIALTY RETAIL - Specialty Retail, Other
|
$27.86
|
+0.40
1.46% |
$27.88
|
179,084
44.91% of 50 DAV
50 DAV is 398,800
|
$29.94
-6.95%
|
11/5/2010
|
$24.02
|
PP = $23.85
|
|
MB = $25.04
|
Most Recent Note - 2/15/2011 4:03:03 PM
G - Small gap down today on below average (but higher) volume led to a close back under its 50 DMA line again. Showing resilience in recent Weeks while volume totals have been cooling, but it has not built a sound new base. Recent low ($25.56 on 1/25/11) defines an important support level now.
>>> The latest Featured Stock Update with an annotated graph appeared on 2/3/2011. Click here.
View all notes |
Alert me of new notes |
CANSLIM.net Company Profile |
SEC |
Zacks Reports |
StockTalk |
News |
Chart |
Request a new note
C
A N
S L
I M
|
FOSL
-
NASDAQ
Fossil Inc
CONSUMER DURABLES - Recreational Goods, Other
|
$79.09
|
+0.32
0.41% |
$80.98
|
1,160,397
170.85% of 50 DAV
50 DAV is 679,200
|
$83.68
-5.49%
|
2/1/2011
|
$73.30
|
PP = $74.44
|
|
MB = $78.16
|
Most Recent Note - 2/16/2011 12:06:18 PM
G - Holding its ground today. Gapped down on 2/15/11 following 8 consecutive gains into new high territory after reporting earnings +42% on +33% sales revenues. Prior resistance in the $74 area defines initial chart support above its 50 DMA line.
>>> The latest Featured Stock Update with an annotated graph appeared on 1/12/2011. Click here.
View all notes |
Alert me of new notes |
CANSLIM.net Company Profile |
SEC |
Zacks Reports |
StockTalk |
News |
Chart |
Request a new note
C
A N
S L
I M
|
HMSY
-
NASDAQ
H M S Holdings Corp
COMPUTER SOFTWARE and SERVICES - Healthcare Information Service
|
$71.07
|
+1.01
1.44% |
$71.60
|
259,045
183.85% of 50 DAV
50 DAV is 140,900
|
$71.13
-0.08%
|
11/19/2010
|
$61.89
|
PP = $63.01
|
|
MB = $66.16
|
Most Recent Note - 2/16/2011 6:17:52 PM
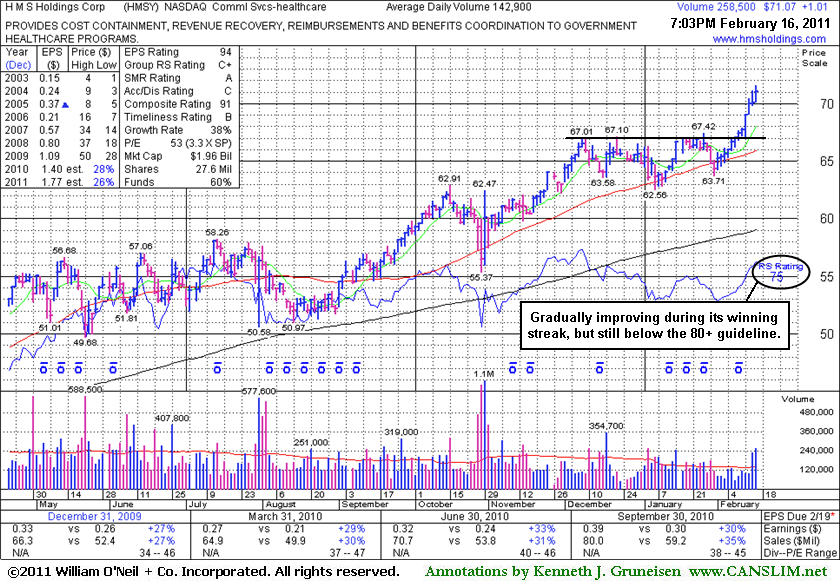
G - Prior highs near $67 define initial support to watch on pullbacks. Hit yet another new 52-week high today with its 12th consecutive gain with ever-increasing volume since it found support at its 50 DMA line. It quietly rose from an orderly base-on-base type pattern. Relative Strength rank (now 75) was noted as a concern and has only gradually improved.
>>> The latest Featured Stock Update with an annotated graph appeared on 1/3/2011. Click here.
View all notes |
Alert me of new notes |
CANSLIM.net Company Profile |
SEC |
Zacks Reports |
StockTalk |
News |
Chart |
Request a new note
C
A N
S L
I M
|
JOBS
-
NASDAQ
Fifty One Job Inc Ads
DIVERSIFIED SERVICES - Staffing and; Outsourcing Service
|
$59.55
|
-0.10
-0.17% |
$61.20
|
66,794
49.19% of 50 DAV
50 DAV is 135,800
|
$61.28
-2.82%
|
2/7/2011
|
$59.23
|
PP = $61.38
|
|
MB = $64.45
|
Most Recent Note - 2/16/2011 6:18:47 PM
Y - Perched near its 52-week high. Its 50 DMA line and recent low ($52.58 on 1/28/11) define important support where violations would raise concerns and trigger technical sell signals. After a long ascending base pattern, subsequent volume-driven gains above its pivot point may trigger a new (or add-on) technical buy signal.
>>> The latest Featured Stock Update with an annotated graph appeared on 2/7/2011. Click here.
View all notes |
Alert me of new notes |
CANSLIM.net Company Profile |
SEC |
Zacks Reports |
StockTalk |
News |
Chart |
Request a new note
C
A N
S L
I M
|
Symbol/Exchange
Company Name
Industry Group |
PRICE |
CHANGE
(%Change) |
Day High |
Volume
(% DAV)
(% 50 day avg vol) |
52 Wk Hi
% From Hi |
Featured
Date |
Price
Featured |
Pivot Featured |
|
Max Buy |
LULU
-
NASDAQ
Lululemon Athletica
MANUFACTURING - Textile Manufacturing
|
$82.60
|
+1.07
1.31% |
$82.95
|
1,229,270
52.59% of 50 DAV
50 DAV is 2,337,600
|
$85.28
-3.14%
|
1/26/2011
|
$68.11
|
PP = $74.70
|
|
MB = $78.44
|
Most Recent Note - 2/15/2011 3:56:10 PM
G - Quietly pulling back from its 52-week high after a streak of 7 consecutive gains with higher volume. Extended from its latest sound base, its prior highs near $74 define chart support to watch now.
>>> The latest Featured Stock Update with an annotated graph appeared on 1/14/2011. Click here.
View all notes |
Alert me of new notes |
CANSLIM.net Company Profile |
SEC |
Zacks Reports |
StockTalk |
News |
Chart |
Request a new note
C
A N
S L
I M
|
MWIV
-
NASDAQ
M W I Veterinary Supply
HEALTH SERVICES - Medical Instruments and; Supplies
|
$71.60
|
+1.14
1.62% |
$72.27
|
72,830
117.85% of 50 DAV
50 DAV is 61,800
|
$70.99
0.86%
|
11/4/2010
|
$61.79
|
PP = $59.60
|
|
MB = $62.58
|
Most Recent Note - 2/11/2011 10:12:56 AM
G - Quietly perched at its all-time high, however it has not built a sound new base pattern. It found support near its 50 DMA line recently. Sales revenues acceleration (bigger percentage increases sequentially) is a very reassuring sign.
>>> The latest Featured Stock Update with an annotated graph appeared on 2/2/2011. Click here.
View all notes |
Alert me of new notes |
CANSLIM.net Company Profile |
SEC |
Zacks Reports |
StockTalk |
News |
Chart |
Request a new note
C
A N
S L
I M
|
NFLX
-
NASDAQ
Netflix Inc
SPECIALTY RETAIL - Music and Video Stores
|
$237.72
|
-3.07
-1.27% |
$244.89
|
6,508,412
115.93% of 50 DAV
50 DAV is 5,613,900
|
$247.55
-3.97%
|
1/10/2011
|
$187.88
|
PP = $209.34
|
|
MB = $219.81
|
Most Recent Note - 2/15/2011 12:32:20 PM
G - Small gap down today followed a considerable gain with above average volume for yet another new all-time high. It has been noted as extended from a sound base, and prior high ($209) defines support to watch above its 50 DMA line.
>>> The latest Featured Stock Update with an annotated graph appeared on 1/10/2011. Click here.
View all notes |
Alert me of new notes |
CANSLIM.net Company Profile |
SEC |
Zacks Reports |
StockTalk |
News |
Chart |
Request a new note
C
A N
S L
I M
|
NTAP
-
NASDAQ
Netapp Inc
COMPUTER HARDWARE - Data Storage Devices
|
$58.54
|
+0.10
0.17% |
$59.19
|
7,913,497
183.01% of 50 DAV
50 DAV is 4,324,000
|
$61.02
-4.06%
|
1/6/2011
|
$57.49
|
PP = $58.06
|
|
MB = $60.96
|
Most Recent Note - 2/16/2011 6:22:09 PM
G - Hovering near its 52-week high, after today's close it reported earnings +30% on +25% sales revenues for the quarter ended January 31, 2011 versus the year ago period. Recently found support near its 50 DMA line. It has not formed any recent sound base pattern.
>>> The latest Featured Stock Update with an annotated graph appeared on 2/4/2011. Click here.
View all notes |
Alert me of new notes |
CANSLIM.net Company Profile |
SEC |
Zacks Reports |
StockTalk |
News |
Chart |
Request a new note
C
A N
S L
I M
|
OPEN
-
NASDAQ
Opentable Inc
INTERNET - Internet Software and Services
|
$92.92
|
+0.37
0.40% |
$93.76
|
833,798
91.62% of 50 DAV
50 DAV is 910,100
|
$95.97
-3.18%
|
1/5/2011
|
$74.05
|
PP = $76.79
|
|
MB = $80.63
|
Most Recent Note - 2/15/2011 6:27:33 PM
G - Quietly consolidating after a streak of volume-driven gains for new all-time highs. Extended from a sound base pattern, meanwhile prior highs define support above its 50 DMA line. See the latest FSU summary for more details and an annotated graph.
>>> The latest Featured Stock Update with an annotated graph appeared on 2/15/2011. Click here.
View all notes |
Alert me of new notes |
CANSLIM.net Company Profile |
SEC |
Zacks Reports |
StockTalk |
News |
Chart |
Request a new note
C
A N
S L
I M
|
Symbol/Exchange
Company Name
Industry Group |
PRICE |
CHANGE
(%Change) |
Day High |
Volume
(% DAV)
(% 50 day avg vol) |
52 Wk Hi
% From Hi |
Featured
Date |
Price
Featured |
Pivot Featured |
|
Max Buy |
ORCL
-
NASDAQ
Oracle Corp
COMPUTER SOFTWARE and SERVICES - Application Software
|
$33.11
|
+0.35
1.07% |
$33.14
|
15,828,719
59.67% of 50 DAV
50 DAV is 26,526,900
|
$33.59
-1.43%
|
1/20/2011
|
$32.31
|
PP = $32.37
|
|
MB = $33.99
|
Most Recent Note - 2/14/2011 2:49:04 PM
Y - Volume totals have been cooling while hovering near its 52-week high, below its "max buy" level. Near-term support to watch is its 50 DMA line.
>>> The latest Featured Stock Update with an annotated graph appeared on 1/7/2011. Click here.
View all notes |
Alert me of new notes |
CANSLIM.net Company Profile |
SEC |
Zacks Reports |
StockTalk |
News |
Chart |
Request a new note
C
A N
S L
I M
|
PAY
-
NYSE
Verifone Systems Inc
COMPUTER HARDWARE - Transaction Automation Systems
|
$49.16
|
+1.21
2.52% |
$49.28
|
1,855,297
121.81% of 50 DAV
50 DAV is 1,523,100
|
$49.07
0.18%
|
1/27/2011
|
$41.77
|
PP = $44.97
|
|
MB = $47.22
|
Most Recent Note - 2/16/2011 6:08:28 PM
G - Gain today with slightly above average volume for another new 52-week high. Technically triggered a new (or add-on) technical buy signal and quickly getting extended beyond its "max buy" level with its 2/14/11 gain. Color code was changed to green.
>>> The latest Featured Stock Update with an annotated graph appeared on 1/27/2011. Click here.
View all notes |
Alert me of new notes |
CANSLIM.net Company Profile |
SEC |
Zacks Reports |
StockTalk |
News |
Chart |
Request a new note
C
A N
S L
I M
|
PCLN
-
NASDAQ
Priceline.Com Inc
INTERNET - Internet Software and Services
|
$458.04
|
+0.84
0.18% |
$461.60
|
658,457
70.32% of 50 DAV
50 DAV is 936,400
|
$464.47
-1.38%
|
1/3/2011
|
$399.55
|
PP = $428.20
|
|
MB = $449.61
|
Most Recent Note - 2/11/2011 5:34:18 PM
G - Color code was changed to green after rising above its "max buy" level this week. Prior highs and its 50 DMA line define support to watch.
>>> The latest Featured Stock Update with an annotated graph appeared on 2/14/2011. Click here.
View all notes |
Alert me of new notes |
CANSLIM.net Company Profile |
SEC |
Zacks Reports |
StockTalk |
News |
Chart |
Request a new note
C
A N
S L
I M
|
RAX
-
NYSE
Rackspace Hosting Inc
INTERNET - Internet Software and; Services
|
$38.68
|
+0.06
0.16% |
$39.40
|
1,219,392
65.57% of 50 DAV
50 DAV is 1,859,700
|
$40.62
-4.78%
|
1/10/2011
|
$22.84
|
PP = $32.76
|
|
MB = $34.40
|
Most Recent Note - 2/14/2011 3:18:02 PM
G - Pulling back today after a considerable gap up on 2/11/11 for a considerable gain on heavy volume after reporting earnings +29% on +27% sales revenues for the quarter ended December 31, 2010 versus the year ago period. It is extended from any sound base. Recent highs near $35 define support to watch above its 50 DMA line.
>>> The latest Featured Stock Update with an annotated graph appeared on 2/9/2011. Click here.
View all notes |
Alert me of new notes |
CANSLIM.net Company Profile |
SEC |
Zacks Reports |
StockTalk |
News |
Chart |
Request a new note
C
A N
S L
I M
|
ROVI
-
NASDAQ
Rovi Corp
COMPUTER SOFTWARE andamp; SERVICES - Security Software andamp; Services
|
$60.15
|
-4.30
-6.67% |
$65.00
|
7,812,145
455.49% of 50 DAV
50 DAV is 1,715,100
|
$69.50
-13.45%
|
10/29/2010
|
$49.99
|
PP = $53.10
|
|
MB = $55.76
|
Most Recent Note - 2/16/2011 6:14:32 PM
G - Weaker fundamentals and technical action raised concerns today after it reported earnings +8% on +2% sales for the quarter ended December 31, 2010 versus the year-ago period and closed near the previously noted 1/31/11 low ($60.15) defining near-term chart support. It violated its 50 DMA line with its largest ever 1-day point loss occurring on more than 4 times average volume, triggering a worrisome technical sell signal.
>>> The latest Featured Stock Update with an annotated graph appeared on 1/25/2011. Click here.
View all notes |
Alert me of new notes |
CANSLIM.net Company Profile |
SEC |
Zacks Reports |
StockTalk |
News |
Chart |
Request a new note
C
A N
S L
I M
|
Symbol/Exchange
Company Name
Industry Group |
PRICE |
CHANGE
(%Change) |
Day High |
Volume
(% DAV)
(% 50 day avg vol) |
52 Wk Hi
% From Hi |
Featured
Date |
Price
Featured |
Pivot Featured |
|
Max Buy |
TIBX
-
NASDAQ
Tibco Software Inc
COMPUTER SOFTWARE and SERVICES - Business Software and Services
|
$25.47
|
+0.14
0.55% |
$25.94
|
1,478,648
53.46% of 50 DAV
50 DAV is 2,765,900
|
$25.70
-0.89%
|
2/1/2011
|
$24.35
|
PP = $22.18
|
|
MB = $23.29
|
Most Recent Note - 2/14/2011 2:46:09 PM
G - Inched to another new 52-week high today with a gain on lighter volume. Extended from its latest sound base, its prior highs in the $22 area define support. See the latest FSU analysis for details and a new annotated graph.
>>> The latest Featured Stock Update with an annotated graph appeared on 2/10/2011. Click here.
View all notes |
Alert me of new notes |
CANSLIM.net Company Profile |
SEC |
Zacks Reports |
StockTalk |
News |
Chart |
Request a new note
C
A N
S L
I M
|
UA
-
NYSE
Under Armour Inc Cl A
CONSUMER NON-DURABLES - Textile - Apparel Clothing
|
$67.77
|
+0.43
0.64% |
$68.27
|
540,440
68.90% of 50 DAV
50 DAV is 784,400
|
$70.43
-3.78%
|
1/27/2011
|
$58.31
|
PP = $56.99
|
|
MB = $59.84
|
Most Recent Note - 2/15/2011 3:53:53 PM
G - Quietly pulling back from its 52-week high following a recent spurt of gains with above average volume. Prior resistance in the $60 area defines initial support to watch above its 50 DMA line.
>>> The latest Featured Stock Update with an annotated graph appeared on 2/1/2011. Click here.
View all notes |
Alert me of new notes |
CANSLIM.net Company Profile |
SEC |
Zacks Reports |
StockTalk |
News |
Chart |
Request a new note
C
A N
S L
I M
|
ULTA
-
NASDAQ
Ulta Salon Cosm & Frag
SPECIALTY RETAIL - Specialty Retail, Other
|
$43.10
|
+0.78
1.84% |
$43.90
|
559,903
96.01% of 50 DAV
50 DAV is 583,200
|
$43.83
-1.67%
|
1/6/2011
|
$36.12
|
PP = $37.34
|
|
MB = $39.21
|
Most Recent Note - 2/16/2011 6:23:49 PM
G - New all-time high close with a small gain today on average volume. It is extended from a sound base pattern, and prior highs in the $37-38 area define chart support to watch above its 50 DMA line.
>>> The latest Featured Stock Update with an annotated graph appeared on 1/6/2011. Click here.
View all notes |
Alert me of new notes |
CANSLIM.net Company Profile |
SEC |
Zacks Reports |
StockTalk |
News |
Chart |
Request a new note
C
A N
S L
I M
|