You are not logged in.
This means you
CAN ONLY VIEW reports that were published prior to Monday, April 14, 2025.
You
MUST UPGRADE YOUR MEMBERSHIP if you want to see any current reports.
AFTER MARKET UPDATE - TUESDAY, FEBRUARY 16TH, 2010
Previous After Market Report Next After Market Report >>>
|
|
|
|
DOW |
+169.67 |
10,268.81 |
+1.68% |
|
Volume |
1,081,300,590 |
-24% |
|
Volume |
2,085,081,120 |
-11% |
|
NASDAQ |
+30.66 |
2,214.19 |
+1.40% |
|
Advancers |
2,527 |
80% |
|
Advancers |
1,948 |
69% |
|
S&P 500 |
+19.36 |
1,094.87 |
+1.80% |
|
Decliners |
513 |
16% |
|
Decliners |
769 |
27% |
|
Russell 2000 |
+10.12 |
620.84 |
+1.66% |
|
52 Wk Highs |
120 |
|
|
52 Wk Highs |
98 |
|
|
S&P 600 |
+4.92 |
328.97 |
+1.52% |
|
52 Wk Lows |
3 |
|
|
52 Wk Lows |
9 |
|
|
 |
Light Volume Behind Indices' Gains Leaves Rally's Conviction In Question
Adam Sarhan, Contributing Writer,
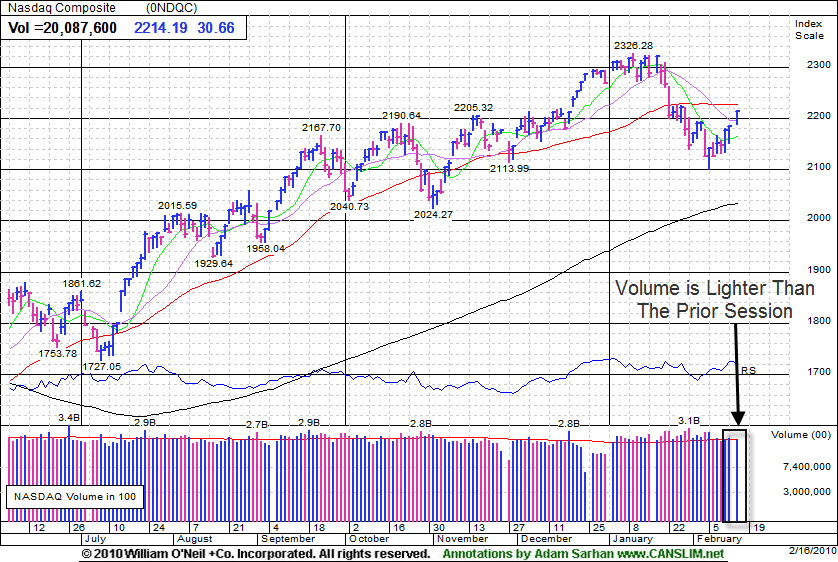
The major averages ended higher after the latest round of stronger than expected economic and earnings data was released. Volume, a critical indicator of institutional sponsorship, was lower than the prior session on both exchanges which prevented the major averages from producing a sound follow-through day. Advancers trumped decliners by almost 5-to-1 on the NYSE and almost 3-to-1 Nasdaq exchange. New 52-week highs outnumbered new lows on both exchanges. There were 35 high-ranked companies from the CANSLIM.net Leaders List that made a new 52-week high and appeared on the CANSLIM.net BreakOuts Page, up from the 18 issues that appeared on the prior session.
Continuing the recent trend that has prevailed for most of this year, the stock market opened with impressive gains on the first trading day of the week. In recent months, that has been followed by steady selling for the remainder of the week. Before Monday's opening bell, the NY Fed released its Empire State Mfg index which topped the Street's estimates. This was the fastest reading in four years and the first manufacturing report that was released in February. The stronger than expected report suggests that business conditions improved nearly +9 points to 24.91.
In earnings news, Barclays (BCS +14.09%) doubled its profit in 2009 which set the stage for a strong rally. The strong results suggest that banks are acting well and are on track for a strong 2010. The healthy economic and earnings data sent the dollar lower and helped offset concern that Greece will default on its ballooning debt. This week, approximately 45 companies in the S&P 500 are slated to release their Q4 results as earnings season winds down. So far, more than 350 companies in the S&P 500 have reported fourth-quarter earnings and about three-quarters of them have topped estimates according to Bloomberg.com.
Looking at the market, the major averages enjoyed robust gains on Tuesday but volume failed exceed the prior day's session which indicates that large institutions are not aggressively buying stocks. As long as February 5th lows are not breached the window remains open for a new follow-through day (FTD) to emerge. A new follow-through day will confirm the current rally attempt and will be produced when one of the major averages rallies at least +1.7% on higher volume than the prior session as a new batch of leaders breakout of sound bases. However, if the February 5, 2010 lows are breached then the day count will be reset and a steeper correction may unfold.
It is also important to see how the major averages react to their respective 50-day moving average (DMA) lines which were support and are now acting as resistance. Until they all close above that important level the technical damage remaining on the charts is a concern. So far, the market’s reaction has been tepid at best to the latest round of economic and earnings data which remains a concern. Remember that the market remains in a correction until a new new follow-through day emerges. Until then, patience is paramount.
Professional Money Management Services - A Winning System - Inquire today!
Our skilled team of portfolio managers knows how to follow the rules of this fact-based investment system. We do not follow opinion or the "conviction list" of some large Wall Street institution which would have us fully invested even during horrific bear markets. Instead, we remain fluid and only buy the best stocks when they are triggering proper technical buy signals. If you are not completely satisfied with the way your portfolio is being managed, Click here to get connected with one of our portfolio managers. *Accounts over $250,000 please. ** Serious inquires only, please.
PICTURED: The Nasdaq Composite Index enjoyed a solid gain on Tuesday, but volume was lighter than the prior session.
|
|
|
 |
Commodity-Linked Groups and Financial Groups Among Day's Best Gainers
Kenneth J. Gruneisen - Passed the CAN SLIM® Master's Exam
Commodity-linked groups were among Tuesday's best gainers as the Oil Services Index ($OSX +1.98%), Integrated Oil Index ($XOI +2.74%), and Gold & Silver Index ($XAU +2.75%) posted solid gains. Financial shares were among other positive influences underpinning the rally effort as the Bank Index ($BKX +2.93%) and Broker/Dealer Index ($XBD +1.64%) posted gains along with the Retail Index ($RLX +1.71%). The Semiconductor Index ($SOX +2.44%) was a leader in the tech sector while the Networking Index ($NWX +1.18%), Internet Index ($IIX +1.20%), and Biotechnology Index ($BTK +1.63%) also rose. Meanwhile, the Healthcare Index ($HMO -0.40%) lagged.
Charts courtesy www.stockcharts.com
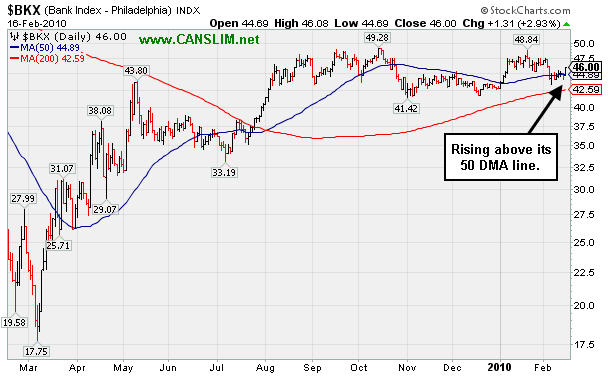
PICTURED: The Bank Index ($BKX +2.93%) fought to close above its 50-day moving average line. Any subsequent breach of recent lows could be an ominous sign.
| Oil Services |
$OSX |
199.77 |
+3.87 |
+1.98% |
+2.49% |
| Healthcare |
$HMO |
1,391.54 |
-5.55 |
-0.40% |
-5.53% |
| Integrated Oil |
$XOI |
1,041.78 |
+27.76 |
+2.74% |
-2.47% |
| Semiconductor |
$SOX |
340.96 |
+8.12 |
+2.44% |
-5.27% |
| Networking |
$NWX |
229.63 |
+2.68 |
+1.18% |
-0.62% |
| Internet |
$IIX |
225.87 |
+2.67 |
+1.20% |
-3.42% |
| Broker/Dealer |
$XBD |
113.43 |
+1.83 |
+1.64% |
-1.41% |
| Retail |
$RLX |
406.33 |
+6.83 |
+1.71% |
-1.17% |
| Gold & Silver |
$XAU |
163.99 |
+4.39 |
+2.75% |
-2.53% |
| Bank |
$BKX |
46.00 |
+1.31 |
+2.93% |
+7.70% |
| Biotech |
$BTK |
1,008.38 |
+16.21 |
+1.63% |
+7.03% |
|
|
|
 |
Medical - Systems/Equipment Firm Identified While Breaking Out
Kenneth J. Gruneisen - Passed the CAN SLIM® Master's Exam
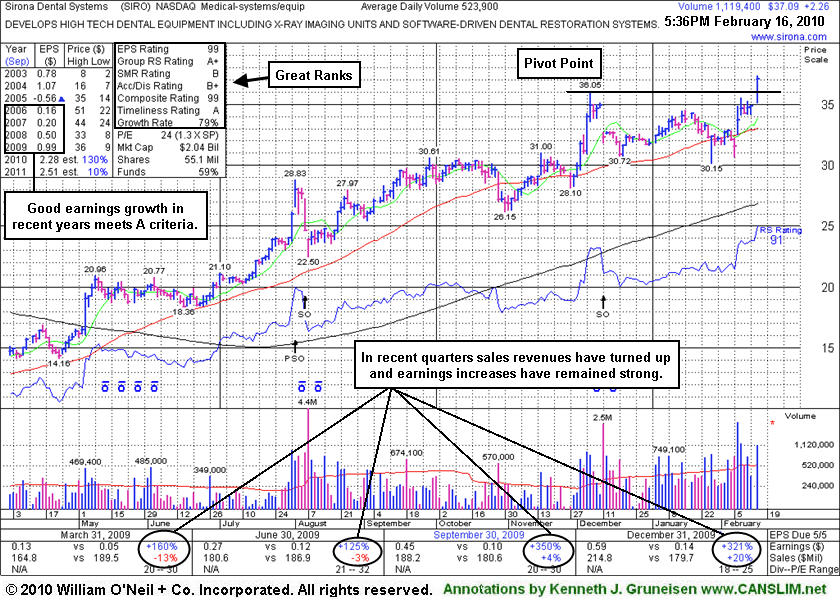
Sirona Dental Systems (SIRO +$2.26 or +6.49% to $37.09) gapped up today and hit a new 52-week high with a considerable gain, triggering a technical buy signal. It was featured in yellow today the mid-day report (read here) while rallying from a 10-week flat base. It has rallied from January 2009 lows near $10. Fundamentally, following 3 negative comparisons, its sales revenues in the Sep and Dec '09 quarters showed a return to growth. Quarterly earnings increases have been very strong along with great annual earnings growth in recent years (good C and A criteria).
This high-ranked Medical - Systems/Equipment firm completed Secondary Offerings on 8/06/09 and 12/11/09. The number of top-rated funds owning its shares rose from 55 in Mar '09 to 75 in Dec '09, which is nice reassurance with respect to the I criteria of the investment system. Gaps up into new high territory are also signs of heavy accumulation. The bigger concern right now remains the M criteria, as 3 out of 4 stocks follow the general market direction. Until a solid follow-through-day occurs, new buying efforts are discouraged under the strict rules of the investment system. In a healthy market environment, there is usually no shortage of ideal buy candidates that come along. The current dearth of leadership remains a concern.
|
|
|
Color Codes Explained :
Y - Better candidates highlighted by our
staff of experts.
G - Previously featured
in past reports as yellow but may no longer be buyable under the
guidelines.
***Last / Change / Volume quote data in this table corresponds with the timestamp on the note***
Symbol/Exchange
Company Name
Industry Group |
Last |
Chg. |
Vol
% DAV |
Date Featured |
Price Featured |
Latest Pivot Point
Featured |
Status |
| Latest Max Buy Price |
ARST
-
|
$26.53
|
+0.57
|
259,331
55% DAV
468,600
|
12/22/2009
(Date
Featured) |
$25.94
(Price
Featured) |
PP = $27.20 |
G |
| MB = $28.56 |
Most Recent Note - 2/16/2010 4:15:58 PM
G - Posted a 5th consecutive gain today with below average volume, rallying further above its 50 DMA line. Important support to watch now is its recent low ($22.58) and prior chart lows in the $22 area. ARST was first featured in yellow at $19.91 in the 9/01/09 mid-day report with an annotated daily graph (read here).
>>> The latest Featured Stock Update with an annotated graph appeared on 2/4/2010. click here.
|
|
C
A
S
I |
News |
Chart |
SEC
View all notes Alert
me of new notes
Company
Profile
|
BIDU
- NASDAQ
Baidu Inc Ads
INTERNET - Internet Information Providers
|
$489.47
|
+1.47
|
1,168,497
60% DAV
1,951,500
|
1/13/2010
(Date
Featured) |
$431.25
(Price
Featured) |
PP = $426.75 |
G |
| MB = $448.09 |
Most Recent Note - 2/16/2010 4:20:00 PM
G - Edged higher today on lighter than average volume, finishing at a new all-time high. After reporting earnings and raising guidance it gapped up on 2/10/10 for a considerable gain with volume more than 3 times average.
>>> The latest Featured Stock Update with an annotated graph appeared on 2/11/2010. click here.
|
|
C
A
S
I |
News |
Chart |
SEC
View all notes Alert
me of new notes
Company
Profile
|
BRLI
- NASDAQ
Bio Reference Labs Inc
HEALTH SERVICES - Medical Laboratories & Researc
|
$39.58
|
+0.15
|
71,486
85% DAV
84,100
|
2/12/2010
(Date
Featured) |
$39.02
(Price
Featured) |
PP = $40.97 |
Y |
| MB = $43.02 |
Most Recent Note - 2/16/2010 4:27:45 PM
Y - Today's 5th consecutive gain leaves it perched less than -4% from its 52-week high. Consolidating for 5-weeks above support at its 50 DMA line, this high-ranked Medical-Dental - Services firm was featured in yellow in the 2/12/10 mid-day report (read here). Very little resistance remains due to overhead supply. Earnings growth and sales revenues growth has accelerated, better than the +25% minimum guideline in recent quarters. Fundamentals are favorable with respect to the C and A criteria.
>>> The latest Featured Stock Update with an annotated graph appeared on 2/12/2010. click here.
|
|
C
A
S
I |
News |
Chart |
SEC
View all notes Alert
me of new notes
Company
Profile
|
CACC
- NASDAQ
Credit Acceptance Corp
FINANCIAL SERVICES - Credit Services
|
$40.37
|
+0.48
|
45,512
73% DAV
62,500
|
9/29/2009
(Date
Featured) |
$33.48
(Price
Featured) |
PP = $37.10 |
G |
| MB = $38.96 |
Most Recent Note - 2/16/2010 4:33:10 PM
G - Posted a gain today on light volume. Consolidating above prior chart highs in the $37 area which may act as support. Concerns were recently raised and sell signals triggered when this high-ranked Financial firm violated its 50 DMA line.
>>> The latest Featured Stock Update with an annotated graph appeared on 2/9/2010. click here.
|
|
C
A
S
I |
News |
Chart |
SEC
View all notes Alert
me of new notes
Company
Profile
|
CRM
- NYSE
Salesforce.com Inc
INTERNET - Internet Software & Services
|
$66.20
|
+1.11
|
1,377,624
73% DAV
1,881,200
|
12/18/2009
(Date
Featured) |
$67.32
(Price
Featured) |
PP = $67.82 |
G |
| MB = $71.21 |
Most Recent Note - 2/16/2010 5:20:19 PM
G - Small gain today on below average volume, still trading below its 50 DMA line. Gains above that short-term average are needed for its outlook to improve. Technically, the recent chart low ($60.30 on 2/05/10) is an important support level to watch.
>>> The latest Featured Stock Update with an annotated graph appeared on 2/10/2010. click here.
|
|
C
A
S
I |
News |
Chart |
SEC
View all notes Alert
me of new notes
Company
Profile
|
GMCR
- NASDAQ
Green Mtn Coffee Roastrs
FOOD & BEVERAGE - Processed & Packaged Goods
|
$82.80
|
-0.91
|
971,367
64% DAV
1,506,300
|
12/28/2009
(Date
Featured) |
$77.49
(Price
Featured) |
PP = $76.50 |
G |
| MB = $80.33 |
Most Recent Note - 2/16/2010 5:23:10 PM
G - Loss today on light volume while quietly consolidating in a tight trading range above its 50 DMA line and within close striking range of its 52-week high. Important initial support level to watch is recent lows in the $78 area.
>>> The latest Featured Stock Update with an annotated graph appeared on 2/2/2010. click here.
|
|
C
A
S
I |
News |
Chart |
SEC
View all notes Alert
me of new notes
Company
Profile
|
ISRG
- NASDAQ
Intuitive Surgical Inc
HEALTH SERVICES - Medical Appliances & Equipment
|
$334.30
|
+2.48
|
375,521
73% DAV
514,700
|
1/22/2010
(Date
Featured) |
$340.40
(Price
Featured) |
PP = $314.00 |
G |
| MB = $329.70 |
Most Recent Note - 2/16/2010 5:24:40 PM
G - Today's small gain with below average volume was its 3rd consecutive gain. Consolidating above its 50 DMA line and prior chart highs in the $314 area that define important technical support. ISRG was featured again most recently in the 1/22/10 mid-day report (read here).
>>> The latest Featured Stock Update with an annotated graph appeared on 2/5/2010. click here.
|
|
C
A
S
I |
News |
Chart |
SEC
View all notes Alert
me of new notes
Company
Profile
|
PEGA
- NASDAQ
Pegasystems Inc
COMPUTER SOFTWARE & SERVICES - Business Software & Services
|
$35.88
|
+0.42
|
112,564
58% DAV
194,000
|
1/4/2010
(Date
Featured) |
$34.00
(Price
Featured) |
PP = $36.19 |
G |
| MB = $38.00 |
Most Recent Note - 2/16/2010 5:31:11 PM
G - Still quietly consolidating in the $35-36 area that was a previously a stubborn resistance level. Its 50 DMA line and prior chart lows near $32 define near-term support to watch.
>>> The latest Featured Stock Update with an annotated graph appeared on 2/8/2010. click here.
|
|
C
A
S
I |
News |
Chart |
SEC
View all notes Alert
me of new notes
Company
Profile
|
SIRO
- NASDAQ
Sirona Dental Systems
HEALTH SERVICES - Medical Instruments & Supplies
|
$37.09
|
+2.26
|
1,153,480
220% DAV
523,900
|
2/16/2010
(Date
Featured) |
$36.43
(Price
Featured) |
PP = $36.15 |
Y |
| MB = $37.96 |
Most Recent Note - 2/16/2010 5:34:24 PM
Y - Gapped up today and hit a new 52-week high with a considerable gain triggering a technical buy signal. Featured in the mid-day report (read here) while rallying from a 10-week flat base. It has rallied from January 2009 lows near $10. Fundamentally, following 3 negative comparisons, its sales revenues in the Sep and Dec '09 quarters showed a return to growth. Quarterly earnings increases have been very strong along with great annual earnings growth in recent years (good C and A criteria). This high-ranked Medical - Systems/Equipment firm completed Secondary Offerings on 8/06/09 and 12/11/09.
>>> The latest Featured Stock Update with an annotated graph appeared on 2/16/2010. click here.
|
|
C
A
S
I |
News |
Chart |
SEC
View all notes Alert
me of new notes
Company
Profile
|
|
|
|
THESE ARE NOT BUY RECOMMENDATIONS!
Comments contained in the body of this report are technical
opinions only. The material herein has been obtained
from sources believed to be reliable and accurate, however,
its accuracy and completeness cannot be guaranteed.
This site is not an investment advisor, hence it does
not endorse or recommend any securities or other investments.
Any recommendation contained in this report may not
be suitable for all investors and it is not to be deemed
an offer or solicitation on our part with respect to
the purchase or sale of any securities. All trademarks,
service marks and trade names appearing in this report
are the property of their respective owners, and are
likewise used for identification purposes only.
This report is a service available
only to active Paid Premium Members.
You may opt-out of receiving report notifications
at any time. Questions or comments may be submitted
by writing to Premium Membership Services 665 S.E. 10 Street, Suite 201 Deerfield Beach, FL 33441-5634 or by calling 1-800-965-8307
or 954-785-1121.
|
|
|


