You are not logged in.
This means you
CAN ONLY VIEW reports that were published prior to Monday, April 14, 2025.
You
MUST UPGRADE YOUR MEMBERSHIP if you want to see any current reports.
AFTER MARKET UPDATE - FRIDAY, FEBRUARY 15TH, 2013
Previous After Market Report Next After Market Report >>>
|
|
|
|
DOW |
+8.37 |
13,981.76 |
+0.06% |
|
Volume |
939,539,800 |
+40% |
|
Volume |
1,808,988,480 |
-3% |
|
NASDAQ |
-6.63 |
3,192.03 |
-0.21% |
|
Advancers |
1,441 |
46% |
|
Advancers |
1,150 |
45% |
|
S&P 500 |
-1.59 |
1,519.79 |
-0.10% |
|
Decliners |
1,541 |
50% |
|
Decliners |
1,266 |
50% |
|
Russell 2000 |
-0.61 |
923.15 |
-0.07% |
|
52 Wk Highs |
301 |
|
|
52 Wk Highs |
190 |
|
|
S&P 600 |
-0.80 |
516.43 |
-0.15% |
|
52 Wk Lows |
28 |
|
|
52 Wk Lows |
17 |
|
|
 |
S&P 500 Index Tallied 7th Consecutive Weekly Gain
Kenneth J. Gruneisen - Passed the CAN SLIM® Master's Exam
For the week, the Dow Jones Industrial Average gave up a mere -0.1% while the Nasdaq Composite Index finished virtually unchanged. Despite Friday’s loss the S&P 500 Index extended its weekly winning streak to seven with a +0.1% gain. The volume totals were reported mixed, higher on the NYSE and lower on the Nasdaq exchange. Breadth was slightly negative as decliners narrowly outnumbered advancing issues on the NYSE and on the Nasdaq exchange. The total number of stocks hitting new 52-week highs easily outnumbered new 52-week lows on the NYSE and on the Nasdaq exchange. There were 95 high-ranked companies from the CANSLIM.net Leaders List making new 52-week highs and appearing on the CANSLIM.net BreakOuts Page, up from the prior session total of 86 stocks. There were gains for 10 of the 13 high-ranked companies currently included on the Featured Stocks Page.

Investors were timid while weighing a G-20 meeting against positive economic data. Global monetary leaders are in currency negotiations amid Japanese policies that continue to weaken the yen. The looming March 1 deadline of automatic U.S. spending cuts has added a cautious tone. On the data front, a gauge of New York area manufacturing unexpectedly climbed to its highest level since May 2012. The University of Michigan consumer confidence index advanced to a three-month high this month, but industrial production fell after the biggest two-month advance since 1984.
Overall, sector action was mixed. Consumer staples were the best performing group as Campbell Soup Co (CPB +1.76%) rose after besting earnings estimates, and The Coca-Cola Co (KO +1.57%) also posted a gain. Health care stocks also were higher, helped by Pfizer Inc's (PFE +0.85%) advance. Losses in energy and materials limited gains with Apache (APA -4.33%), Peabody Energy Corp (BTU -2.44%), and Freeport-McMoRan Copper & Gold Inc (FCX -1.38%) falling. Reports that Wal-Mart Stores Inc (WMT -2.15%) had the worst sales start to a month in seven years prompted some profit taking in the final hour of trading.
In fixed-income, Treasuries extended their weekly losses as the 10-year note lost 2/32 to yield 2.01%.
The latest rally has produced a few action worthy candidates meeting all of the fact-based investment system's criteria. Selectivity and discipline are required, as always. Investors may consider new buying efforts in stocks meeting all key criteria, as the market's (M criteria) confirmed uptrend has been comprised by great leadership (stocks hitting new 52-week highs) in the broader market. Widespread gains helped all of the major averages blast higher, and the benchmark S&P 500 Index is perched at its best level in more than five years and just off its October 2007 all-time high.
Watch for an announcement via email concerning the next WEBCAST. The webcast will also be available via an updated link highlighted at the top of the Premium Member Homepage.
PICTURED: The S&P 500 Index reached tallied its 7th consecutive weekly gain and it is now perched only -3.6% off its October 2007 all-time high.
|
 Kenneth J. Gruneisen started out as a licensed stockbroker in August 1987, a couple of months prior to the historic stock market crash that took the Dow Jones Industrial Average down -22.6% in a single day. He has published daily fact-based fundamental and technical analysis on high-ranked stocks online for two decades. Through FACTBASEDINVESTING.COM, Kenneth provides educational articles, news, market commentary, and other information regarding proven investment systems that work in good times and bad.
Comments contained in the body of this report are technical opinions only and are not necessarily those of Gruneisen Growth Corp. The material herein has been obtained from sources believed to be reliable and accurate, however, its accuracy and completeness cannot be guaranteed. Our firm, employees, and customers may effect transactions, including transactions contrary to any recommendation herein, or have positions in the securities mentioned herein or options with respect thereto. Any recommendation contained in this report may not be suitable for all investors and it is not to be deemed an offer or solicitation on our part with respect to the purchase or sale of any securities. |
|
 |
Gold & Silver Index Dives Toward 2012 Lows
Kenneth J. Gruneisen - Passed the CAN SLIM® Master's Exam
The energy group pulled back and the Oil Services Index ($OSX -1.53%) and Integrated Oil Index ($XOI -1.20%) fell on Friday. Weakness in the Bank Index ($BKX -0.65%) and the Retail Index ($RLX -0.47%) created a drag on the major averages while the Broker/Dealer Index ($XBD +0.28%) edged higher. Tech tech sector saw modest losses for the Semiconductor Index ($SOX -0.60%) and the Networking Index ($NWX -0.42%) while the Internet Index ($IIX -0.07%) and Healthcare Index ($HMO -0.04%) ended nearly unchanged and the Biotechnology Index ($BTK +0.19%) posted a small gain.
Charts courtesy www.stockcharts.com
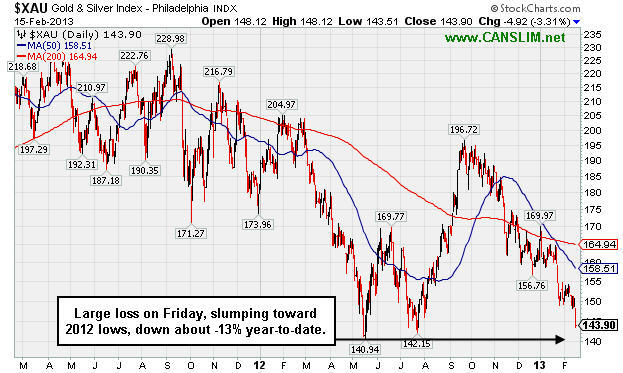
PICTURED: The Gold & Silver Index ($XAU -3.31%) was a standout decliner after comments from the Fed Chairman suggested that the economy was improving, giving the US dollar a boost. The lagging defensive group is down -13% year-to-date while growth areas have fared better.
| Oil Services |
$OSX |
251.96 |
-3.92 |
-1.53% |
+14.44% |
| Healthcare |
$HMO |
2,808.52 |
-1.21 |
-0.04% |
+11.71% |
| Integrated Oil |
$XOI |
1,336.52 |
-16.20 |
-1.20% |
+7.63% |
| Semiconductor |
$SOX |
428.50 |
-2.58 |
-0.60% |
+11.57% |
| Networking |
$NWX |
243.30 |
-1.04 |
-0.42% |
+7.40% |
| Internet |
$IIX |
361.71 |
-0.24 |
-0.07% |
+10.61% |
| Broker/Dealer |
$XBD |
109.22 |
+0.31 |
+0.28% |
+15.78% |
| Retail |
$RLX |
703.49 |
-3.34 |
-0.47% |
+7.72% |
| Gold & Silver |
$XAU |
143.90 |
-4.92 |
-3.31% |
-13.10% |
| Bank |
$BKX |
55.11 |
-0.36 |
-0.65% |
+7.47% |
| Biotech |
$BTK |
1,683.44 |
+3.19 |
+0.19% |
+8.82% |
|
|
|
 |
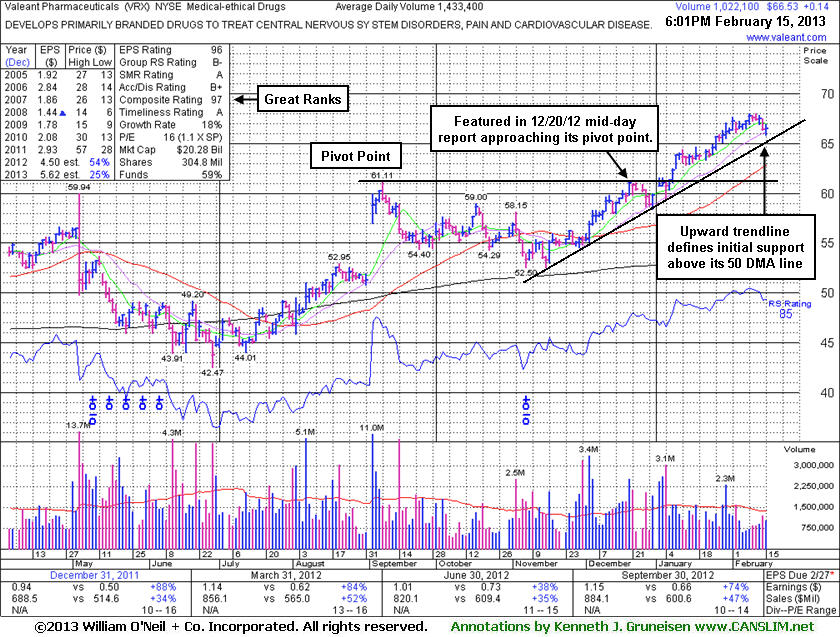
Upward Trendline Defines Initial Support Above 50 Day Moving Average
Kenneth J. Gruneisen - Passed the CAN SLIM® Master's Exam
Valeant Pharmaceuticals (VRX +$0.14 or +0.21% to $66.53) is consolidating -2.1% off its 52-week high, extended from any sound base pattern. An upward trendline connecting its November - December lows defines an initial chart support to watch above its 50-day moving average (DMA) line (now $62.85). It may pause and form another base, or it might pull back and test its 10-week moving average line (similar to the 50 DMA) before any valid secondary buy point might be noted. Meanwhile, and fresh breakouts might be a better choice for disciplined investors looking to accumulate worthy buy candidates.
The Medical - Ethical Drugs group's Relative Strength rating has been improving since it was last shown in this FSU section on 1/28/13 with an annotated graph under the headline "Featured Stock Recently Wedging Higher Without Great Volume Behind Gains", and there have been a couple of strong performers in the group offering reassuring signs concerning the L criteria. Gains with heavier volume also followed its last detailed review, which was a reassuring sign. Then it wedged even further into new high territory without great volume conviction behind gains in recent weeks. It has shown mostly bullish action since first featured in yellow at $60.24 in the 12/20/12 mid-day report.
The number of top-rated funds owning its shares rose from 818 in Mar '12 in to 922 in Dec '12, a reassuring trend concerning the I criteria. Its current Up/Down Volume Ratio of 2.1 is also an unbiased indication that its shares have been under accumulation over the past 50 days. Quarterly earnings increases (C criteria) have been strong and well above the +25% guideline. A downturn in FY '07 and '08 earnings (A criteria) has been followed by a strong earnings rebound in recent years.
|
|
|
Color Codes Explained :
Y - Better candidates highlighted by our
staff of experts.
G - Previously featured
in past reports as yellow but may no longer be buyable under the
guidelines.
***Last / Change / Volume data in this table is the closing quote data***
Symbol/Exchange
Company Name
Industry Group |
PRICE |
CHANGE
(%Change) |
Day High |
Volume
(% DAV)
(% 50 day avg vol) |
52 Wk Hi
% From Hi |
Featured
Date |
Price
Featured |
Pivot Featured |
|
Max Buy |
BGS
-
NYSE
B & G Foods Inc
FOOD andamp; BEVERAGE - Processed andamp; Packaged Goods
|
$30.04
|
-2.20
-6.82% |
$31.00
|
1,811,489
596.28% of 50 DAV
50 DAV is 303,800
|
$33.14
-9.35%
|
2/14/2013
|
$32.82
|
PP = $32.50
|
|
MB = $34.13
|
 Most Recent Note - 2/15/2013 6:34:17 PM
G - Gapped down today and violated its 50 DMA line triggering a technical sell signal, and its color code is changed to green. Finished near the session low and virtually unchanged after highlighted in yellow in the 2/14/13 mid-day report (read here) with pivot point cited based on its 1/28/13 high, however it hit a new 52-week high and churned above average volume while failing to finish strong or trigger a proper technical buy signal. Weakness came after it reported earnings +7% on +16% sales revenues for the Dec '12 quarter, below the +25% minimum guideline (C criteria) in the past 3 quarterly comparisons through Sep '12. It has a good annual earnings (A criteria) history. See the latest FSU analysis for more details and an annotated graph.
>>> The latest Featured Stock Update with an annotated graph appeared on 2/14/2013. Click here.
View all notes |
Alert me of new notes |
CANSLIM.net Company Profile |
SEC |
Zacks Reports |
StockTalk |
News |
Chart |
Request a new note
C
A N
S L
I M


|
CELG
-
NASDAQ
Celgene Corp
DRUGS - Drug Manufacturers - Major
|
$98.77
|
-0.74
-0.74% |
$99.70
|
2,636,183
70.67% of 50 DAV
50 DAV is 3,730,300
|
$102.29
-3.44%
|
12/11/2012
|
$82.24
|
PP = $81.34
|
|
MB = $85.41
|
Most Recent Note - 2/14/2013 7:02:13 PM
G - Volume totals have been cooling in recent weeks while it has stubbornly hovered near its all-time high, holding its ground. That price/volume action is an encouraging indication that few investors have been headed for the exit. Its 50 DMA line (now $89.92) defines important support to watch on pullbacks.
>>> The latest Featured Stock Update with an annotated graph appeared on 2/4/2013. Click here.
View all notes |
Alert me of new notes |
CANSLIM.net Company Profile |
SEC |
Zacks Reports |
StockTalk |
News |
Chart |
Request a new note
C
A N
S L
I M
|
CFNL
-
NASDAQ
Cardinal Financial Corp
BANKING - Regional - Southeast Banks
|
$16.54
|
+0.09
0.55% |
$16.77
|
149,866
77.65% of 50 DAV
50 DAV is 193,000
|
$16.90
-2.13%
|
12/3/2012
|
$15.20
|
PP = $16.31
|
|
MB = $17.13
|
Most Recent Note - 2/12/2013 1:43:34 PM
Y - Rallying from its 50 DMA line with volume running at an above average pace behind today's considerable gain while trading within close striking distance of its best-ever close. Subsequent losses leading to a damaging 50 DMA line violation or a slump below the recent low ($15.74 on 1/18/13) would raise concerns and trigger technical sell signals.
>>> The latest Featured Stock Update with an annotated graph appeared on 1/31/2013. Click here.
View all notes |
Alert me of new notes |
CANSLIM.net Company Profile |
SEC |
Zacks Reports |
StockTalk |
News |
Chart |
Request a new note
C
A N
S L
I M
|
CMCSA
-
NASDAQ
Comcast Corp Cl A
MEDIA - CATV Systems
|
$41.24
|
+0.90
2.23% |
$41.26
|
19,952,912
149.02% of 50 DAV
50 DAV is 13,389,800
|
$42.00
-1.81%
|
12/3/2012
|
$37.08
|
PP = $38.06
|
|
MB = $39.96
|
Most Recent Note - 2/15/2013 12:16:10 PM
G - Trading up today near its 52-week high hit during a streak of 4 consecutive gains backed by above average volume. Reported earnings +11% on +6% sales revenues for the Dec '12 quarter, below the +25% minimum earnings guideline (C criteria), raising fundamental concerns, yet bullish action has continued.
>>> The latest Featured Stock Update with an annotated graph appeared on 1/29/2013. Click here.
View all notes |
Alert me of new notes |
CANSLIM.net Company Profile |
SEC |
Zacks Reports |
StockTalk |
News |
Chart |
Request a new note
C
A N
S L
I M
|
KORS
-
NYSE
Michael Kors Hldgs Ltd
RETAIL - Apparel Stores
|
$63.27
|
+1.60
2.59% |
$64.04
|
6,861,379
161.61% of 50 DAV
50 DAV is 4,245,700
|
$64.80
-2.36%
|
1/23/2013
|
$54.98
|
PP = $58.72
|
|
MB = $61.66
|
Most Recent Note - 2/15/2013 6:39:18 PM
G - Tallied additional volume-driven gains and finished the week strong. On Tuesday it gapped up after reporting earnings +129% on +70% sales revenues for the Dec '12 quarter versus the year ago period. Its considerable "breakaway gap" for a new high with heavy volume while blasting above the pivot point triggered a convincing technical buy signal. Color code is changed to green after getting more extended beyond its "max buy" level.
>>> The latest Featured Stock Update with an annotated graph appeared on 2/7/2013. Click here.
View all notes |
Alert me of new notes |
CANSLIM.net Company Profile |
SEC |
Zacks Reports |
StockTalk |
News |
Chart |
Request a new note
C
A N
S L
I M
|
Symbol/Exchange
Company Name
Industry Group |
PRICE |
CHANGE
(%Change) |
Day High |
Volume
(% DAV)
(% 50 day avg vol) |
52 Wk Hi
% From Hi |
Featured
Date |
Price
Featured |
Pivot Featured |
|
Max Buy |
LNKD
-
NYSE
Linkedin Corp Class A
INTERNET - Internet Information Providers
|
$162.66
|
+1.32
0.82% |
$163.00
|
2,464,370
119.79% of 50 DAV
50 DAV is 2,057,200
|
$161.77
0.55%
|
2/8/2013
|
$147.04
|
PP = $127.55
|
|
MB = $133.93
|
Most Recent Note - 2/14/2013 6:53:28 PM
G - Finished near the session high as it tallied another gain today with +34% above average volume while getting even more extended. Disciplined investors may watch for secondary buy points or additional bases to possibly form and be noted in the weeks ahead.
>>> The latest Featured Stock Update with an annotated graph appeared on 2/8/2013. Click here.
View all notes |
Alert me of new notes |
CANSLIM.net Company Profile |
SEC |
Zacks Reports |
StockTalk |
News |
Chart |
Request a new note
C
A N
S L
I M
|
MIDD
-
NASDAQ
Middleby Corp
MANUFACTURING - Diversified Machinery
|
$148.08
|
+1.53
1.04% |
$151.24
|
119,111
127.66% of 50 DAV
50 DAV is 93,300
|
$151.49
-2.25%
|
10/8/2012
|
$118.46
|
PP = $122.67
|
|
MB = $128.80
|
Most Recent Note - 2/15/2013 12:33:30 PM
G - Hovering near its all-time high still, but enduring distributional pressure this week with above average volume behind 2 recent losses. Fundamental concerns were recently noted and prior reports cautioned members that it is extended from any sound base. Prior highs and its 50 DMA line define important near-term chart support in the $134-135 area.
>>> The latest Featured Stock Update with an annotated graph appeared on 1/30/2013. Click here.
View all notes |
Alert me of new notes |
CANSLIM.net Company Profile |
SEC |
Zacks Reports |
StockTalk |
News |
Chart |
Request a new note
C
A N
S L
I M
|
N
-
NYSE
Netsuite Inc
DIVERSIFIED SERVICES - Business/Management Services
|
$68.36
|
+1.01
1.50% |
$69.18
|
603,188
174.79% of 50 DAV
50 DAV is 345,100
|
$75.75
-9.76%
|
12/12/2012
|
$64.75
|
PP = $67.12
|
|
MB = $70.48
|
Most Recent Note - 2/12/2013 1:50:54 PM
G - Trading near its 50 DMA line ($66.17 now) today, where any more damaging losses may trigger a technical sell signal. Concerns were raised following a worrisome "negative reversal" on 2/01/13 after initially gapping up for a new 52-week high. Recent notes have repeatedly cautioned - "Reported earnings +20% on +33% sales revenues for the Dec '12 quarter, below the +25% minimum earnings guideline (C criteria) raising fundamental concerns."
>>> The latest Featured Stock Update with an annotated graph appeared on 2/5/2013. Click here.
View all notes |
Alert me of new notes |
CANSLIM.net Company Profile |
SEC |
Zacks Reports |
StockTalk |
News |
Chart |
Request a new note
C
A N
S L
I M
|
NP
-
NYSE
Neenah Paper Inc
CONSUMER NON-DURABLES - Paper and Paper Products
|
$29.59
|
+0.47
1.61% |
$29.67
|
77,689
98.34% of 50 DAV
50 DAV is 79,000
|
$32.57
-9.15%
|
1/25/2013
|
$31.80
|
PP = $31.76
|
|
MB = $33.35
|
Most Recent Note - 2/13/2013 6:01:45 PM
G - Its Relative Strength rating has slumped to a 66, well below the 80+ minimum guideline for buy candidates under the fact-based investment system, and its color code was changed to green. See the latest FSU analysis for more details and a new annotated graph.
>>> The latest Featured Stock Update with an annotated graph appeared on 2/13/2013. Click here.
View all notes |
Alert me of new notes |
CANSLIM.net Company Profile |
SEC |
Zacks Reports |
StockTalk |
News |
Chart |
Request a new note
C
A N
S L
I M
|
NSR
-
NYSE
Neustar Inc
TELECOMMUNICATIONS - Diversified Communication Serv
|
$46.42
|
+0.17
0.37% |
$46.69
|
365,503
83.30% of 50 DAV
50 DAV is 438,800
|
$47.24
-1.74%
|
12/11/2012
|
$41.85
|
PP = $41.41
|
|
MB = $43.48
|
Most Recent Note - 2/12/2013 1:55:41 PM
G - Hovering near its 52-week high, holding its ground stubbornly after getting extended from its prior base. Its 50 DMA line (now $43.11) defines near-term support above its prior base.
>>> The latest Featured Stock Update with an annotated graph appeared on 2/1/2013. Click here.
View all notes |
Alert me of new notes |
CANSLIM.net Company Profile |
SEC |
Zacks Reports |
StockTalk |
News |
Chart |
Request a new note
C
A N
S L
I M
|
Symbol/Exchange
Company Name
Industry Group |
PRICE |
CHANGE
(%Change) |
Day High |
Volume
(% DAV)
(% 50 day avg vol) |
52 Wk Hi
% From Hi |
Featured
Date |
Price
Featured |
Pivot Featured |
|
Max Buy |
RNF
-
NYSE
Rentech Nitrogen Ptnr Lp
CHEMICALS - Agricultural Chemicals
|
$42.55
|
-1.41
-3.21% |
$44.30
|
602,750
164.82% of 50 DAV
50 DAV is 365,700
|
$49.18
-13.48%
|
11/1/2012
|
$39.11
|
PP = $40.15
|
|
MB = $42.16
|
Most Recent Note - 2/15/2013 6:36:09 PM
G - Slumped back near its 50 DMA line today with above average volume behind its loss. Showed a prompt and encouraging sign of support near that important short-term average and prior highs in the $41 area this week. Subsequent damaging losses below the prior session's low ($40.95) would raise more serious concerns and trigger additional worrisome technical sell signals.
>>> The latest Featured Stock Update with an annotated graph appeared on 2/12/2013. Click here.
View all notes |
Alert me of new notes |
CANSLIM.net Company Profile |
SEC |
Zacks Reports |
StockTalk |
News |
Chart |
Request a new note
C
A N
S L
I M
|
SFUN
-
NYSE
Soufun Hldgs Ltd Ads A
INTERNET - Internet Information Providers
|
$28.02
|
+0.41
1.48% |
$28.22
|
284,783
94.86% of 50 DAV
50 DAV is 300,200
|
$29.16
-3.91%
|
2/11/2013
|
$27.46
|
PP = $29.26
|
|
MB = $30.72
|
Most Recent Note - 2/14/2013 7:08:20 PM
Y - It has been inching higher with light volume, not yet rallying beyond the pivot point cited based on its 1/08/13 high plus 10 cents. Disciplined investors may watch for subsequent volume-driven gains to confirm a proper technical buy signal.
>>> The latest Featured Stock Update with an annotated graph appeared on 2/11/2013. Click here.
View all notes |
Alert me of new notes |
CANSLIM.net Company Profile |
SEC |
Zacks Reports |
StockTalk |
News |
Chart |
Request a new note
C
A N
S L
I M
|
VRX
-
NYSE
Valeant Pharmaceuticals
DRUGS - Drug Manufacturers - Other
|
$66.53
|
+0.14
0.21% |
$66.92
|
1,022,157
71.31% of 50 DAV
50 DAV is 1,433,400
|
$67.98
-2.13%
|
12/20/2012
|
$60.24
|
PP = $61.21
|
|
MB = $64.27
|
Most Recent Note - 2/15/2013 6:29:48 PM
G - Consolidating near its 52-week high. An upward trendline connecting its November - December lows defines initial chart support to watch above its 50 DMA line. See the latest FSU analysis for more details and a new annotated graph.
>>> The latest Featured Stock Update with an annotated graph appeared on 2/15/2013. Click here.
View all notes |
Alert me of new notes |
CANSLIM.net Company Profile |
SEC |
Zacks Reports |
StockTalk |
News |
Chart |
Request a new note
C
A N
S L
I M
|
|
|
|
THESE ARE NOT BUY RECOMMENDATIONS!
Comments contained in the body of this report are technical
opinions only. The material herein has been obtained
from sources believed to be reliable and accurate, however,
its accuracy and completeness cannot be guaranteed.
This site is not an investment advisor, hence it does
not endorse or recommend any securities or other investments.
Any recommendation contained in this report may not
be suitable for all investors and it is not to be deemed
an offer or solicitation on our part with respect to
the purchase or sale of any securities. All trademarks,
service marks and trade names appearing in this report
are the property of their respective owners, and are
likewise used for identification purposes only.
This report is a service available
only to active Paid Premium Members.
You may opt-out of receiving report notifications
at any time. Questions or comments may be submitted
by writing to Premium Membership Services 665 S.E. 10 Street, Suite 201 Deerfield Beach, FL 33441-5634 or by calling 1-800-965-8307
or 954-785-1121.
|
|
|

