***Last / Change / Volume data in this table is the closing quote data***
Symbol/Exchange
Company Name
Industry Group |
PRICE |
CHANGE
(%Change) |
Day High |
Volume
(% DAV)
(% 50 day avg vol) |
52 Wk Hi
% From Hi |
Featured
Date |
Price
Featured |
Pivot Featured |
|
Max Buy |
ADS
-
NYSE
Alliance Data Sys Corp
COMPUTER SOFTWARE and SERVICES - Information and Delivery Service
|
$120.62
|
+0.39
0.32% |
$122.62
|
769,444
106.93% of 50 DAV
50 DAV is 719,600
|
$120.42
0.17%
|
1/17/2012
|
$108.24
|
PP = $107.43
|
|
MB = $112.80
|
Most Recent Note - 2/9/2012 4:15:12 PM
G - Inched further above its "max buy" level today with another new volume-driven gain for a new 52-week high. Its 50 DMA line defines support to watch on pullbacks while it is now extended from its latest base.
>>> The latest Featured Stock Update with an annotated graph appeared on 1/17/2012. Click here.
View all notes |
Alert me of new notes |
CANSLIM.net Company Profile |
SEC |
Zacks Reports |
StockTalk |
News |
Chart |
Request a new note
C
A N
S L
I M


|
ALXN
-
NASDAQ
Alexion Pharmaceuticals
DRUGS - Drug Manufacturers - Other
|
$83.01
|
-0.39
-0.46% |
$84.00
|
957,557
78.09% of 50 DAV
50 DAV is 1,226,200
|
$85.48
-2.90%
|
11/30/2011
|
$68.66
|
PP = $70.52
|
|
MB = $74.05
|
Most Recent Note - 2/10/2012 11:56:26 AM
G - Reported better than expected earnings +58% on +46% sales for the latest quarter ended December 31, 2011 versus the year ago period. Small gap up today following a considerable volume-driven gain for a new all-time high, getting more extended from its prior base. Prior resistance in the $70 area defines chart support coinciding with its 50 DMA line.
>>> The latest Featured Stock Update with an annotated graph appeared on 1/13/2012. Click here.
View all notes |
Alert me of new notes |
CANSLIM.net Company Profile |
SEC |
Zacks Reports |
StockTalk |
News |
Chart |
Request a new note
C
A N
S L
I M
|
BODY
-
NASDAQ
Body Central Corp
RETAIL - Catalog andamp; Mail Order Houses
|
$28.14
|
-0.01
-0.04% |
$28.67
|
205,962
128.57% of 50 DAV
50 DAV is 160,200
|
$28.17
-0.11%
|
1/27/2012
|
$26.69
|
PP = $25.46
|
|
MB = $26.73
|
Most Recent Note - 2/14/2012 12:10:04 PM
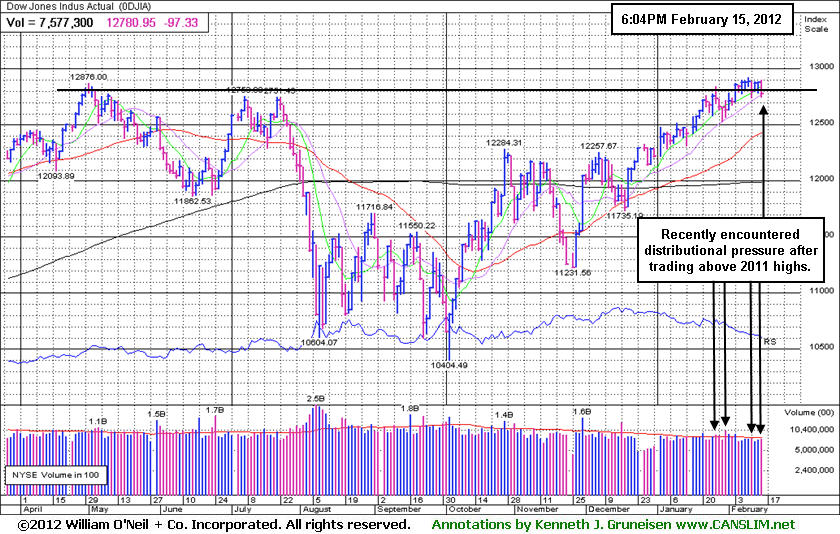
G - Gapped up today and rallied to a new all-time high above its "max buy" level with above average volume. Color code is changed to green after getting extended from its prior base, and the prior highs recently acted as support after encountering some distributional pressure.
>>> The latest Featured Stock Update with an annotated graph appeared on 1/27/2012. Click here.
View all notes |
Alert me of new notes |
CANSLIM.net Company Profile |
SEC |
Zacks Reports |
StockTalk |
News |
Chart |
Request a new note
C
A N
S L
I M
|
CATM
-
NASDAQ
Cardtronics Inc
DIVERSIFIED SERVICES - Business/Management Services
|
$26.63
|
+0.07
0.26% |
$26.74
|
369,621
89.19% of 50 DAV
50 DAV is 414,400
|
$28.74
-7.34%
|
12/23/2011
|
$28.64
|
PP = $28.56
|
|
MB = $29.99
|
Most Recent Note - 2/13/2012 6:13:43 PM
G - Consolidating near its 50 DMA line today, it found prompt support after it tested its 200 DMA line recently. Reported earnings +38% on +29% sales revenues for the quarter ended December 31, 2011 versus the year ago period.
>>> The latest Featured Stock Update with an annotated graph appeared on 1/30/2012. Click here.
View all notes |
Alert me of new notes |
CANSLIM.net Company Profile |
SEC |
Zacks Reports |
StockTalk |
News |
Chart |
Request a new note
C
A N
S L
I M
|
CDNS
-
NASDAQ
Cadence Design Systems
COMPUTER SOFTWARE and SERVICES - Technical and System Software
|
$11.94
|
+0.12
0.97% |
$11.94
|
4,234,277
147.24% of 50 DAV
50 DAV is 2,875,800
|
$12.00
-0.50%
|
2/3/2012
|
$11.66
|
PP = $11.15
|
|
MB = $11.71
|
Most Recent Note - 2/13/2012 5:42:43 PM
G - Down today on lighter than average volume, finishing near the session low and near its "max buy" level. No resistance remains due to overhead supply following strong technical action.
>>> The latest Featured Stock Update with an annotated graph appeared on 2/3/2012. Click here.
View all notes |
Alert me of new notes |
CANSLIM.net Company Profile |
SEC |
Zacks Reports |
StockTalk |
News |
Chart |
Request a new note
C
A N
S L
I M
|
Symbol/Exchange
Company Name
Industry Group |
PRICE |
CHANGE
(%Change) |
Day High |
Volume
(% DAV)
(% 50 day avg vol) |
52 Wk Hi
% From Hi |
Featured
Date |
Price
Featured |
Pivot Featured |
|
Max Buy |
CELG
-
NASDAQ
Celgene Corp
DRUGS - Drug Manufacturers - Major
|
$74.60
|
+0.46
0.61% |
$76.09
|
5,340,587
156.55% of 50 DAV
50 DAV is 3,411,500
|
$75.11
-0.68%
|
2/2/2012
|
$74.16
|
PP = $75.21
|
|
MB = $78.97
|
Most Recent Note - 2/14/2012 6:53:11 PM
Y - Finished the session at its high and just 2 cents off its best-ever close with a gain on average volume. Held its ground in a tight range since the advanced "3-weeks tight" base pattern was previously noted. Still perched within close striking distance of its all-time high ($77.39 in Aug '08). Its 50 DMA line defines initial support above its prior highs in the $68 area.
>>> The latest Featured Stock Update with an annotated graph appeared on 2/2/2012. Click here.
View all notes |
Alert me of new notes |
CANSLIM.net Company Profile |
SEC |
Zacks Reports |
StockTalk |
News |
Chart |
Request a new note
C
A N
S L
I M
|
FEIC
-
NASDAQ
F E I Co
ELECTRONICS - Diversified Electronics
|
$44.49
|
-1.04
-2.28% |
$45.98
|
189,570
69.98% of 50 DAV
50 DAV is 270,900
|
$48.31
-7.91%
|
12/7/2011
|
$41.41
|
PP = $42.35
|
|
MB = $44.47
|
 Most Recent Note - 2/15/2012 3:09:47 PM
G - Slumping toward its 50 DMA line and prior highs in the $43 area that now coincide and define important chart support. Reported earnings +21% on +14% sales revenues for the latest quarter ended December 31, 2011 versus the year ago period (below the +25% minimum guideline for earnings growth).
>>> The latest Featured Stock Update with an annotated graph appeared on 1/25/2012. Click here.
View all notes |
Alert me of new notes |
CANSLIM.net Company Profile |
SEC |
Zacks Reports |
StockTalk |
News |
Chart |
Request a new note
C
A N
S L
I M
|
GNC
-
NYSE
G N C Holdings Inc
RETAIL - Drug Stores
|
$30.00
|
-0.03
-0.10% |
$30.11
|
1,718,616
184.50% of 50 DAV
50 DAV is 931,500
|
$30.32
-1.06%
|
1/19/2012
|
$28.99
|
PP = $29.60
|
|
MB = $31.08
|
Most Recent Note - 2/14/2012 6:42:33 PM
Y - It quietly finished the session at a best-ever close. Volume behind recent gains was noted as below the minimum guideline to trigger a technical buy signal. Due to report its fourth quarter 2011 financial results before the open on Thursday, February 16. Volume and volatility often increase near earnings news.
>>> The latest Featured Stock Update with an annotated graph appeared on 1/19/2012. Click here.
View all notes |
Alert me of new notes |
CANSLIM.net Company Profile |
SEC |
Zacks Reports |
StockTalk |
News |
Chart |
Request a new note
C
A N
S L
I M
|
GOLD
-
NASDAQ
Randgold Resources Adr
METALS and MINING - Gold
|
$111.36
|
-0.91
-0.81% |
$113.18
|
352,548
68.43% of 50 DAV
50 DAV is 515,200
|
$120.73
-7.76%
|
2/7/2012
|
$116.21
|
PP = $120.83
|
|
MB = $126.87
|
Most Recent Note - 2/14/2012 6:45:23 PM
Y - Recent losses on quiet volume have formed a downward sloping "handle" on the previously noted base pattern. Featured in the 2/07/12 mid-day report in yellow with pivot point based on its 52-week high plus 10 cents after a 13-week cup shaped base. This UK-headquartered firm in the Mining - Gold/Silver/Gems group showed very strong sales revenues and earnings increases in the Mar, Jun, Sep, and Dec '11 quarterly comparisons much greater than the +25% minimum guideline. Subsequent volume-driven gains into new high territory may trigger a technical buy signal.
>>> The latest Featured Stock Update with an annotated graph appeared on 2/8/2012. Click here.
View all notes |
Alert me of new notes |
CANSLIM.net Company Profile |
SEC |
Zacks Reports |
StockTalk |
News |
Chart |
Request a new note
C
A N
S L
I M
|
HMSY
-
NASDAQ
H M S Holdings Corp
COMPUTER SOFTWARE and SERVICES - Healthcare Information Service
|
$33.54
|
-0.45
-1.32% |
$34.41
|
684,825
79.70% of 50 DAV
50 DAV is 859,300
|
$34.98
-4.11%
|
10/27/2011
|
$26.44
|
PP = $28.37
|
|
MB = $29.79
|
Most Recent Note - 2/14/2012 6:47:35 PM
G - Touched a new all-time high but reversed into the red and ended with a small loss on higher (but still below average) volume. Volume totals have been cooling in recent weeks while hovering near its all-time high. No resistance remains to hinder its progress, but it is extended from its prior base. Its 50 DMA line and prior highs near $32 define near-term chart support to watch.
>>> The latest Featured Stock Update with an annotated graph appeared on 2/9/2012. Click here.
View all notes |
Alert me of new notes |
CANSLIM.net Company Profile |
SEC |
Zacks Reports |
StockTalk |
News |
Chart |
Request a new note
C
A N
S L
I M
|
Symbol/Exchange
Company Name
Industry Group |
PRICE |
CHANGE
(%Change) |
Day High |
Volume
(% DAV)
(% 50 day avg vol) |
52 Wk Hi
% From Hi |
Featured
Date |
Price
Featured |
Pivot Featured |
|
Max Buy |
ISRG
-
NASDAQ
Intuitive Surgical Inc
HEALTH SERVICES - Medical Appliances and Equipment
|
$505.23
|
-5.17
-1.01% |
$515.61
|
407,291
107.66% of 50 DAV
50 DAV is 378,300
|
$514.55
-1.81%
|
12/20/2011
|
$442.43
|
PP = $449.16
|
|
MB = $471.62
|
Most Recent Note - 2/13/2012 5:51:47 PM
G - Up today with above average volume for another new all-time high, getting more extended from prior highs in the $475 area that may now act as support. Reported earnings +24% on +28% sales revenues for the quarter ended December 31, 2011 versus the year ago period.
>>> The latest Featured Stock Update with an annotated graph appeared on 1/18/2012. Click here.
View all notes |
Alert me of new notes |
CANSLIM.net Company Profile |
SEC |
Zacks Reports |
StockTalk |
News |
Chart |
Request a new note
C
A N
S L
I M
|
LULU
-
NASDAQ
Lululemon Athletica
MANUFACTURING - Textile Manufacturing
|
$64.87
|
-0.47
-0.72% |
$67.22
|
2,450,146
79.61% of 50 DAV
50 DAV is 3,077,600
|
$66.00
-1.71%
|
1/10/2012
|
$60.97
|
PP = $59.46
|
|
MB = $62.43
|
Most Recent Note - 2/9/2012 4:24:25 PM
G - Finished at an all-time high as it inched higher with another gain today backed by below average volume. No resistance remains due to overhead supply, but it is extended from the base pattern previously noted.
>>> The latest Featured Stock Update with an annotated graph appeared on 1/10/2012. Click here.
View all notes |
Alert me of new notes |
CANSLIM.net Company Profile |
SEC |
Zacks Reports |
StockTalk |
News |
Chart |
Request a new note
C
A N
S L
I M
|
MA
-
NYSE
Mastercard Inc Cl A
DIVERSIFIED SERVICES - Business/Management Services
|
$392.96
|
-2.59
-0.65% |
$399.73
|
730,467
67.10% of 50 DAV
50 DAV is 1,088,700
|
$401.79
-2.20%
|
2/2/2012
|
$379.05
|
PP = $381.32
|
|
MB = $400.39
|
Most Recent Note - 2/13/2012 6:23:11 PM
Y - Quietly holding its ground perched at its all-time high after a streak of consecutive gains. Prior highs in the mid-$380 area define initial chart support to watch.
>>> The latest Featured Stock Update with an annotated graph appeared on 1/3/2012. Click here.
View all notes |
Alert me of new notes |
CANSLIM.net Company Profile |
SEC |
Zacks Reports |
StockTalk |
News |
Chart |
Request a new note
C
A N
S L
I M
|
MELI
-
NASDAQ
Mercadolibre Inc
INTERNET - Internet Software and; Services
|
$99.24
|
+4.01
4.21% |
$100.43
|
1,102,955
209.29% of 50 DAV
50 DAV is 527,000
|
$98.75
0.50%
|
2/6/2012
|
$97.09
|
PP = $95.58
|
|
MB = $100.36
|
Most Recent Note - 2/15/2012 1:40:10 PM
Y - It touched a new 52-week high today with above average volume behind its gain. A strong finish above prior highs would be a solid confirming gain after its earlier technical breakout.
>>> The latest Featured Stock Update with an annotated graph appeared on 2/6/2012. Click here.
View all notes |
Alert me of new notes |
CANSLIM.net Company Profile |
SEC |
Zacks Reports |
StockTalk |
News |
Chart |
Request a new note
C
A N
S L
I M
|
MKTX
-
NASDAQ
Marketaxess Holdings Inc
FINANCIAL SERVICES - Investment Brokerage - Nationa
|
$31.86
|
-0.41
-1.27% |
$32.84
|
83,953
45.18% of 50 DAV
50 DAV is 185,800
|
$35.42
-10.05%
|
10/28/2011
|
$29.79
|
PP = $31.05
|
|
MB = $32.60
|
Most Recent Note - 2/13/2012 6:00:06 PM
G - Gapped up today for a gain with lighter than average volume. Prior highs in the $31-32 area recently acted as chart support when consolidating after volume-driven gains into new high territory.
>>> The latest Featured Stock Update with an annotated graph appeared on 1/24/2012. Click here.
View all notes |
Alert me of new notes |
CANSLIM.net Company Profile |
SEC |
Zacks Reports |
StockTalk |
News |
Chart |
Request a new note
C
A N
S L
I M
|
Symbol/Exchange
Company Name
Industry Group |
PRICE |
CHANGE
(%Change) |
Day High |
Volume
(% DAV)
(% 50 day avg vol) |
52 Wk Hi
% From Hi |
Featured
Date |
Price
Featured |
Pivot Featured |
|
Max Buy |
OSIS
-
NASDAQ
O S I Systems Inc
ELECTRONICS - Semiconductor Equipment and Mate
|
$52.46
|
-1.02
-1.91% |
$54.51
|
127,021
132.31% of 50 DAV
50 DAV is 96,000
|
$57.51
-8.78%
|
11/1/2011
|
$42.07
|
PP = $45.57
|
|
MB = $47.85
|
Most Recent Note - 2/15/2012 3:12:28 PM
G - Down today with slightly higher volume indicative of distributional pressure, slumping toward its 50 DMA line which defines important support to watch. Reported earnings +20% on +11% sales revenues for the Dec '11 quarter, which raised concerns as earnings growth was below the +25% minimum earnings guideline.
>>> The latest Featured Stock Update with an annotated graph appeared on 1/31/2012. Click here.
View all notes |
Alert me of new notes |
CANSLIM.net Company Profile |
SEC |
Zacks Reports |
StockTalk |
News |
Chart |
Request a new note
C
A N
S L
I M
|
RAX
-
NYSE
Rackspace Hosting Inc
INTERNET - Internet Software and; Services
|
$54.12
|
-1.33
-2.40% |
$55.61
|
4,204,096
224.11% of 50 DAV
50 DAV is 1,875,900
|
$56.94
-4.95%
|
2/2/2012
|
$46.69
|
PP = $45.55
|
|
MB = $47.83
|
Most Recent Note - 2/15/2012 12:55:28 PM
G - Reported earnings +80% on +32% sales revenues for the quarter ended December 31, 2011 versus the year ago period. Holding its ground today following a considerable gap up gain with very heavy volume on the prior session, spiking to a new all-time high and getting more extended from the previously noted orderly flat base.
>>> The latest Featured Stock Update with an annotated graph appeared on 1/5/2012. Click here.
View all notes |
Alert me of new notes |
CANSLIM.net Company Profile |
SEC |
Zacks Reports |
StockTalk |
News |
Chart |
Request a new note
C
A N
S L
I M
|
RRTS
-
NYSE
Roadrunner Trans Systems
TRANSPORTATION - Air Delivery and Freight Service
|
$18.25
|
+0.58
3.28% |
$18.44
|
410,316
329.84% of 50 DAV
50 DAV is 124,400
|
$17.95
1.67%
|
2/10/2012
|
$17.40
|
PP = $17.50
|
|
MB = $18.38
|
Most Recent Note - 2/15/2012 1:00:35 PM
Y - Gapped up today and it has above average volume behind its gain while surging to a new 52-week high near its "max buy" level. Prior highs in the $17 area define initial support to watch on pullbacks. See the latest FSU analysis for more details and a new annotated graph.
>>> The latest Featured Stock Update with an annotated graph appeared on 2/13/2012. Click here.
View all notes |
Alert me of new notes |
CANSLIM.net Company Profile |
SEC |
Zacks Reports |
StockTalk |
News |
Chart |
Request a new note
C
A N
S L
I M
|
SWI
-
NYSE
Solarwinds Inc
COMPUTER SOFTWARE and SERVICES - Application Software
|
$36.95
|
-1.11
-2.92% |
$38.52
|
1,494,222
127.80% of 50 DAV
50 DAV is 1,169,200
|
$38.59
-4.25%
|
1/26/2012
|
$32.36
|
PP = $33.78
|
|
MB = $35.47
|
Most Recent Note - 2/15/2012 3:15:16 PM
G - Pulling back from its all-time high with a loss on slightly higher volume today indicative of mild distributional pressure. It is extended from its latest base. Reported earnings +21% on +34% sales revenues for the quarter ended December 31, 2011 versus the year ago period. Earnings below the +25% guideline raise fundamental concerns.
>>> The latest Featured Stock Update with an annotated graph appeared on 1/26/2012. Click here.
View all notes |
Alert me of new notes |
CANSLIM.net Company Profile |
SEC |
Zacks Reports |
StockTalk |
News |
Chart |
Request a new note
C
A N
S L
I M
|
SXCI
-
NASDAQ
S X C Health Solutions
COMPUTER SOFTWARE and SERVICES - Healthcare Information Service
|
$61.43
|
-0.48
-0.78% |
$62.45
|
270,162
80.48% of 50 DAV
50 DAV is 335,700
|
$66.40
-7.48%
|
1/10/2012
|
$62.05
|
PP = $60.10
|
|
MB = $63.11
|
Most Recent Note - 2/14/2012 6:31:17 PM
G - Small gain today with above average volume. Prior highs in the $60 area and its 50 DMA line define chart support to watch. Due to release its fiscal 2011 fourth quarter and year-end financial results before the open on Thursday, February 23, 2012.
>>> The latest Featured Stock Update with an annotated graph appeared on 1/20/2012. Click here.
View all notes |
Alert me of new notes |
CANSLIM.net Company Profile |
SEC |
Zacks Reports |
StockTalk |
News |
Chart |
Request a new note
C
A N
S L
I M
|
Symbol/Exchange
Company Name
Industry Group |
PRICE |
CHANGE
(%Change) |
Day High |
Volume
(% DAV)
(% 50 day avg vol) |
52 Wk Hi
% From Hi |
Featured
Date |
Price
Featured |
Pivot Featured |
|
Max Buy |
TDG
-
NYSE
Transdigm Group Inc
AEROSPACE/DEFENSE - Aerospace/Defense Products and; Services
|
$115.00
|
-1.47
-1.26% |
$117.52
|
541,003
165.09% of 50 DAV
50 DAV is 327,700
|
$118.83
-3.22%
|
1/10/2012
|
$98.83
|
PP = $102.83
|
|
MB = $107.97
|
Most Recent Note - 2/14/2012 6:32:48 PM
G - Hovering near its all-time high, extended from its prior base after a spurt of volume-driven gains. Prior highs near $102 define the initial support level to watch above its 50 DMA line.
>>> The latest Featured Stock Update with an annotated graph appeared on 2/10/2012. Click here.
View all notes |
Alert me of new notes |
CANSLIM.net Company Profile |
SEC |
Zacks Reports |
StockTalk |
News |
Chart |
Request a new note
C
A N
S L
I M
|
TNGO
-
NASDAQ
Tangoe Inc
COMPUTER SOFTWARE and SERVICES - Technical and System Software
|
$16.81
|
-0.88
-4.97% |
$17.89
|
777,374
370.18% of 50 DAV
50 DAV is 210,000
|
$17.78
-5.46%
|
2/13/2012
|
$15.39
|
PP = $16.51
|
|
MB = $17.34
|
Most Recent Note - 2/15/2012 1:16:43 PM
Y - Erasing a large part of the prior session's big gain with a loss today on heavy volume. Color code is changed to yellow while pulling back near its prior high which define initial support to watch. Due to report earnings after the close today, and volume and volatility often increase near earnings news. TNGO was featured in yellow in the 2/13/12 mid-day report (read here) with a pivot point cited based on its 52-week high plus 10 cents. See the latest FSU analysis for more details and an annotated graph.
>>> The latest Featured Stock Update with an annotated graph appeared on 2/14/2012. Click here.
View all notes |
Alert me of new notes |
CANSLIM.net Company Profile |
SEC |
Zacks Reports |
StockTalk |
News |
Chart |
Request a new note
C
A N
S L
I M
|
TSCO
-
NASDAQ
Tractor Supply Co
SPECIALTY RETAIL - Specialty Retail, Other
|
$83.66
|
-0.87
-1.03% |
$85.00
|
636,541
87.64% of 50 DAV
50 DAV is 726,300
|
$87.13
-3.98%
|
1/12/2012
|
$79.12
|
PP = $75.58
|
|
MB = $79.36
|
Most Recent Note - 2/14/2012 6:49:22 PM
G - Volume totals have been cooling while stubbornly holding its ground near its all-time high. Reported earnings +43% on +20% sales revenues for the quarter ended December 31, 2011 versus the year ago period. Prior highs in the mid-$70s which were a resistance area now define initial support to watch on pullbacks.
>>> The latest Featured Stock Update with an annotated graph appeared on 1/12/2012. Click here.
View all notes |
Alert me of new notes |
CANSLIM.net Company Profile |
SEC |
Zacks Reports |
StockTalk |
News |
Chart |
Request a new note
C
A N
S L
I M
|
UA
-
NYSE
Under Armour Inc Cl A
CONSUMER NON-DURABLES - Textile - Apparel Clothing
|
$84.05
|
-0.70
-0.83% |
$86.87
|
2,063,488
167.41% of 50 DAV
50 DAV is 1,232,600
|
$87.40
-3.83%
|
2/15/2012
|
$85.77
|
PP = $84.86
|
|
MB = $89.10
|
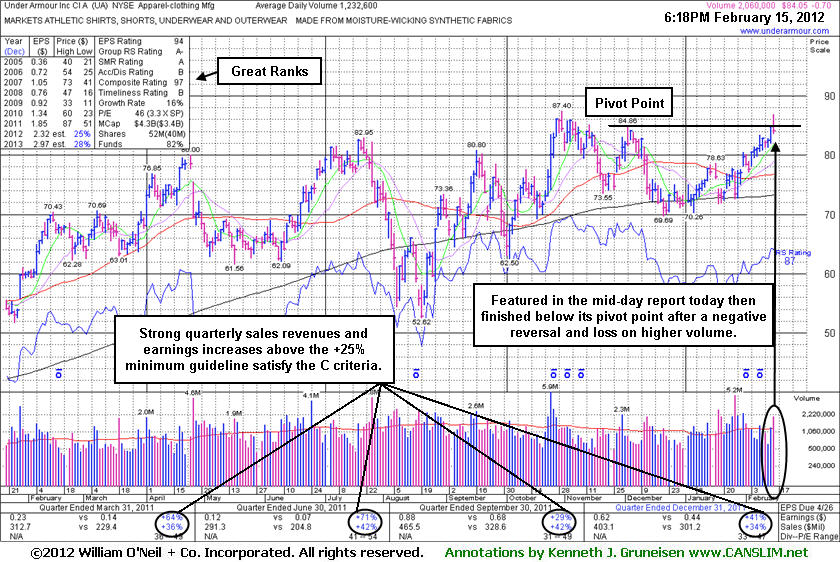
Most Recent Note - 2/15/2012 6:47:22 PM
Y - Color code was changed to yellow with new pivot point cited based on its 12/02/11 high while working on a 16-week "double bottom" base pattern, but it finished the session with a loss on higher volume following a "negative reversal". See the latest FSU analysis for more details and a new annotated graph.
>>> The latest Featured Stock Update with an annotated graph appeared on 2/15/2012. Click here.
View all notes |
Alert me of new notes |
CANSLIM.net Company Profile |
SEC |
Zacks Reports |
StockTalk |
News |
Chart |
Request a new note
C
A N
S L
I M
|
UBNT
-
NASDAQ
Ubiquiti Networks Inc
TELECOMMUNICATIONS - Diversified Communication Serv
|
$23.28
|
-1.02
-4.20% |
$24.86
|
186,246
68.55% of 50 DAV
50 DAV is 271,700
|
$27.23
-14.51%
|
1/27/2012
|
$22.25
|
PP = $23.14
|
|
MB = $24.30
|
Most Recent Note - 2/15/2012 6:49:41 PM
Y - Color code is changed to yellow after 3 consecutive losses on below average volume. Consolidating just above its pivot point and prior highs in the $23 area noted as initial support to watch on pullbacks.
>>> The latest Featured Stock Update with an annotated graph appeared on 2/1/2012. Click here.
View all notes |
Alert me of new notes |
CANSLIM.net Company Profile |
SEC |
Zacks Reports |
StockTalk |
News |
Chart |
Request a new note
C
A N
S L
I M
|
Symbol/Exchange
Company Name
Industry Group |
PRICE |
CHANGE
(%Change) |
Day High |
Volume
(% DAV)
(% 50 day avg vol) |
52 Wk Hi
% From Hi |
Featured
Date |
Price
Featured |
Pivot Featured |
|
Max Buy |
ULTA
-
NASDAQ
Ulta Salon Cosm & Frag
SPECIALTY RETAIL - Specialty Retail, Other
|
$83.53
|
+0.73
0.88% |
$84.48
|
955,519
113.87% of 50 DAV
50 DAV is 839,100
|
$83.00
0.64%
|
1/11/2012
|
$71.97
|
PP = $75.80
|
|
MB = $79.59
|
Most Recent Note - 2/9/2012 4:11:17 PM
G - Inched to another new all-time high today with a small gain backed by +31% above average volume. Color code was changed to green after wedging up from a riskier late-stage base without sufficient volume to trigger a proper technical buy signal. Prior lows near $64 define important chart support above its 200 DMA line.
>>> The latest Featured Stock Update with an annotated graph appeared on 1/11/2012. Click here.
View all notes |
Alert me of new notes |
CANSLIM.net Company Profile |
SEC |
Zacks Reports |
StockTalk |
News |
Chart |
Request a new note
C
A N
S L
I M
|
V
-
NYSE
Visa Inc Cl A
DIVERSIFIED SERVICES - Business/Management Services
|
$115.10
|
+0.08
0.07% |
$117.18
|
5,423,193
132.90% of 50 DAV
50 DAV is 4,080,800
|
$115.25
-0.13%
|
2/2/2012
|
$105.43
|
PP = $104.30
|
|
MB = $109.52
|
Most Recent Note - 2/14/2012 6:38:36 PM
G - Ended at a best-ever close today with a gain on average volume. Prior highs in the $103-104 area define initial support to watch on pullbacks.
>>> The latest Featured Stock Update with an annotated graph appeared on 1/23/2012. Click here.
View all notes |
Alert me of new notes |
CANSLIM.net Company Profile |
SEC |
Zacks Reports |
StockTalk |
News |
Chart |
Request a new note
C
A N
S L
I M
|