***Last / Change / Volume data in this table is the closing quote data***
Symbol/Exchange
Company Name
Industry Group |
PRICE |
CHANGE
(%Change) |
Day High |
Volume
(% DAV)
(% 50 day avg vol) |
52 Wk Hi
% From Hi |
Featured
Date |
Price
Featured |
Pivot Featured |
|
Max Buy |
BIDU
-
NASDAQ
Baidu Inc Ads
INTERNET - Internet Information Providers
|
$128.04
|
-0.77
-0.60% |
$129.28
|
4,701,759
60.97% of 50 DAV
50 DAV is 7,711,500
|
$131.63
-2.73%
|
2/1/2011
|
$117.74
|
PP = $112.08
|
|
MB = $117.68
|
Most Recent Note - 2/11/2011 5:36:29 PM
G - Hit another new all-time high with today's 5th consecutive gain on average volume. Prior highs in the $112-115 area define initial chart support to watch now.
>>> The latest Featured Stock Update with an annotated graph appeared on 2/2/2011. Click here.
View all notes |
Alert me of new notes |
CANSLIM.net Company Profile |
SEC |
Zacks Reports |
StockTalk |
News |
Chart |
Request a new note
C
A N
S L
I M


|
CMG
-
NYSE
Chipotle Mexican Grill
LEISURE - Restaurants
|
$265.58
|
-7.37
-2.70% |
$273.27
|
1,228,383
113.18% of 50 DAV
50 DAV is 1,085,300
|
$275.00
-3.43%
|
2/11/2011
|
$271.15
|
PP = $262.87
|
|
MB = $276.01
|
 Most Recent Note - 2/15/2011 3:52:33 PM
Y - Down on near average volume today after a recent spurt of gains with above average volume. Reported strong earnings and technically rallied "straight up from the bottom" from an 11-week cup shaped base without a handle.
>>> The latest Featured Stock Update with an annotated graph appeared on 2/11/2011. Click here.
View all notes |
Alert me of new notes |
CANSLIM.net Company Profile |
SEC |
Zacks Reports |
StockTalk |
News |
Chart |
Request a new note
C
A N
S L
I M
|
CRUS
-
NASDAQ
Cirrus Logic Inc
ELECTRONICS - Semiconductor - Specialized
|
$24.59
|
-0.36
-1.44% |
$25.48
|
3,249,022
97.39% of 50 DAV
50 DAV is 3,336,000
|
$25.15
-2.23%
|
1/28/2011
|
$20.69
|
PP = $19.17
|
|
MB = $20.13
|
Most Recent Note - 2/14/2011 2:42:21 PM
G - Perched near its 52-week high, holding its ground stubbornly after volume-driven gains. Extended from its latest sound base pattern, meanwhile patience may allow for secondary buy points to develop. Prior highs define chart support levels to watch on pullbacks.
>>> The latest Featured Stock Update with an annotated graph appeared on 1/28/2011. Click here.
View all notes |
Alert me of new notes |
CANSLIM.net Company Profile |
SEC |
Zacks Reports |
StockTalk |
News |
Chart |
Request a new note
C
A N
S L
I M
|
CTSH
-
NASDAQ
Cognizant Tech Sol Cl A
COMPUTER SOFTWARE and SERVICES - Business Software and Services
|
$76.50
|
+0.12
0.16% |
$76.88
|
2,011,970
90.63% of 50 DAV
50 DAV is 2,220,000
|
$77.08
-0.75%
|
2/7/2011
|
$75.09
|
PP = $76.46
|
|
MB = $80.28
|
Most Recent Note - 2/11/2011 5:03:44 PM
Y - Consolidating above its 50 DMA line, it faces no resistance due to overhead supply after closing today's session -2% off its 52-week high. See the latest FSU analysis for details and a new annotated graph.
>>> The latest Featured Stock Update with an annotated graph appeared on 2/8/2011. Click here.
View all notes |
Alert me of new notes |
CANSLIM.net Company Profile |
SEC |
Zacks Reports |
StockTalk |
News |
Chart |
Request a new note
C
A N
S L
I M
|
DECK
-
NASDAQ
Deckers Outdoor Corp
CONSUMER NON-DURABLES - Textile - Apparel Footwear
|
$84.54
|
-1.93
-2.23% |
$86.74
|
896,069
53.13% of 50 DAV
50 DAV is 1,686,700
|
$87.88
-3.80%
|
2/3/2011
|
$79.61
|
PP = $82.67
|
|
MB = $86.80
|
Most Recent Note - 2/15/2011 3:59:06 PM
Y - Today quiet loss ends a streak of 10 consecutive gains with below average volume. No gains above the new pivot point came with at least +50% above average volume necessary to technically trigger a proper new (or add-on) buy signal.
>>> The latest Featured Stock Update with an annotated graph appeared on 1/26/2011. Click here.
View all notes |
Alert me of new notes |
CANSLIM.net Company Profile |
SEC |
Zacks Reports |
StockTalk |
News |
Chart |
Request a new note
C
A N
S L
I M
|
Symbol/Exchange
Company Name
Industry Group |
PRICE |
CHANGE
(%Change) |
Day High |
Volume
(% DAV)
(% 50 day avg vol) |
52 Wk Hi
% From Hi |
Featured
Date |
Price
Featured |
Pivot Featured |
|
Max Buy |
EZCH
-
NASDAQ
Ezchip Semiconductor Ltd
ELECTRONICS - Semiconductor - Specialized
|
$30.12
|
-0.49
-1.60% |
$30.40
|
379,114
98.80% of 50 DAV
50 DAV is 383,700
|
$33.48
-10.04%
|
12/2/2010
|
$27.53
|
PP = $26.00
|
|
MB = $27.30
|
Most Recent Note - 2/14/2011 3:21:00 PM
G - Today's gain with above average volume is indicative of support near its 50 DMA line. On 2/10/11 it reported earnings +41% on +33% sales revenues for the quarter ended December 31, 2010, and gapped down undercutting its 50 DMA line and prior chart highs in the $29 area then rebounded to close well above both. As previously noted - "Volume and volatility often increase near corporate earnings news."
>>> The latest Featured Stock Update with an annotated graph appeared on 1/21/2011. Click here.
View all notes |
Alert me of new notes |
CANSLIM.net Company Profile |
SEC |
Zacks Reports |
StockTalk |
News |
Chart |
Request a new note
C
A N
S L
I M
|
EZPW
-
NASDAQ
Ezcorp Inc Cl A
SPECIALTY RETAIL - Specialty Retail, Other
|
$27.46
|
-0.67
-2.38% |
$28.00
|
339,290
85.08% of 50 DAV
50 DAV is 398,800
|
$29.94
-8.28%
|
11/5/2010
|
$24.02
|
PP = $23.85
|
|
MB = $25.04
|
Most Recent Note - 2/15/2011 4:03:03 PM
G - Small gap down today on below average (but higher) volume led to a close back under its 50 DMA line again. Showing resilience in recent Weeks while volume totals have been cooling, but it has not built a sound new base. Recent low ($25.56 on 1/25/11) defines an important support level now.
>>> The latest Featured Stock Update with an annotated graph appeared on 2/3/2011. Click here.
View all notes |
Alert me of new notes |
CANSLIM.net Company Profile |
SEC |
Zacks Reports |
StockTalk |
News |
Chart |
Request a new note
C
A N
S L
I M
|
FOSL
-
NASDAQ
Fossil Inc
CONSUMER DURABLES - Recreational Goods, Other
|
$78.77
|
-4.74
-5.68% |
$80.98
|
4,328,527
637.30% of 50 DAV
50 DAV is 679,200
|
$83.68
-5.87%
|
2/1/2011
|
$73.30
|
PP = $74.44
|
|
MB = $78.16
|
Most Recent Note - 2/15/2011 3:48:55 PM
G - Gapped down today following 8 consecutive gains into new high territory after reporting earnings +42% on +33% sales revenues. Prior resistance in the $74 area defines initial chart support above its 50 DMA line.
>>> The latest Featured Stock Update with an annotated graph appeared on 1/12/2011. Click here.
View all notes |
Alert me of new notes |
CANSLIM.net Company Profile |
SEC |
Zacks Reports |
StockTalk |
News |
Chart |
Request a new note
C
A N
S L
I M
|
HMSY
-
NASDAQ
H M S Holdings Corp
COMPUTER SOFTWARE and SERVICES - Healthcare Information Service
|
$70.06
|
+0.06
0.09% |
$71.13
|
229,990
163.23% of 50 DAV
50 DAV is 140,900
|
$70.45
-0.55%
|
11/19/2010
|
$61.89
|
PP = $63.01
|
|
MB = $66.16
|
Most Recent Note - 2/14/2011 5:35:38 PM
G - Hit yet another new 52-week high with today's 10th consecutive gain with light volume since it found support at its 50 DMA line. It quietly rose from an orderly base-on-base type pattern. Waning Relative Strength rank (now 72) has been noted as a concern.
>>> The latest Featured Stock Update with an annotated graph appeared on 1/3/2011. Click here.
View all notes |
Alert me of new notes |
CANSLIM.net Company Profile |
SEC |
Zacks Reports |
StockTalk |
News |
Chart |
Request a new note
C
A N
S L
I M
|
JOBS
-
NASDAQ
Fifty One Job Inc Ads
DIVERSIFIED SERVICES - Staffing and; Outsourcing Service
|
$59.65
|
-0.09
-0.15% |
$60.59
|
46,408
34.17% of 50 DAV
50 DAV is 135,800
|
$61.28
-2.66%
|
2/7/2011
|
$59.23
|
PP = $61.38
|
|
MB = $64.45
|
Most Recent Note - 2/14/2011 3:15:58 PM
Y - Gapped up today, challenging its 52-week high. Its 50 DMA line and recent low ($52.58 on 1/28/11) define important support where violations would raise concerns and trigger technical sell signals. After a long ascending base pattern, subsequent volume-driven gains above its pivot point may trigger a new (or add-on) technical buy signal.
>>> The latest Featured Stock Update with an annotated graph appeared on 2/7/2011. Click here.
View all notes |
Alert me of new notes |
CANSLIM.net Company Profile |
SEC |
Zacks Reports |
StockTalk |
News |
Chart |
Request a new note
C
A N
S L
I M
|
Symbol/Exchange
Company Name
Industry Group |
PRICE |
CHANGE
(%Change) |
Day High |
Volume
(% DAV)
(% 50 day avg vol) |
52 Wk Hi
% From Hi |
Featured
Date |
Price
Featured |
Pivot Featured |
|
Max Buy |
LULU
-
NASDAQ
Lululemon Athletica
MANUFACTURING - Textile Manufacturing
|
$81.53
|
-2.17
-2.59% |
$83.31
|
1,560,291
66.75% of 50 DAV
50 DAV is 2,337,600
|
$85.28
-4.40%
|
1/26/2011
|
$68.11
|
PP = $74.70
|
|
MB = $78.44
|
Most Recent Note - 2/15/2011 3:56:10 PM
G - Quietly pulling back from its 52-week high after a streak of 7 consecutive gains with higher volume. Extended from its latest sound base, its prior highs near $74 define chart support to watch now.
>>> The latest Featured Stock Update with an annotated graph appeared on 1/14/2011. Click here.
View all notes |
Alert me of new notes |
CANSLIM.net Company Profile |
SEC |
Zacks Reports |
StockTalk |
News |
Chart |
Request a new note
C
A N
S L
I M
|
MWIV
-
NASDAQ
M W I Veterinary Supply
HEALTH SERVICES - Medical Instruments and; Supplies
|
$70.46
|
-0.15
-0.21% |
$70.99
|
96,791
156.62% of 50 DAV
50 DAV is 61,800
|
$70.94
-0.68%
|
11/4/2010
|
$61.79
|
PP = $59.60
|
|
MB = $62.58
|
Most Recent Note - 2/11/2011 10:12:56 AM
G - Quietly perched at its all-time high, however it has not built a sound new base pattern. It found support near its 50 DMA line recently. Sales revenues acceleration (bigger percentage increases sequentially) is a very reassuring sign.
>>> The latest Featured Stock Update with an annotated graph appeared on 2/2/2011. Click here.
View all notes |
Alert me of new notes |
CANSLIM.net Company Profile |
SEC |
Zacks Reports |
StockTalk |
News |
Chart |
Request a new note
C
A N
S L
I M
|
NFLX
-
NASDAQ
Netflix Inc
SPECIALTY RETAIL - Music and Video Stores
|
$240.79
|
-6.76
-2.73% |
$244.65
|
6,848,186
121.99% of 50 DAV
50 DAV is 5,613,900
|
$247.55
-2.73%
|
1/10/2011
|
$187.88
|
PP = $209.34
|
|
MB = $219.81
|
Most Recent Note - 2/15/2011 12:32:20 PM
G - Small gap down today followed a considerable gain with above average volume for yet another new all-time high. It has been noted as extended from a sound base, and prior high ($209) defines support to watch above its 50 DMA line.
>>> The latest Featured Stock Update with an annotated graph appeared on 1/10/2011. Click here.
View all notes |
Alert me of new notes |
CANSLIM.net Company Profile |
SEC |
Zacks Reports |
StockTalk |
News |
Chart |
Request a new note
C
A N
S L
I M
|
NTAP
-
NASDAQ
Netapp Inc
COMPUTER HARDWARE - Data Storage Devices
|
$58.44
|
-1.18
-1.98% |
$59.51
|
4,724,601
109.26% of 50 DAV
50 DAV is 4,324,000
|
$61.02
-4.23%
|
1/6/2011
|
$57.49
|
PP = $58.06
|
|
MB = $60.96
|
Most Recent Note - 2/14/2011 2:54:51 PM
G - Perched at its 52-week high today after 6 consecutive gains with volume light or near average while rising from support near its 50 DMA line. It has not formed any recent sound base pattern.
>>> The latest Featured Stock Update with an annotated graph appeared on 2/4/2011. Click here.
View all notes |
Alert me of new notes |
CANSLIM.net Company Profile |
SEC |
Zacks Reports |
StockTalk |
News |
Chart |
Request a new note
C
A N
S L
I M
|
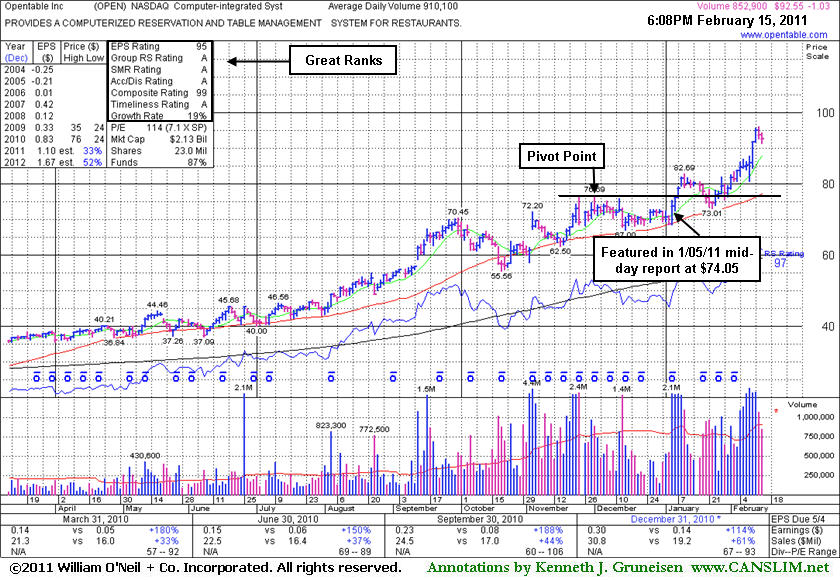
OPEN
-
NASDAQ
Opentable Inc
INTERNET - Internet Software and Services
|
$92.55
|
-1.03
-1.10% |
$94.30
|
854,600
93.90% of 50 DAV
50 DAV is 910,100
|
$95.97
-3.56%
|
1/5/2011
|
$74.05
|
PP = $76.79
|
|
MB = $80.63
|
Most Recent Note - 2/15/2011 6:27:33 PM
G - Quietly consolidating after a streak of volume-driven gains for new all-time highs. Extended from a sound base pattern, meanwhile prior highs define support above its 50 DMA line. See the latest FSU summary for more details and an annotated graph.
>>> The latest Featured Stock Update with an annotated graph appeared on 2/15/2011. Click here.
View all notes |
Alert me of new notes |
CANSLIM.net Company Profile |
SEC |
Zacks Reports |
StockTalk |
News |
Chart |
Request a new note
C
A N
S L
I M
|
Symbol/Exchange
Company Name
Industry Group |
PRICE |
CHANGE
(%Change) |
Day High |
Volume
(% DAV)
(% 50 day avg vol) |
52 Wk Hi
% From Hi |
Featured
Date |
Price
Featured |
Pivot Featured |
|
Max Buy |
ORCL
-
NASDAQ
Oracle Corp
COMPUTER SOFTWARE and SERVICES - Application Software
|
$32.76
|
-0.53
-1.59% |
$33.15
|
19,330,453
72.87% of 50 DAV
50 DAV is 26,526,900
|
$33.59
-2.47%
|
1/20/2011
|
$32.31
|
PP = $32.37
|
|
MB = $33.99
|
Most Recent Note - 2/14/2011 2:49:04 PM
Y - Volume totals have been cooling while hovering near its 52-week high, below its "max buy" level. Near-term support to watch is its 50 DMA line.
>>> The latest Featured Stock Update with an annotated graph appeared on 1/7/2011. Click here.
View all notes |
Alert me of new notes |
CANSLIM.net Company Profile |
SEC |
Zacks Reports |
StockTalk |
News |
Chart |
Request a new note
C
A N
S L
I M
|
PAY
-
NYSE
Verifone Systems Inc
COMPUTER HARDWARE - Transaction Automation Systems
|
$47.95
|
-0.23
-0.48% |
$48.48
|
2,010,096
131.97% of 50 DAV
50 DAV is 1,523,100
|
$49.07
-2.28%
|
1/27/2011
|
$41.77
|
PP = $44.97
|
|
MB = $47.22
|
Most Recent Note - 2/14/2011 1:15:46 PM
G - Considerable gain today with above average volume for a new 52-week high, technically triggering a new (or add-on) technical buy signal, yet quickly getting extended beyond its "max buy" level. Color code is changed to green.
>>> The latest Featured Stock Update with an annotated graph appeared on 1/27/2011. Click here.
View all notes |
Alert me of new notes |
CANSLIM.net Company Profile |
SEC |
Zacks Reports |
StockTalk |
News |
Chart |
Request a new note
C
A N
S L
I M
|
PCLN
-
NASDAQ
Priceline.Com Inc
INTERNET - Internet Software and Services
|
$457.20
|
+0.19
0.04% |
$464.47
|
888,106
94.84% of 50 DAV
50 DAV is 936,400
|
$459.57
-0.52%
|
1/3/2011
|
$399.55
|
PP = $428.20
|
|
MB = $449.61
|
Most Recent Note - 2/11/2011 5:34:18 PM
G - Color code was changed to green after rising above its "max buy" level this week. Prior highs and its 50 DMA line define support to watch.
>>> The latest Featured Stock Update with an annotated graph appeared on 2/14/2011. Click here.
View all notes |
Alert me of new notes |
CANSLIM.net Company Profile |
SEC |
Zacks Reports |
StockTalk |
News |
Chart |
Request a new note
C
A N
S L
I M
|
RAX
-
NYSE
Rackspace Hosting Inc
INTERNET - Internet Software and; Services
|
$38.62
|
-0.68
-1.73% |
$39.50
|
1,772,448
95.31% of 50 DAV
50 DAV is 1,859,700
|
$40.62
-4.92%
|
1/10/2011
|
$22.84
|
PP = $32.76
|
|
MB = $34.40
|
Most Recent Note - 2/14/2011 3:18:02 PM
G - Pulling back today after a considerable gap up on 2/11/11 for a considerable gain on heavy volume after reporting earnings +29% on +27% sales revenues for the quarter ended December 31, 2010 versus the year ago period. It is extended from any sound base. Recent highs near $35 define support to watch above its 50 DMA line.
>>> The latest Featured Stock Update with an annotated graph appeared on 2/9/2011. Click here.
View all notes |
Alert me of new notes |
CANSLIM.net Company Profile |
SEC |
Zacks Reports |
StockTalk |
News |
Chart |
Request a new note
C
A N
S L
I M
|
ROVI
-
NASDAQ
Rovi Corp
COMPUTER SOFTWARE andamp; SERVICES - Security Software andamp; Services
|
$64.45
|
-1.07
-1.63% |
$66.00
|
2,311,134
134.75% of 50 DAV
50 DAV is 1,715,100
|
$69.50
-7.27%
|
10/29/2010
|
$49.99
|
PP = $53.10
|
|
MB = $55.76
|
Most Recent Note - 2/14/2011 2:45:07 PM
G - Small gap up gain backed by higher volume today. Its 50 DMA line and the 1/31/11 low ($60.15) define near-term chart support levels to watch.
>>> The latest Featured Stock Update with an annotated graph appeared on 1/25/2011. Click here.
View all notes |
Alert me of new notes |
CANSLIM.net Company Profile |
SEC |
Zacks Reports |
StockTalk |
News |
Chart |
Request a new note
C
A N
S L
I M
|
Symbol/Exchange
Company Name
Industry Group |
PRICE |
CHANGE
(%Change) |
Day High |
Volume
(% DAV)
(% 50 day avg vol) |
52 Wk Hi
% From Hi |
Featured
Date |
Price
Featured |
Pivot Featured |
|
Max Buy |
TIBX
-
NASDAQ
Tibco Software Inc
COMPUTER SOFTWARE and SERVICES - Business Software and Services
|
$25.33
|
-0.24
-0.94% |
$25.61
|
1,069,231
38.66% of 50 DAV
50 DAV is 2,765,900
|
$25.70
-1.44%
|
2/1/2011
|
$24.35
|
PP = $22.18
|
|
MB = $23.29
|
Most Recent Note - 2/14/2011 2:46:09 PM
G - Inched to another new 52-week high today with a gain on lighter volume. Extended from its latest sound base, its prior highs in the $22 area define support. See the latest FSU analysis for details and a new annotated graph.
>>> The latest Featured Stock Update with an annotated graph appeared on 2/10/2011. Click here.
View all notes |
Alert me of new notes |
CANSLIM.net Company Profile |
SEC |
Zacks Reports |
StockTalk |
News |
Chart |
Request a new note
C
A N
S L
I M
|
UA
-
NYSE
Under Armour Inc Cl A
CONSUMER NON-DURABLES - Textile - Apparel Clothing
|
$67.34
|
-1.62
-2.35% |
$68.72
|
751,634
95.82% of 50 DAV
50 DAV is 784,400
|
$70.43
-4.39%
|
1/27/2011
|
$58.31
|
PP = $56.99
|
|
MB = $59.84
|
Most Recent Note - 2/15/2011 3:53:53 PM
G - Quietly pulling back from its 52-week high following a recent spurt of gains with above average volume. Prior resistance in the $60 area defines initial support to watch above its 50 DMA line.
>>> The latest Featured Stock Update with an annotated graph appeared on 2/1/2011. Click here.
View all notes |
Alert me of new notes |
CANSLIM.net Company Profile |
SEC |
Zacks Reports |
StockTalk |
News |
Chart |
Request a new note
C
A N
S L
I M
|
ULTA
-
NASDAQ
Ulta Salon Cosm & Frag
SPECIALTY RETAIL - Specialty Retail, Other
|
$42.32
|
-0.67
-1.56% |
$42.76
|
394,880
67.71% of 50 DAV
50 DAV is 583,200
|
$43.83
-3.45%
|
1/6/2011
|
$36.12
|
PP = $37.34
|
|
MB = $39.21
|
Most Recent Note - 2/11/2011 10:19:27 AM
G - Near its 52-week high today, posting its 7th consecutive small gain. It is extended from a sound base pattern, and prior highs in the $37-38 area define chart support to watch above its 50 DMA line.
>>> The latest Featured Stock Update with an annotated graph appeared on 1/6/2011. Click here.
View all notes |
Alert me of new notes |
CANSLIM.net Company Profile |
SEC |
Zacks Reports |
StockTalk |
News |
Chart |
Request a new note
C
A N
S L
I M
|