You are not logged in.
This means you
CAN ONLY VIEW reports that were published prior to Monday, February 26, 2024.
You
MUST UPGRADE YOUR MEMBERSHIP if you want to see any current reports.
AFTER MARKET UPDATE - FRIDAY, FEBRUARY 14TH, 2020
Previous After Market Report Next After Market Report >>>
|
|
|
|
DOW |
-25.23 |
29,398.08 |
-0.09% |
|
Volume |
844,303,310 |
+3% |
|
Volume |
2,209,940,490 |
-2% |
|
NASDAQ |
+16.90 |
9,728.87 |
+0.17% |
|
Advancers |
1,479 |
52% |
|
Advancers |
1,432 |
45% |
|
S&P 500 |
+6.22 |
3,380.16 |
+0.18% |
|
Decliners |
1,371 |
48% |
|
Decliners |
1,723 |
55% |
|
Russell 2000 |
-6.15 |
1,687.58 |
-0.36% |
|
52 Wk Highs |
264 |
|
|
52 Wk Highs |
205 |
|
|
S&P 600 |
-5.20 |
1,018.27 |
-0.51% |
|
52 Wk Lows |
57 |
|
|
52 Wk Lows |
64 |
|
|
 |
Major Indices Rose but Small Caps Sputtered
Kenneth J. Gruneisen - Passed the CAN SLIM® Master's Exam
The Dow fell 25 points while the S&P 500 and Nasdaq Composite each inched 0.2% higher. For the week the S&P 500 advanced 1.6%, while the Nasdaq jumped 2.2% and the Dow rose 1%. Advancers led decliners by a narrow margin on the NYSE but delciners led advancers by 8-7 on the Nasdaq exchange. The reported volume totals were mixed, higher than the prior session total on the NYSE and slightly lower on the Nasdaq exchange. There were 92 high-ranked companies from the Leaders List that hit a new 52-week high and were listed on the BreakOuts Page, versus 99 on the prior session. New 52-week highs totals again solidly outnumbered new 52-week lows on the NYSE and on the Nasdaq exchange. The major indices' (M criteria) remain in a confirmed uptrend. Disciplined investors buy individual stocks on a case-by-case basis only if all key criteria are met. The Featured Stocks Page provides the most timely analysis on high-ranked leaders. Charts used courtesy of www.stockcharts.com

PICTURED: The Dow Jones Industrial Average is perched near its all-time high.
Stocks U.S. equities were mixed on Friday as investors assessed a series of economic, earnings, and geopolitical updates. In geopolitical news, tensions between the United States and China flared up as the U.S. Justice Department announced racketeering and conspiracy charges for Chinese telecom giant Huawei. On the data front, retail sales climbed 0.3% month-over-month in January, in-line with projections. However, the prior month’s advance was downwardly revised and sales at clothing stores fell to the lowest level since 2009. A separate update showed U.S. factory output fell 0.3% in January, marking the second-straight monthly drop. A more optimistic report from the University of Michigan showed that U.S. consumer sentiment rose to 100.9 for February, the highest reading in nearly two years. Treasuries strengthened following the data updates with the yield on the 10-year note falling one basis points to 1.59%.
Eight of 11 S&P 500 sectors finished in positive territory with the Real Estate and Utilities groups pacing the gains. In earnings, NVIDIA (NVDA +7%) hit a new all-time high after the semiconductor company topped analyst profit estimates while Expedia (EXPE +11.04%) rose after posting optimistic 2020 guidance. Yelp (YELP -3.48%) after the online review company missed consensus earnings and revenue projections. In commodities, WTI crude added another 1.3% to $52.07/barrel to snap a five-week losing streak. |
 Kenneth J. Gruneisen started out as a licensed stockbroker in August 1987, a couple of months prior to the historic stock market crash that took the Dow Jones Industrial Average down -22.6% in a single day. He has published daily fact-based fundamental and technical analysis on high-ranked stocks online for two decades. Through FACTBASEDINVESTING.COM, Kenneth provides educational articles, news, market commentary, and other information regarding proven investment systems that work in good times and bad.
Comments contained in the body of this report are technical opinions only and are not necessarily those of Gruneisen Growth Corp. The material herein has been obtained from sources believed to be reliable and accurate, however, its accuracy and completeness cannot be guaranteed. Our firm, employees, and customers may effect transactions, including transactions contrary to any recommendation herein, or have positions in the securities mentioned herein or options with respect thereto. Any recommendation contained in this report may not be suitable for all investors and it is not to be deemed an offer or solicitation on our part with respect to the purchase or sale of any securities. |
|
 |
Commodity-Linked Groups and Networking Index Led Decliners
Kenneth J. Gruneisen - Passed the CAN SLIM® Master's Exam
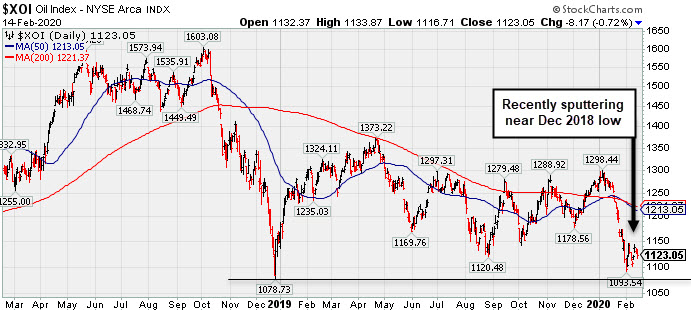
The Bank Index ($BKX -0.30%), Broker/Dealer Index ($XBD -0.09%) and Retail Index ($RLX -0.06%) sputtered on Friday. The Biotech Index ($BTK +0.44%) posted a modest gain while the Semiconductor Index ($SOX -0.19%) inched lower and the Networking Index ($NWX -1.28%) fell. Energy-linked groups had a negative bias as the Oil Services Index ($OSX -0.47%) and Integrated Oil Index ($XOI -0.72%) both fell. The Gold & Silver Index ($XAU -1.09%) also lost ground.
PICTURED: The Integrated Oil Index ($XOI -0.72%) has been sputtering near its December 2018 low.
| Oil Services |
$OSX |
64.42 |
-0.27 |
-0.42% |
-17.72% |
| Integrated Oil |
$XOI |
1,123.05 |
-8.17 |
-0.72% |
-11.61% |
| Semiconductor |
$SOX |
1,956.56 |
-3.78 |
-0.19% |
+5.78% |
| Networking |
$NWX |
563.74 |
-7.32 |
-1.28% |
-3.37% |
| Broker/Dealer |
$XBD |
302.70 |
-0.27 |
-0.09% |
+4.24% |
| Retail |
$RLX |
2,664.66 |
-1.59 |
-0.06% |
+8.79% |
| Gold & Silver |
$XAU |
102.01 |
-1.13 |
-1.10% |
-4.59% |
| Bank |
$BKX |
109.23 |
-0.33 |
-0.30% |
-3.64% |
| Biotech |
$BTK |
5,255.24 |
+23.18 |
+0.44% |
+3.71% |
|
|
|
 |
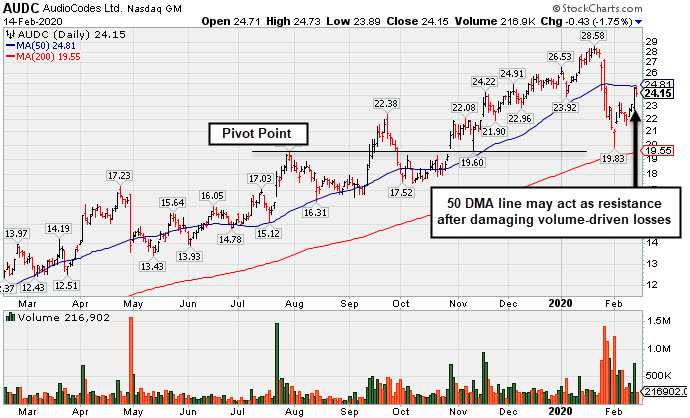
Rebounding After Damaging Losses Triggered Sell Signals
Kenneth J. Gruneisen - Passed the CAN SLIM® Master's Exam
Audiocodes Ltd (AUDC -$0.43 or -1.75% to $24.15) met resistance today after rebounding near its 50-day moving average (DMA) line ($24.94). That short-term average may act as resistance after damaging volume-driven losses triggered technical sell signals. Fundamentals remain strong after it reported earnings +30% on +15% sales revenues for the Dec '19 quarter, continuing its strong earnings track record for a 12th consecutive quarterly comparison above the +25% minimum guideline (C criteria). Annual earnings growth has been strong and it has a 98 Earnings Per Share Rating.
This Israel-based designer of advanced voice-over-IP products suffered more damaging losses after it was last shown in this FSU section on 1/27/20 with an annotated graph under the headline, "Showed Resilience With Close in Upper Third of Intra-day Range". Its current Up/Down Volume Ratio of 0.8 is an unbiased indication its shares have been under distributional pressure over the past 50 days.
The number of top-rated funds owning its shares rose from 33 in Mar '18 to 83 in Dec '19, a reassuring sign concerning the I criteria. It has a Timeliness Rating of C and Sponsorship Rating of B. The small supply of 22.8 million shares (S criteria) in the public float can contribute to greater price volatility in the event of institutional buying or selling.
Charts courtesy of www.stockcharts.com
 |
|
|
Color Codes Explained :
Y - Better candidates highlighted by our
staff of experts.
G - Previously featured
in past reports as yellow but may no longer be buyable under the
guidelines.
***Last / Change / Volume data in this table is the closing quote data***
Symbol/Exchange
Company Name
Industry Group |
PRICE |
CHANGE
(%Change) |
Day High |
Volume
(% DAV)
(% 50 day avg vol) |
52 Wk Hi
% From Hi |
Featured
Date |
Price
Featured |
Pivot Featured |
|
Max Buy |
 FTNT
-
NASDAQ
FTNT
-
NASDAQ
Fortinet Inc
Computer Sftwr-Security
|
$119.19
|
+0.09
0.08% |
$119.62
|
970,562
86.12% of 50 DAV
50 DAV is 1,127,000
|
$121.82
-2.16%
|
12/9/2019
|
$103.85
|
PP = $106.10
|
|
MB = $111.41
|
Most Recent Note - 2/12/2020 6:32:47 PM
G - Reported earnings +29% on +21% sales revenues for the Dec '19 quarter, continuing its strong earnings track record above the +25% minimum guideline (C criteria). Consolidating above the prior low ($112.06) and 50 DMA line ($112.05) which coincide defining important near-term support to watch.
>>> FEATURED STOCK ARTICLE : Fortinet Posted Gain for Best-Ever Close - 2/4/2020 |
View all notes |
Set NEW NOTE alert |
Company Profile |
SEC
News |
Chart |
Request a new note
C
A
S
I |
SPSC
-
NASDAQ
S P S Commerce Inc
COMPUTER SOFTWARE and SERVICES - Application Software
|
$60.47
|
+0.43
0.72% |
$62.26
|
465,634
271.35% of 50 DAV
50 DAV is 171,600
|
$60.35
0.20%
|
11/29/2019
|
$56.59
|
PP = $59.24
|
|
MB = $62.20
|
 Most Recent Note - 2/14/2020 12:28:26 PM
Y - Hit a new all-time high with today's early gain. Reported earnings +30% on +12% sales revenues for the Dec '19 quarter versus the year ago period. Volume and volatility often increase near earnings news. Found support near its 50 DMA line ($57) during its recent consolidation. Its current Relative Strength Rating of 75 is below the 80+ minimum guideline for buy candidates. A gain and strong close above its pivot point backed by at least +40% above average volume may trigger a new technical buy signal.
>>> FEATURED STOCK ARTICLE : Perched Near High Finding Support at 50-Day Average - 2/3/2020 |
View all notes |
Set NEW NOTE alert |
Company Profile |
SEC
News |
Chart |
Request a new note
C
A
S
I |
AUDC
-
NASDAQ
Audiocodes Ltd
ELECTRONICS - Scientific and Technical Instrum
|
$24.15
|
-0.43
-1.75% |
$24.73
|
216,902
61.27% of 50 DAV
50 DAV is 354,000
|
$28.73
-15.94%
|
9/13/2019
|
$19.68
|
PP = $19.84
|
|
MB = $20.83
|
Most Recent Note - 2/14/2020 5:25:30 PM
G - Met resistance today after rebounding near its 50 DMA line ($24.94). That short-term average may act as resistance after damaging volume-driven losses triggered technical sell signals. Fundamentals remain strong after it reported earnings +30% on +15% sales revenues for the Dec '19 quarter. See the latest FSU analysis for more details and a new annotated graph.
>>> FEATURED STOCK ARTICLE : Rebounding After Damaging Losses Triggered Sell Signals - 2/14/2020 |
View all notes |
Set NEW NOTE alert |
Company Profile |
SEC
News |
Chart |
Request a new note
C
A
S
I |
CHDN
-
NASDAQ
Churchill Downs Inc
LEISURE - Gaming Activities
|
$162.19
|
+0.49
0.30% |
$162.31
|
149,183
76.11% of 50 DAV
50 DAV is 196,000
|
$163.63
-0.88%
|
10/8/2019
|
$129.77
|
PP = $132.83
|
|
MB = $139.47
|
Most Recent Note - 2/12/2020 6:30:40 PM
G - Stubbornly held its ground and hit yet another new 52-week high with today's 5th consecutive gain. Its 50 DMA line ($140) defines near-term support above the prior low ($132.55 on 1/03/19) The Jun and Sep '19 quarterly earnings versus the year ago periods were both below the +25% minimum guideline (C criteria) and raised fundamental concerns.
>>> FEATURED STOCK ARTICLE : Perched at New Record High After Recent Gains on Average Volume - 2/7/2020 |
View all notes |
Set NEW NOTE alert |
Company Profile |
SEC
News |
Chart |
Request a new note
C
A
S
I |
LULU
-
NASDAQ
Lululemon Athletica
MANUFACTURING - Textile Manufacturing
|
$254.41
|
+0.55
0.22% |
$256.00
|
943,549
50.70% of 50 DAV
50 DAV is 1,861,000
|
$256.80
-0.93%
|
9/6/2019
|
$201.25
|
PP = $194.35
|
|
MB = $204.07
|
Most Recent Note - 2/10/2020 6:34:03 PM
G - Extended from any sound base and still hovering near its all-time high with volume totals cooling. Its 50 DMA line ($235) and prior low ($231.84 on 1/27/20) define important near-term support to watch. Fundamentals remain strong.
>>> FEATURED STOCK ARTICLE : Volume Totals Cooling While Hovering Near All-Time High - 1/30/2020 |
View all notes |
Set NEW NOTE alert |
Company Profile |
SEC
News |
Chart |
Request a new note
C
A
S
I |
Symbol/Exchange
Company Name
Industry Group |
PRICE |
CHANGE
(%Change) |
Day High |
Volume
(% DAV)
(% 50 day avg vol) |
52 Wk Hi
% From Hi |
Featured
Date |
Price
Featured |
Pivot Featured |
|
Max Buy |
CPRT
-
NASDAQ
Copart Inc
SPECIALTY RETAIL - Auto Dealerships
|
$103.25
|
-0.10
-0.10% |
$103.79
|
1,674,502
106.25% of 50 DAV
50 DAV is 1,576,000
|
$104.10
-0.82%
|
1/2/2020
|
$92.80
|
PP = $92.51
|
|
MB = $97.14
|
Most Recent Note - 2/12/2020 6:31:26 PM
G - Perched near its all-time high and stubbornly holding its ground, extended from any sound base. Its 50 DMA line ($94.78) defines near-term support above prior highs in the $91-92 area. Fundamentals remain strong.
>>> FEATURED STOCK ARTICLE : New High With Yet Another Gain Backed by Light Volume - 1/28/2020 |
View all notes |
Set NEW NOTE alert |
Company Profile |
SEC
News |
Chart |
Request a new note
C
A
S
I |
SPLK
-
NASDAQ
Splunk Inc
Computer Sftwr-Database
|
$172.52
|
+1.59
0.93% |
$173.84
|
950,025
62.13% of 50 DAV
50 DAV is 1,529,000
|
$172.25
0.16%
|
11/25/2019
|
$147.79
|
PP = $142.16
|
|
MB = $149.27
|
Most Recent Note - 2/10/2020 6:29:56 PM
G - Posted a solid gain on light volume today for its second-best close. It is extended from the previously noted base. Its 50 DMA line ($153) and prior highs in the $142-143 area define important support to watch on pullbacks.
>>> FEATURED STOCK ARTICLE : Volume Totals Cooling While Hovering Near All-Time High - 1/29/2020 |
View all notes |
Set NEW NOTE alert |
Company Profile |
SEC
News |
Chart |
Request a new note
C
A
S
I |
PAYC
-
NYSE
Paycom Software Inc
COMPUTER SOFTWARE and SERVICES - Application Software
|
$314.43
|
+11.14
3.67% |
$315.74
|
862,865
98.73% of 50 DAV
50 DAV is 874,000
|
$342.00
-8.06%
|
11/20/2019
|
$252.97
|
PP = $259.81
|
|
MB = $272.80
|
Most Recent Note - 2/14/2020 5:27:50 PM
G - Posted a 3rd consecutive gain, rebounding after an abrupt retreat near its 50 DMA line ($286.64) and prior high ($279.95 on 11/27/19). More damaging losses would raise concerns and trigger a technical sell signal. Fundamentals remain strong after it reported earnings +41% on +29% for the Dec '19 quarter.
>>> FEATURED STOCK ARTICLE : Pulled Back Near 50-Day Average Following Strong Earnings Report - 2/11/2020 |
View all notes |
Set NEW NOTE alert |
Company Profile |
SEC
News |
Chart |
Request a new note
C
A
S
I |
BLD
-
NYSE
Topbuild Corp
Bldg-Constr Prds/Misc
|
$118.58
|
-0.12
-0.10% |
$119.56
|
129,736
46.17% of 50 DAV
50 DAV is 281,000
|
$120.71
-1.76%
|
12/9/2019
|
$109.71
|
PP = $113.84
|
|
MB = $119.53
|
Most Recent Note - 2/10/2020 12:32:40 PM
Y - Touched a new 52-week high and trading near its "max buy" level with today's 4th consecutive gain. Prior high ($113.74) defines near-term support above its 50 DMA line ($108.91). See the latest FSU analysis for more details and an annotated graph.
>>> FEATURED STOCK ARTICLE : Volume Totals Cooling While Consolidating Near All-Time High - 2/6/2020 |
View all notes |
Set NEW NOTE alert |
Company Profile |
SEC
News |
Chart |
Request a new note
C
A
S
I |
TEAM
-
NASDAQ
Atlassian Corp Plc Cl A
Comp Sftwr-Spec Enterprs
|
$154.42
|
+1.17
0.76% |
$154.49
|
1,043,121
67.43% of 50 DAV
50 DAV is 1,547,000
|
$155.00
-0.37%
|
1/24/2020
|
$144.66
|
PP = $140.49
|
|
MB = $147.51
|
Most Recent Note - 2/10/2020 6:31:20 PM
G - Color code is changed to green after rising above its "max buy" level with today's 3rd consecutive gain. Rallied from a cup-with-handle base pattern with volume +514% above average behind the considerable gain on 1/24/20 triggering a technical buy signal. Bullish action came after it reported earnings +48% on +37% sales revenues for the Dec '19 quarter.
>>> FEATURED STOCK ARTICLE : Atlassian Has Been Hovering Near its All-Time High - 2/12/2020 |
View all notes |
Set NEW NOTE alert |
Company Profile |
SEC
News |
Chart |
Request a new note
C
A
S
I |
Symbol/Exchange
Company Name
Industry Group |
PRICE |
CHANGE
(%Change) |
Day High |
Volume
(% DAV)
(% 50 day avg vol) |
52 Wk Hi
% From Hi |
Featured
Date |
Price
Featured |
Pivot Featured |
|
Max Buy |
GLOB
-
NYSE
Globant SA
Computer-Tech Services
|
$127.98
|
+1.90
1.51% |
$128.49
|
189,550
77.05% of 50 DAV
50 DAV is 246,000
|
$131.00
-2.31%
|
11/14/2019
|
$106.87
|
PP = $112.43
|
|
MB = $118.05
|
Most Recent Note - 2/12/2020 6:25:24 PM
G - Consolidating near its high after wedging to new highs with gains lacking great volume conviction. Its prior high ($112.33) and 50 DMA line ($112.68) define important near-term support to watch.
>>> FEATURED STOCK ARTICLE : Encountering Distributional Pressure After Wedging to New Highs - 2/5/2020 |
View all notes |
Set NEW NOTE alert |
Company Profile |
SEC
News |
Chart |
Request a new note
C
A
S
I |
STNE
-
NASDAQ
Stoneco Ltd Cl A
Finance-CrdtCard/PmtPr
|
$41.82
|
-0.19
-0.45% |
$42.53
|
1,436,184
84.23% of 50 DAV
50 DAV is 1,705,000
|
$45.72
-8.53%
|
1/22/2020
|
$43.94
|
PP = $45.72
|
|
MB = $48.01
|
Most Recent Note - 2/10/2020 6:26:40 PM
G - Violated its 50 DMA line ($40.77) with a streak of 5 consecutive losses and its color code was changed to green. A subsequent rebound and gains above the pivot point backed by at least +40% above average volume are needed to trigger a technical buy signal. See the latest FSU analysis for more details and a new annotated graph.
>>> FEATURED STOCK ARTICLE : 50-Day Moving Average Line Violation Hurts Outlook - 2/10/2020 |
View all notes |
Set NEW NOTE alert |
Company Profile |
SEC
News |
Chart |
Request a new note
C
A
S
I |
DAVA
-
NYSE
Endava Plc Cl A Ads
Computer-Tech Services
|
$53.32
|
-1.66
-3.02% |
$54.85
|
237,994
235.64% of 50 DAV
50 DAV is 101,000
|
$55.50
-3.93%
|
2/13/2020
|
$53.71
|
PP = $49.86
|
|
MB = $52.35
|
Most Recent Note - 2/14/2020 12:10:01 PM
Y - Pulling back today following a considerable gain. Finished strong after highlighted in yellow with new pivot point cited based on its 12/26/19 high plus 10 cents in the 2/13/20 mid-day report. Spiked to a new all-time high with a big gain triggering a technical buy signal. Found prompt support near its 50 DMA line ($47.14) during recent consolidations. Bullish action came after it reported earnings +60% on +24% sales revenues for the quarter ended December 31, 2019 versus the year ago period, marking its 6th consecutive quarter with earnings increasing above the +25 minimum guideline (C criteria). Completed a Secondary Offering on 4/17/19. Limited history was noted as a concern for this UK-based Computer - Tech Services firm since it completed its $20 IPO on 7/27/18. See the latest FSU analysis for more details and an annotated graph.
>>> FEATURED STOCK ARTICLE : Breakout Gain Backed By +462% Above Average Volme - 2/13/2020 |
View all notes |
Set NEW NOTE alert |
Company Profile |
SEC
News |
Chart |
Request a new note
C
A
S
I |
|
|
|
THESE ARE NOT BUY RECOMMENDATIONS!
Comments contained in the body of this report are technical
opinions only. The material herein has been obtained
from sources believed to be reliable and accurate, however,
its accuracy and completeness cannot be guaranteed.
This site is not an investment advisor, hence it does
not endorse or recommend any securities or other investments.
Any recommendation contained in this report may not
be suitable for all investors and it is not to be deemed
an offer or solicitation on our part with respect to
the purchase or sale of any securities. All trademarks,
service marks and trade names appearing in this report
are the property of their respective owners, and are
likewise used for identification purposes only.
This report is a service available
only to active Paid Premium Members.
You may opt-out of receiving report notifications
at any time. Questions or comments may be submitted
by writing to Premium Membership Services 665 S.E. 10 Street, Suite 201 Deerfield Beach, FL 33441-5634 or by calling 1-800-965-8307
or 954-785-1121.
|
|
|