You are not logged in.
This means you
CAN ONLY VIEW reports that were published prior to Monday, April 14, 2025.
You
MUST UPGRADE YOUR MEMBERSHIP if you want to see any current reports.
AFTER MARKET UPDATE - THURSDAY, FEBRUARY 14TH, 2013
Previous After Market Report Next After Market Report >>>
|
|
|
|
DOW |
-9.52 |
13,973.39 |
-0.07% |
|
Volume |
671,839,700 |
+2% |
|
Volume |
1,859,800,140 |
+6% |
|
NASDAQ |
+1.78 |
3,198.66 |
+0.06% |
|
Advancers |
1,506 |
48% |
|
Advancers |
1,316 |
51% |
|
S&P 500 |
+1.05 |
1,521.38 |
+0.07% |
|
Decliners |
1,497 |
48% |
|
Decliners |
1,135 |
44% |
|
Russell 2000 |
+3.18 |
923.76 |
+0.35% |
|
52 Wk Highs |
322 |
|
|
52 Wk Highs |
193 |
|
|
S&P 600 |
+1.63 |
517.23 |
+0.32% |
|
52 Wk Lows |
19 |
|
|
52 Wk Lows |
22 |
|
|
 |
Major Averages Closed Little Changed With Mixed Breadth
Kenneth J. Gruneisen - Passed the CAN SLIM® Master's Exam
On Thursday the major averages closed with little to no gains. The volume totals were reported higher on the NYSE and on the Nasdaq exchange. Breadth was slightly positive as advancers led decliners by a narrow margin on the NYSE and on the Nasdaq exchange. The total number of stocks hitting new 52-week highs easily outnumbered new 52-week lows on the NYSE and on the Nasdaq exchange, and the new lows total was in the single digits on the NYSE. There were 86 high-ranked companies from the CANSLIM.net Leaders List making new 52-week highs and appearing on the CANSLIM.net BreakOuts Page, up from the prior session total of 83 stocks. There were gains for 8 of the 13 high-ranked companies currently included on the Featured Stocks Page.
Disappointing economic growth reports offset an improved U.S. jobs picture and M&A activity. The euro zone recession deepened as GDP fell in the fourth-quarter by the most since 2009. Japan's economy also contracted in the final months of 2012 which prompted its central bank to maintain stimulus measures. On our shores, initial jobless claims fell the most in a month as applications dropped 27,000 to 341,000.
Energy was the best performing group. Halliburton Co (HAL +6.07%) and Schlumberger Ltd (SLB +3.73%) advanced. M&A activity helped consumer staples stage a rally. Constellation Brands (STZ +37.23%) after acquiring full control of U.S. distribution for Grupo Modelo's products. In addition, H.J. Heinz Co (HNZ +19.87%) shares were up after announcing it will be purchased by Berkshire Hathaway (BRKB +1.27%) and 3G Capital. Telecommunication shares fell amid a drop in CenturyLink Inc (CTL -22.6%) after the company cut its dividend by 26%.
In fixed-income, Treasuries were higher after a government auction of 30-year bonds saw solid demand. The 10-year note was up 16/32 to yield 2.00%.
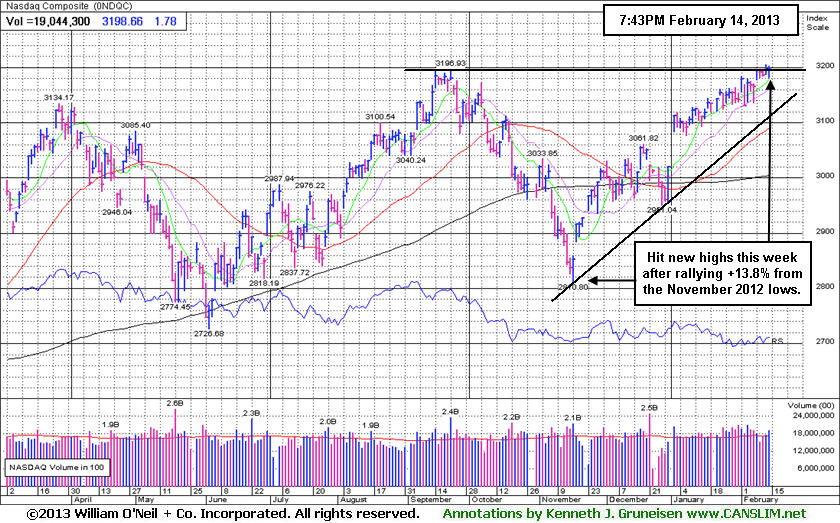
The latest rally has produced a few action worthy candidates meeting all of the fact-based investment system's criteria. Selectivity and discipline are required, as always. Investors may consider new buying efforts in stocks meeting all key criteria, as the market's (M criteria) confirmed uptrend has been comprised by great leadership (stocks hitting new 52-week highs) in the broader market. Widespread gains helped all of the major averages blast higher, and the benchmark S&P 500 Index is perched at its best level in more than five years and just off its October 2007 all-time high.
Watch for an announcement via email concerning the next WEBCAST. The webcast will also be available via an updated link highlighted at the top of the Premium Member Homepage.
PICTURED: The Nasdaq Composite Index reached new highs this week after rallying +16.8% from its November 2012 lows.
|
 Kenneth J. Gruneisen started out as a licensed stockbroker in August 1987, a couple of months prior to the historic stock market crash that took the Dow Jones Industrial Average down -22.6% in a single day. He has published daily fact-based fundamental and technical analysis on high-ranked stocks online for two decades. Through FACTBASEDINVESTING.COM, Kenneth provides educational articles, news, market commentary, and other information regarding proven investment systems that work in good times and bad.
Comments contained in the body of this report are technical opinions only and are not necessarily those of Gruneisen Growth Corp. The material herein has been obtained from sources believed to be reliable and accurate, however, its accuracy and completeness cannot be guaranteed. Our firm, employees, and customers may effect transactions, including transactions contrary to any recommendation herein, or have positions in the securities mentioned herein or options with respect thereto. Any recommendation contained in this report may not be suitable for all investors and it is not to be deemed an offer or solicitation on our part with respect to the purchase or sale of any securities. |
|
 |
Oil Services Index Posted Standout Gain; Bank Index Stands Near 2011 High
Kenneth J. Gruneisen - Passed the CAN SLIM® Master's Exam
The Oil Services Index ($OSX +3.11%) was a standout gainer as several energy-related firms spiked higher. There was a slight positive bias for the Bank Index ($BKX +0.16%) and the Broker/Dealer Index ($XBD +0.28%) while the Gold & Silver Index ($XAU +0.31%) also edged higher. The Internet Index ($IIX +1.15%) posted a better than +1% gain, followed by smaller gains from the Semiconductor Index ($SOX +0.84%) and Biotechnology Index ($BTK +0.48%), while the Networking Index ($NWX -0.14%) ended in the red with a small loss. The Integrated Oil Index ($XOI -0.07%), Retail Index ($RLX -0.06%), and the Healthcare Index ($HMO +0.01%) each finished virtually unchanged.
Charts courtesy www.stockcharts.com
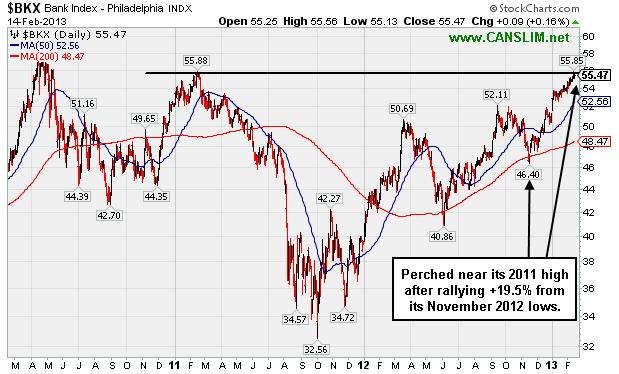
PICTURED: The 3-year graph of the Bank Index ($BKX +0.16%) shows it now perched near its 2011 high after a strong start for 2013. It rallied +19.5% from its November 2012 low.
| Oil Services |
$OSX |
255.88 |
+7.71 |
+3.11% |
+16.22% |
| Healthcare |
$HMO |
2,809.73 |
+0.35 |
+0.01% |
+11.76% |
| Integrated Oil |
$XOI |
1,352.72 |
-0.98 |
-0.07% |
+8.93% |
| Semiconductor |
$SOX |
431.08 |
+3.60 |
+0.84% |
+12.24% |
| Networking |
$NWX |
244.34 |
-0.34 |
-0.14% |
+7.85% |
| Internet |
$IIX |
361.95 |
+4.11 |
+1.15% |
+10.69% |
| Broker/Dealer |
$XBD |
108.91 |
+0.31 |
+0.28% |
+15.46% |
| Retail |
$RLX |
706.83 |
-0.43 |
-0.06% |
+8.23% |
| Gold & Silver |
$XAU |
148.82 |
+0.46 |
+0.31% |
-10.13% |
| Bank |
$BKX |
55.47 |
+0.09 |
+0.16% |
+8.17% |
| Biotech |
$BTK |
1,680.25 |
+8.09 |
+0.48% |
+8.61% |
|
|
|
 |
Finish Near Session Lows Indicated Distributional Pressure Before Earnings News
Kenneth J. Gruneisen - Passed the CAN SLIM® Master's Exam
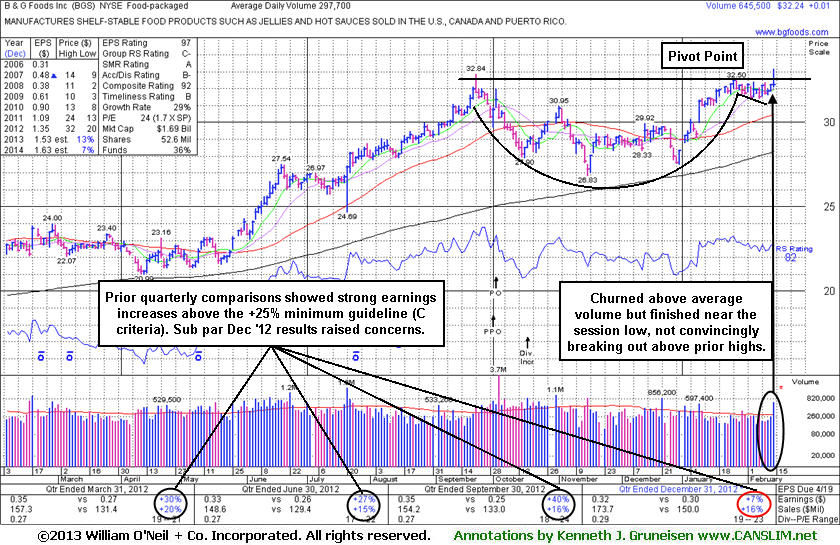
B & G Foods Inc (BGS +$0.01 or +0.03% to $32.24) was highlighted in yellow with pending earnings news in the earlier mid-day report (read here) with a pivot point based on its 1/28/13 high as members were cautioned -"Volume and volatility often increase near earnings news." It hit a new 52-week high with volume running at an above average pace, however it finished the session flat and near the lower extreme of its intra-day range, a sign it was encountering distributional pressure. No overhead supply remains to act as resistance, however, it did not have the look of aggressive accumulation and heavy institutional buying demand.
After the close it reported eaernings +7% on +16% sales revenues for the quarter ended December 31, 2013 versus the year ago period. That was well below the +25% minimum earnings guideline (C criteria) and it raises some concerns, fundamentally, for this leader in the "Food - Packaged" industry group. Prior to the sub par results, what made it a worthly candidate was the fact that the company had reported earnings increases above the +25% minimum guideline (C criteria) in the past 3 quarterly comparisons through Sep '12. It also has a good annual earnings (A criteria) history. The number of top-rated funds owning its shares reportedly rose from 259 in Sep '12 to 267 in Dec '12, a slightly reassuring indication for the I criteria.
With the latest developments, disciplined investors might sooner consider looking at another high-ranked leader without fundamental flaws. Even if bullish action may follow this latest news, members should keep in mind that the fact-based investment system's big winning models were usually companies that had a hot new product or service which was in demand - directly impacting sales and earnings comparisons. Investors can sometimes avoid getting bit with losses when the price/volume action does not indictate undeniable accumulation by the institutional crowd confirming that an entry makes sense and odds are most favorable.
|
|
|
Color Codes Explained :
Y - Better candidates highlighted by our
staff of experts.
G - Previously featured
in past reports as yellow but may no longer be buyable under the
guidelines.
***Last / Change / Volume data in this table is the closing quote data***
Symbol/Exchange
Company Name
Industry Group |
PRICE |
CHANGE
(%Change) |
Day High |
Volume
(% DAV)
(% 50 day avg vol) |
52 Wk Hi
% From Hi |
Featured
Date |
Price
Featured |
Pivot Featured |
|
Max Buy |
BGS
-
NYSE
B & G Foods Inc
FOOD andamp; BEVERAGE - Processed andamp; Packaged Goods
|
$32.24
|
+0.01
0.03% |
$33.14
|
657,263
220.78% of 50 DAV
50 DAV is 297,700
|
$32.84
-1.83%
|
2/14/2013
|
$32.82
|
PP = $32.50
|
|
MB = $34.13
|
 Most Recent Note - 2/14/2013 6:50:30 PM
Y - Finished near the session low and virtually unchanged after highlighted in yellow in the earlier mid-day report (read here) with pivot point cited based on its 1/28/13 high. Hit a new 52-week high and churned above average volume. Reported earnings +7% on +16% sales revenues for the Dec '12 quarter, below the +25% minimum guideline (C criteria) in the past 3 quarterly comparisons through Sep '12. It has a good annual earnings (A criteria) history. See the latest FSU analysis for more details and an annotated graph.
There are no Featured Stock Updates™ available for this stock at this time. You may request one by clicking the Request a New Note link below
View all notes |
Alert me of new notes |
CANSLIM.net Company Profile |
SEC |
Zacks Reports |
StockTalk |
News |
Chart |
Request a new note
C
A N
S L
I M


|
CELG
-
NASDAQ
Celgene Corp
DRUGS - Drug Manufacturers - Major
|
$99.51
|
+0.44
0.44% |
$100.20
|
2,414,140
64.44% of 50 DAV
50 DAV is 3,746,300
|
$102.29
-2.72%
|
12/11/2012
|
$82.24
|
PP = $81.34
|
|
MB = $85.41
|
Most Recent Note - 2/14/2013 7:02:13 PM
G - Volume totals have been cooling in recent weeks while it has stubbornly hovered near its all-time high, holding its ground. That price/volume action is an encouraging indication that few investors have been headed for the exit. Its 50 DMA line (now $89.92) defines important support to watch on pullbacks.
>>> The latest Featured Stock Update with an annotated graph appeared on 2/4/2013. Click here.
View all notes |
Alert me of new notes |
CANSLIM.net Company Profile |
SEC |
Zacks Reports |
StockTalk |
News |
Chart |
Request a new note
C
A N
S L
I M
|
CFNL
-
NASDAQ
Cardinal Financial Corp
BANKING - Regional - Southeast Banks
|
$16.45
|
-0.13
-0.78% |
$16.55
|
83,370
40.93% of 50 DAV
50 DAV is 203,700
|
$16.90
-2.66%
|
12/3/2012
|
$15.20
|
PP = $16.31
|
|
MB = $17.13
|
Most Recent Note - 2/12/2013 1:43:34 PM
Y - Rallying from its 50 DMA line with volume running at an above average pace behind today's considerable gain while trading within close striking distance of its best-ever close. Subsequent losses leading to a damaging 50 DMA line violation or a slump below the recent low ($15.74 on 1/18/13) would raise concerns and trigger technical sell signals.
>>> The latest Featured Stock Update with an annotated graph appeared on 1/31/2013. Click here.
View all notes |
Alert me of new notes |
CANSLIM.net Company Profile |
SEC |
Zacks Reports |
StockTalk |
News |
Chart |
Request a new note
C
A N
S L
I M
|
CMCSA
-
NASDAQ
Comcast Corp Cl A
MEDIA - CATV Systems
|
$40.34
|
+0.21
0.52% |
$40.68
|
21,814,841
166.25% of 50 DAV
50 DAV is 13,121,800
|
$42.00
-3.95%
|
12/3/2012
|
$37.08
|
PP = $38.06
|
|
MB = $39.96
|
Most Recent Note - 2/14/2013 12:15:56 PM
G - Reported earnings +11% on +6% sales revenues for the Dec '12 quarter, below the +25% minimum earnings guideline (C criteria), raising fundamental concerns. Trading up again today following a gap up on the prior session for a new 52-week high, despite sub par earnings results, after recently finding support near prior highs and at its 50 DMA line. Color code was changed to green as it rallied beyond its "max buy" level.
>>> The latest Featured Stock Update with an annotated graph appeared on 1/29/2013. Click here.
View all notes |
Alert me of new notes |
CANSLIM.net Company Profile |
SEC |
Zacks Reports |
StockTalk |
News |
Chart |
Request a new note
C
A N
S L
I M
|
KORS
-
NYSE
Michael Kors Hldgs Ltd
RETAIL - Apparel Stores
|
$61.67
|
+0.32
0.52% |
$62.84
|
5,751,014
137.51% of 50 DAV
50 DAV is 4,182,400
|
$64.80
-4.83%
|
1/23/2013
|
$54.98
|
PP = $58.72
|
|
MB = $61.66
|
Most Recent Note - 2/12/2013 12:33:10 PM
Y - Reported earnings +129% on +70% sales revenues for the Dec '12 quarter versus the year ago period. Today's considerable "breakaway gap" for a new high with heavy volume while blasting above the pivot point triggered a convincing technical buy signal. As previously noted - "A breakaway gap has been noted as the one exception which allows for new buying efforts more than +5% above prior highs, however risk increases the further one chases any stock above prior highs."
>>> The latest Featured Stock Update with an annotated graph appeared on 2/7/2013. Click here.
View all notes |
Alert me of new notes |
CANSLIM.net Company Profile |
SEC |
Zacks Reports |
StockTalk |
News |
Chart |
Request a new note
C
A N
S L
I M
|
Symbol/Exchange
Company Name
Industry Group |
PRICE |
CHANGE
(%Change) |
Day High |
Volume
(% DAV)
(% 50 day avg vol) |
52 Wk Hi
% From Hi |
Featured
Date |
Price
Featured |
Pivot Featured |
|
Max Buy |
LNKD
-
NYSE
Linkedin Corp Class A
INTERNET - Internet Information Providers
|
$161.34
|
+3.63
2.30% |
$161.77
|
2,758,404
134.37% of 50 DAV
50 DAV is 2,052,800
|
$158.90
1.53%
|
2/8/2013
|
$147.04
|
PP = $127.55
|
|
MB = $133.93
|
Most Recent Note - 2/14/2013 6:53:28 PM
G - Finished near the session high as it tallied another gain today with +34% above average volume while getting even more extended. Disciplined investors may watch for secondary buy points or additional bases to possibly form and be noted in the weeks ahead.
>>> The latest Featured Stock Update with an annotated graph appeared on 2/8/2013. Click here.
View all notes |
Alert me of new notes |
CANSLIM.net Company Profile |
SEC |
Zacks Reports |
StockTalk |
News |
Chart |
Request a new note
C
A N
S L
I M
|
MIDD
-
NASDAQ
Middleby Corp
MANUFACTURING - Diversified Machinery
|
$146.55
|
-2.64
-1.77% |
$151.45
|
160,140
174.83% of 50 DAV
50 DAV is 91,600
|
$151.49
-3.26%
|
10/8/2012
|
$118.46
|
PP = $122.67
|
|
MB = $128.80
|
Most Recent Note - 2/14/2013 6:55:15 PM
G - Retreated from its all-time high with above average volume behind its loss today. It has been repeatedly noted - "Extended from any sound base. Prior highs and its 50 DMA line define important near-term chart support in the $132-134 area."
>>> The latest Featured Stock Update with an annotated graph appeared on 1/30/2013. Click here.
View all notes |
Alert me of new notes |
CANSLIM.net Company Profile |
SEC |
Zacks Reports |
StockTalk |
News |
Chart |
Request a new note
C
A N
S L
I M
|
N
-
NYSE
Netsuite Inc
DIVERSIFIED SERVICES - Business/Management Services
|
$67.35
|
+0.97
1.46% |
$68.07
|
434,334
127.11% of 50 DAV
50 DAV is 341,700
|
$75.75
-11.09%
|
12/12/2012
|
$64.75
|
PP = $67.12
|
|
MB = $70.48
|
Most Recent Note - 2/12/2013 1:50:54 PM
G - Trading near its 50 DMA line ($66.17 now) today, where any more damaging losses may trigger a technical sell signal. Concerns were raised following a worrisome "negative reversal" on 2/01/13 after initially gapping up for a new 52-week high. Recent notes have repeatedly cautioned - "Reported earnings +20% on +33% sales revenues for the Dec '12 quarter, below the +25% minimum earnings guideline (C criteria) raising fundamental concerns."
>>> The latest Featured Stock Update with an annotated graph appeared on 2/5/2013. Click here.
View all notes |
Alert me of new notes |
CANSLIM.net Company Profile |
SEC |
Zacks Reports |
StockTalk |
News |
Chart |
Request a new note
C
A N
S L
I M
|
NP
-
NYSE
Neenah Paper Inc
CONSUMER NON-DURABLES - Paper and Paper Products
|
$29.12
|
-0.23
-0.78% |
$29.36
|
63,072
79.74% of 50 DAV
50 DAV is 79,100
|
$32.57
-10.59%
|
1/25/2013
|
$31.80
|
PP = $31.76
|
|
MB = $33.35
|
Most Recent Note - 2/13/2013 6:01:45 PM
G - Its Relative Strength rating has slumped to a 66, well below the 80+ minimum guideline for buy candidates under the fact-based investment system, and its color code was changed to green. See the latest FSU analysis for more details and a new annotated graph.
>>> The latest Featured Stock Update with an annotated graph appeared on 2/13/2013. Click here.
View all notes |
Alert me of new notes |
CANSLIM.net Company Profile |
SEC |
Zacks Reports |
StockTalk |
News |
Chart |
Request a new note
C
A N
S L
I M
|
NSR
-
NYSE
Neustar Inc
TELECOMMUNICATIONS - Diversified Communication Serv
|
$46.25
|
-0.33
-0.71% |
$46.57
|
328,188
74.81% of 50 DAV
50 DAV is 438,700
|
$47.24
-2.10%
|
12/11/2012
|
$41.85
|
PP = $41.41
|
|
MB = $43.48
|
Most Recent Note - 2/12/2013 1:55:41 PM
G - Hovering near its 52-week high, holding its ground stubbornly after getting extended from its prior base. Its 50 DMA line (now $43.11) defines near-term support above its prior base.
>>> The latest Featured Stock Update with an annotated graph appeared on 2/1/2013. Click here.
View all notes |
Alert me of new notes |
CANSLIM.net Company Profile |
SEC |
Zacks Reports |
StockTalk |
News |
Chart |
Request a new note
C
A N
S L
I M
|
Symbol/Exchange
Company Name
Industry Group |
PRICE |
CHANGE
(%Change) |
Day High |
Volume
(% DAV)
(% 50 day avg vol) |
52 Wk Hi
% From Hi |
Featured
Date |
Price
Featured |
Pivot Featured |
|
Max Buy |
RNF
-
NYSE
Rentech Nitrogen Ptnr Lp
CHEMICALS - Agricultural Chemicals
|
$43.96
|
+0.82
1.90% |
$44.56
|
493,529
136.37% of 50 DAV
50 DAV is 361,900
|
$49.18
-10.61%
|
11/1/2012
|
$39.11
|
PP = $40.15
|
|
MB = $42.16
|
Most Recent Note - 2/13/2013 2:44:12 PM
G - Rebounding above its 50 DMA line today, a prompt and encouraging sign of support near that important short-term average and prior highs in the $41 area. Subsequent damaging losses below the prior session's low ($40.95) would raise more serious concerns and trigger additional worrisome technical sell signals. See the latest FSU analysis for more details and a new annotated graph.
>>> The latest Featured Stock Update with an annotated graph appeared on 2/12/2013. Click here.
View all notes |
Alert me of new notes |
CANSLIM.net Company Profile |
SEC |
Zacks Reports |
StockTalk |
News |
Chart |
Request a new note
C
A N
S L
I M
|
SFUN
-
NYSE
Soufun Hldgs Ltd Ads A
INTERNET - Internet Information Providers
|
$27.61
|
+0.36
1.32% |
$27.76
|
155,146
50.03% of 50 DAV
50 DAV is 310,100
|
$29.16
-5.32%
|
2/11/2013
|
$27.46
|
PP = $29.26
|
|
MB = $30.72
|
Most Recent Note - 2/14/2013 7:08:20 PM
Y - It has been inching higher with light volume, not yet rallying beyond the pivot point cited based on its 1/08/13 high plus 10 cents. Disciplined investors may watch for subsequent volume-driven gains to confirm a proper technical buy signal.
>>> The latest Featured Stock Update with an annotated graph appeared on 2/11/2013. Click here.
View all notes |
Alert me of new notes |
CANSLIM.net Company Profile |
SEC |
Zacks Reports |
StockTalk |
News |
Chart |
Request a new note
C
A N
S L
I M
|
VRX
-
NYSE
Valeant Pharmaceuticals
DRUGS - Drug Manufacturers - Other
|
$66.39
|
-1.11
-1.64% |
$67.48
|
1,223,885
84.99% of 50 DAV
50 DAV is 1,440,100
|
$67.98
-2.34%
|
12/20/2012
|
$60.24
|
PP = $61.21
|
|
MB = $64.27
|
Most Recent Note - 2/14/2013 7:05:48 PM
G - Retreating from its 52-week high with higher but below average volume behind today's loss. An upward trendline connecting its November - December lows defines initial chart support to watch above its 50 DMA line (now $62.66).
>>> The latest Featured Stock Update with an annotated graph appeared on 1/28/2013. Click here.
View all notes |
Alert me of new notes |
CANSLIM.net Company Profile |
SEC |
Zacks Reports |
StockTalk |
News |
Chart |
Request a new note
C
A N
S L
I M
|
|
|
|
THESE ARE NOT BUY RECOMMENDATIONS!
Comments contained in the body of this report are technical
opinions only. The material herein has been obtained
from sources believed to be reliable and accurate, however,
its accuracy and completeness cannot be guaranteed.
This site is not an investment advisor, hence it does
not endorse or recommend any securities or other investments.
Any recommendation contained in this report may not
be suitable for all investors and it is not to be deemed
an offer or solicitation on our part with respect to
the purchase or sale of any securities. All trademarks,
service marks and trade names appearing in this report
are the property of their respective owners, and are
likewise used for identification purposes only.
This report is a service available
only to active Paid Premium Members.
You may opt-out of receiving report notifications
at any time. Questions or comments may be submitted
by writing to Premium Membership Services 665 S.E. 10 Street, Suite 201 Deerfield Beach, FL 33441-5634 or by calling 1-800-965-8307
or 954-785-1121.
|
|
|

