***Last / Change / Volume data in this table is the closing quote data***
Symbol/Exchange
Company Name
Industry Group |
PRICE |
CHANGE
(%Change) |
Day High |
Volume
(% DAV)
(% 50 day avg vol) |
52 Wk Hi
% From Hi |
Featured
Date |
Price
Featured |
Pivot Featured |
|
Max Buy |
BIDU
-
NASDAQ
Baidu Inc Ads
INTERNET - Internet Information Providers
|
$128.81
|
-0.77
-0.59% |
$131.63
|
7,886,489
102.60% of 50 DAV
50 DAV is 7,686,600
|
$129.65
-0.65%
|
2/1/2011
|
$117.74
|
PP = $112.08
|
|
MB = $117.68
|
Most Recent Note - 2/11/2011 5:36:29 PM
G - Hit another new all-time high with today's 5th consecutive gain on average volume. Prior highs in the $112-115 area define initial chart support to watch now.
>>> The latest Featured Stock Update with an annotated graph appeared on 2/2/2011. Click here.
View all notes |
Alert me of new notes |
CANSLIM.net Company Profile |
SEC |
Zacks Reports |
StockTalk |
News |
Chart |
Request a new note
C
A N
S L
I M


|
CMG
-
NYSE
Chipotle Mexican Grill
LEISURE - Restaurants
|
$272.95
|
+4.22
1.57% |
$275.00
|
1,430,201
147.73% of 50 DAV
50 DAV is 968,100
|
$274.85
-0.69%
|
2/11/2011
|
$271.15
|
PP = $262.87
|
|
MB = $276.01
|
 Most Recent Note - 2/14/2011 5:42:18 PM
Y - Gain today with above average volume for another new high close. Considerable gain backed by heavy volume last week came after reporting strong earnings, and technically it rallied "straight up from the bottom" and broke out of an 11-week cup shaped base without a handle.
>>> The latest Featured Stock Update with an annotated graph appeared on 2/11/2011. Click here.
View all notes |
Alert me of new notes |
CANSLIM.net Company Profile |
SEC |
Zacks Reports |
StockTalk |
News |
Chart |
Request a new note
C
A N
S L
I M
|
CRUS
-
NASDAQ
Cirrus Logic Inc
ELECTRONICS - Semiconductor - Specialized
|
$24.95
|
+0.69
2.84% |
$25.13
|
3,416,589
102.48% of 50 DAV
50 DAV is 3,333,900
|
$25.15
-0.80%
|
1/28/2011
|
$20.69
|
PP = $19.17
|
|
MB = $20.13
|
Most Recent Note - 2/14/2011 2:42:21 PM
G - Perched near its 52-week high, holding its ground stubbornly after volume-driven gains. Extended from its latest sound base pattern, meanwhile patience may allow for secondary buy points to develop. Prior highs define chart support levels to watch on pullbacks.
>>> The latest Featured Stock Update with an annotated graph appeared on 1/28/2011. Click here.
View all notes |
Alert me of new notes |
CANSLIM.net Company Profile |
SEC |
Zacks Reports |
StockTalk |
News |
Chart |
Request a new note
C
A N
S L
I M
|
CTSH
-
NASDAQ
Cognizant Tech Sol Cl A
COMPUTER SOFTWARE and SERVICES - Business Software and Services
|
$76.38
|
+0.88
1.17% |
$76.40
|
1,593,938
70.11% of 50 DAV
50 DAV is 2,273,400
|
$77.08
-0.91%
|
2/7/2011
|
$75.09
|
PP = $76.46
|
|
MB = $80.28
|
Most Recent Note - 2/11/2011 5:03:44 PM
Y - Consolidating above its 50 DMA line, it faces no resistance due to overhead supply after closing today's session -2% off its 52-week high. See the latest FSU analysis for details and a new annotated graph.
>>> The latest Featured Stock Update with an annotated graph appeared on 2/8/2011. Click here.
View all notes |
Alert me of new notes |
CANSLIM.net Company Profile |
SEC |
Zacks Reports |
StockTalk |
News |
Chart |
Request a new note
C
A N
S L
I M
|
DECK
-
NASDAQ
Deckers Outdoor Corp
CONSUMER NON-DURABLES - Textile - Apparel Footwear
|
$86.47
|
+0.42
0.49% |
$87.55
|
878,269
48.51% of 50 DAV
50 DAV is 1,810,500
|
$87.88
-1.60%
|
2/3/2011
|
$79.61
|
PP = $82.67
|
|
MB = $86.80
|
Most Recent Note - 2/11/2011 5:07:40 PM
Y - Today's 9th consecutive gain with below average volume helped it rise near its "max buy" level for its 3rd highest close ever. No gains above the new pivot point came with at least +50% above average volume necessary to technically trigger a proper new (or add-on) buy signal.
>>> The latest Featured Stock Update with an annotated graph appeared on 1/26/2011. Click here.
View all notes |
Alert me of new notes |
CANSLIM.net Company Profile |
SEC |
Zacks Reports |
StockTalk |
News |
Chart |
Request a new note
C
A N
S L
I M
|
Symbol/Exchange
Company Name
Industry Group |
PRICE |
CHANGE
(%Change) |
Day High |
Volume
(% DAV)
(% 50 day avg vol) |
52 Wk Hi
% From Hi |
Featured
Date |
Price
Featured |
Pivot Featured |
|
Max Buy |
EZCH
-
NASDAQ
Ezchip Semiconductor Ltd
ELECTRONICS - Semiconductor - Specialized
|
$30.61
|
+0.61
2.03% |
$30.88
|
753,377
200.90% of 50 DAV
50 DAV is 375,000
|
$33.48
-8.57%
|
12/2/2010
|
$27.53
|
PP = $26.00
|
|
MB = $27.30
|
Most Recent Note - 2/14/2011 3:21:00 PM
G - Today's gain with above average volume is indicative of support near its 50 DMA line. On 2/10/11 it reported earnings +41% on +33% sales revenues for the quarter ended December 31, 2010, and gapped down undercutting its 50 DMA line and prior chart highs in the $29 area then rebounded to close well above both. As previously noted - "Volume and volatility often increase near corporate earnings news."
>>> The latest Featured Stock Update with an annotated graph appeared on 1/21/2011. Click here.
View all notes |
Alert me of new notes |
CANSLIM.net Company Profile |
SEC |
Zacks Reports |
StockTalk |
News |
Chart |
Request a new note
C
A N
S L
I M
|
EZPW
-
NASDAQ
Ezcorp Inc Cl A
SPECIALTY RETAIL - Specialty Retail, Other
|
$28.13
|
+0.16
0.57% |
$28.48
|
266,079
64.58% of 50 DAV
50 DAV is 412,000
|
$29.94
-6.05%
|
11/5/2010
|
$24.02
|
PP = $23.85
|
|
MB = $25.04
|
Most Recent Note - 2/11/2011 5:12:12 PM
G - Small gain today helped it end the quiet week above its 50 DMA line again, showing resilience. It is not near any sound base, and its recent low ($25.56 on 1/25/11) defines an important support level now. Volume totals have been cooling while consolidating in recent weeks near its short-term average.
>>> The latest Featured Stock Update with an annotated graph appeared on 2/3/2011. Click here.
View all notes |
Alert me of new notes |
CANSLIM.net Company Profile |
SEC |
Zacks Reports |
StockTalk |
News |
Chart |
Request a new note
C
A N
S L
I M
|
FOSL
-
NASDAQ
Fossil Inc
CONSUMER DURABLES - Recreational Goods, Other
|
$83.51
|
+0.72
0.87% |
$83.67
|
1,564,654
230.33% of 50 DAV
50 DAV is 679,300
|
$83.40
0.13%
|
2/1/2011
|
$73.30
|
PP = $74.44
|
|
MB = $78.16
|
Most Recent Note - 2/14/2011 5:34:37 PM
G - Finished near the session high with above average volume driving it to another new 52-week high while rallying for its 8th consecutive gain. It is extended from any sound base pattern. Prior resistance in the $74 area defines initial chart support above its 50 DMA line.
>>> The latest Featured Stock Update with an annotated graph appeared on 1/12/2011. Click here.
View all notes |
Alert me of new notes |
CANSLIM.net Company Profile |
SEC |
Zacks Reports |
StockTalk |
News |
Chart |
Request a new note
C
A N
S L
I M
|
HMSY
-
NASDAQ
H M S Holdings Corp
COMPUTER SOFTWARE and SERVICES - Healthcare Information Service
|
$68.97
|
+1.22
1.80% |
$69.06
|
98,663
69.04% of 50 DAV
50 DAV is 142,900
|
$69.06
-0.13%
|
11/19/2010
|
$61.89
|
PP = $63.01
|
|
MB = $66.16
|
Most Recent Note - 2/14/2011 5:35:38 PM
G - Hit yet another new 52-week high with today's 10th consecutive gain with light volume since it found support at its 50 DMA line. It quietly rose from an orderly base-on-base type pattern. Waning Relative Strength rank (now 72) has been noted as a concern.
>>> The latest Featured Stock Update with an annotated graph appeared on 1/3/2011. Click here.
View all notes |
Alert me of new notes |
CANSLIM.net Company Profile |
SEC |
Zacks Reports |
StockTalk |
News |
Chart |
Request a new note
C
A N
S L
I M
|
JOBS
-
NASDAQ
Fifty One Job Inc Ads
DIVERSIFIED SERVICES - Staffing and; Outsourcing Service
|
$59.74
|
+1.91
3.30% |
$60.88
|
85,533
61.14% of 50 DAV
50 DAV is 139,900
|
$61.28
-2.51%
|
2/7/2011
|
$59.23
|
PP = $61.38
|
|
MB = $64.45
|
Most Recent Note - 2/14/2011 3:15:58 PM
Y - Gapped up today, challenging its 52-week high. Its 50 DMA line and recent low ($52.58 on 1/28/11) define important support where violations would raise concerns and trigger technical sell signals. After a long ascending base pattern, subsequent volume-driven gains above its pivot point may trigger a new (or add-on) technical buy signal.
>>> The latest Featured Stock Update with an annotated graph appeared on 2/7/2011. Click here.
View all notes |
Alert me of new notes |
CANSLIM.net Company Profile |
SEC |
Zacks Reports |
StockTalk |
News |
Chart |
Request a new note
C
A N
S L
I M
|
Symbol/Exchange
Company Name
Industry Group |
PRICE |
CHANGE
(%Change) |
Day High |
Volume
(% DAV)
(% 50 day avg vol) |
52 Wk Hi
% From Hi |
Featured
Date |
Price
Featured |
Pivot Featured |
|
Max Buy |
LULU
-
NASDAQ
Lululemon Athletica
MANUFACTURING - Textile Manufacturing
|
$83.70
|
-0.61
-0.72% |
$84.79
|
1,664,500
72.41% of 50 DAV
50 DAV is 2,298,600
|
$85.28
-1.85%
|
1/26/2011
|
$68.11
|
PP = $74.70
|
|
MB = $78.44
|
Most Recent Note - 2/11/2011 10:08:43 AM
G - Up today for another new 52-week high, extended from its latest sound base after 7 consecutive gains. Prior highs near $74 that acted as resistance define chart support to watch now.
>>> The latest Featured Stock Update with an annotated graph appeared on 1/14/2011. Click here.
View all notes |
Alert me of new notes |
CANSLIM.net Company Profile |
SEC |
Zacks Reports |
StockTalk |
News |
Chart |
Request a new note
C
A N
S L
I M
|
MWIV
-
NASDAQ
M W I Veterinary Supply
HEALTH SERVICES - Medical Instruments and; Supplies
|
$70.61
|
+1.28
1.85% |
$70.94
|
60,851
99.59% of 50 DAV
50 DAV is 61,100
|
$69.77
1.20%
|
11/4/2010
|
$61.79
|
PP = $59.60
|
|
MB = $62.58
|
Most Recent Note - 2/11/2011 10:12:56 AM
G - Quietly perched at its all-time high, however it has not built a sound new base pattern. It found support near its 50 DMA line recently. Sales revenues acceleration (bigger percentage increases sequentially) is a very reassuring sign.
>>> The latest Featured Stock Update with an annotated graph appeared on 2/2/2011. Click here.
View all notes |
Alert me of new notes |
CANSLIM.net Company Profile |
SEC |
Zacks Reports |
StockTalk |
News |
Chart |
Request a new note
C
A N
S L
I M
|
NFLX
-
NASDAQ
Netflix Inc
SPECIALTY RETAIL - Music and Video Stores
|
$247.55
|
+16.48
7.13% |
$247.55
|
11,201,274
198.52% of 50 DAV
50 DAV is 5,642,400
|
$231.60
6.89%
|
1/10/2011
|
$187.88
|
PP = $209.34
|
|
MB = $219.81
|
Most Recent Note - 2/14/2011 1:06:56 PM
G - Considerable gain today with above average volume for yet another new all-time high. It is extended from a sound base, and prior high ($209) defines support to watch above its 50 DMA line.
>>> The latest Featured Stock Update with an annotated graph appeared on 1/10/2011. Click here.
View all notes |
Alert me of new notes |
CANSLIM.net Company Profile |
SEC |
Zacks Reports |
StockTalk |
News |
Chart |
Request a new note
C
A N
S L
I M
|
NTAP
-
NASDAQ
Netapp Inc
COMPUTER HARDWARE - Data Storage Devices
|
$59.62
|
-0.98
-1.62% |
$60.70
|
4,159,591
93.68% of 50 DAV
50 DAV is 4,440,000
|
$61.02
-2.29%
|
1/6/2011
|
$57.49
|
PP = $58.06
|
|
MB = $60.96
|
Most Recent Note - 2/14/2011 2:54:51 PM
G - Perched at its 52-week high today after 6 consecutive gains with volume light or near average while rising from support near its 50 DMA line. It has not formed any recent sound base pattern.
>>> The latest Featured Stock Update with an annotated graph appeared on 2/4/2011. Click here.
View all notes |
Alert me of new notes |
CANSLIM.net Company Profile |
SEC |
Zacks Reports |
StockTalk |
News |
Chart |
Request a new note
C
A N
S L
I M
|
OPEN
-
NASDAQ
Opentable Inc
INTERNET - Internet Software and Services
|
$93.58
|
-1.37
-1.44% |
$95.97
|
1,079,137
124.42% of 50 DAV
50 DAV is 867,300
|
$95.49
-2.00%
|
1/5/2011
|
$74.05
|
PP = $76.79
|
|
MB = $80.63
|
Most Recent Note - 2/11/2011 1:18:45 PM
G - Rallying on heavy volume today for a 7th consecutive gain and another new all-time high, extended from a sound base pattern. Reported earnings +114% on +61% sales revenues for the quarter ended December 31, 2010 versus the year-ago period. Its 50 DMA line defines near-term chart support.
>>> The latest Featured Stock Update with an annotated graph appeared on 1/5/2011. Click here.
View all notes |
Alert me of new notes |
CANSLIM.net Company Profile |
SEC |
Zacks Reports |
StockTalk |
News |
Chart |
Request a new note
C
A N
S L
I M
|
Symbol/Exchange
Company Name
Industry Group |
PRICE |
CHANGE
(%Change) |
Day High |
Volume
(% DAV)
(% 50 day avg vol) |
52 Wk Hi
% From Hi |
Featured
Date |
Price
Featured |
Pivot Featured |
|
Max Buy |
ORCL
-
NASDAQ
Oracle Corp
COMPUTER SOFTWARE and SERVICES - Application Software
|
$33.29
|
-0.18
-0.54% |
$33.55
|
16,433,436
60.44% of 50 DAV
50 DAV is 27,188,300
|
$33.59
-0.89%
|
1/20/2011
|
$32.31
|
PP = $32.37
|
|
MB = $33.99
|
Most Recent Note - 2/14/2011 2:49:04 PM
Y - Volume totals have been cooling while hovering near its 52-week high, below its "max buy" level. Near-term support to watch is its 50 DMA line.
>>> The latest Featured Stock Update with an annotated graph appeared on 1/7/2011. Click here.
View all notes |
Alert me of new notes |
CANSLIM.net Company Profile |
SEC |
Zacks Reports |
StockTalk |
News |
Chart |
Request a new note
C
A N
S L
I M
|
PAY
-
NYSE
Verifone Systems Inc
COMPUTER HARDWARE - Transaction Automation Systems
|
$48.18
|
+3.16
7.02% |
$49.07
|
4,515,736
300.87% of 50 DAV
50 DAV is 1,500,900
|
$45.12
6.78%
|
1/27/2011
|
$41.77
|
PP = $44.97
|
|
MB = $47.22
|
Most Recent Note - 2/14/2011 1:15:46 PM
G - Considerable gain today with above average volume for a new 52-week high, technically triggering a new (or add-on) technical buy signal, yet quickly getting extended beyond its "max buy" level. Color code is changed to green.
>>> The latest Featured Stock Update with an annotated graph appeared on 1/27/2011. Click here.
View all notes |
Alert me of new notes |
CANSLIM.net Company Profile |
SEC |
Zacks Reports |
StockTalk |
News |
Chart |
Request a new note
C
A N
S L
I M
|
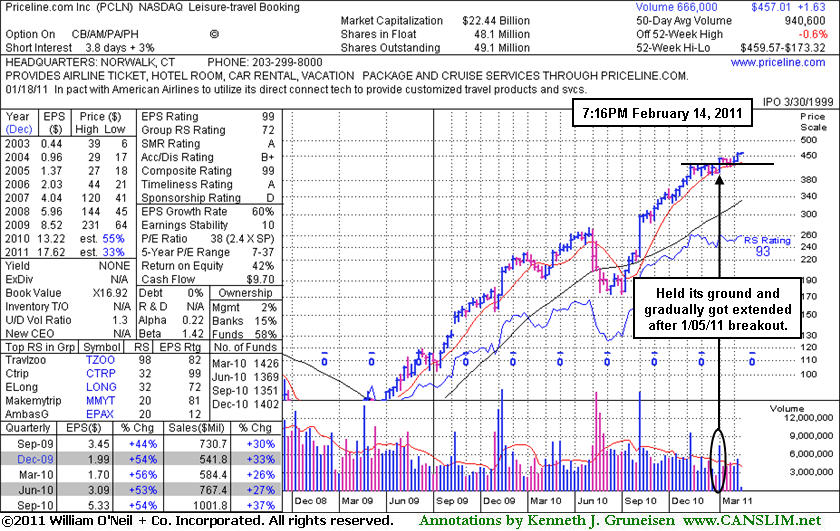
PCLN
-
NASDAQ
Priceline.Com Inc
INTERNET - Internet Software and Services
|
$457.01
|
+1.63
0.36% |
$459.57
|
666,856
71.11% of 50 DAV
50 DAV is 937,800
|
$459.10
-0.46%
|
1/3/2011
|
$399.55
|
PP = $428.20
|
|
MB = $449.61
|
Most Recent Note - 2/11/2011 5:34:18 PM
G - Color code was changed to green after rising above its "max buy" level this week. Prior highs and its 50 DMA line define support to watch.
>>> The latest Featured Stock Update with an annotated graph appeared on 1/2/2011. Click here.
View all notes |
Alert me of new notes |
CANSLIM.net Company Profile |
SEC |
Zacks Reports |
StockTalk |
News |
Chart |
Request a new note
C
A N
S L
I M
|
RAX
-
NYSE
Rackspace Hosting Inc
INTERNET - Internet Software and; Services
|
$39.30
|
-0.77
-1.92% |
$40.00
|
2,377,401
134.26% of 50 DAV
50 DAV is 1,770,700
|
$40.62
-3.25%
|
1/10/2011
|
$22.84
|
PP = $32.76
|
|
MB = $34.40
|
Most Recent Note - 2/14/2011 3:18:02 PM
G - Pulling back today after a considerable gap up on 2/11/11 for a considerable gain on heavy volume after reporting earnings +29% on +27% sales revenues for the quarter ended December 31, 2010 versus the year ago period. It is extended from any sound base. Recent highs near $35 define support to watch above its 50 DMA line.
>>> The latest Featured Stock Update with an annotated graph appeared on 2/9/2011. Click here.
View all notes |
Alert me of new notes |
CANSLIM.net Company Profile |
SEC |
Zacks Reports |
StockTalk |
News |
Chart |
Request a new note
C
A N
S L
I M
|
ROVI
-
NASDAQ
Rovi Corp
COMPUTER SOFTWARE andamp; SERVICES - Security Software andamp; Services
|
$65.52
|
+1.06
1.64% |
$66.27
|
2,238,362
132.68% of 50 DAV
50 DAV is 1,687,100
|
$69.50
-5.73%
|
10/29/2010
|
$49.99
|
PP = $53.10
|
|
MB = $55.76
|
Most Recent Note - 2/14/2011 2:45:07 PM
G - Small gap up gain backed by higher volume today. Its 50 DMA line and the 1/31/11 low ($60.15) define near-term chart support levels to watch.
>>> The latest Featured Stock Update with an annotated graph appeared on 1/25/2011. Click here.
View all notes |
Alert me of new notes |
CANSLIM.net Company Profile |
SEC |
Zacks Reports |
StockTalk |
News |
Chart |
Request a new note
C
A N
S L
I M
|
Symbol/Exchange
Company Name
Industry Group |
PRICE |
CHANGE
(%Change) |
Day High |
Volume
(% DAV)
(% 50 day avg vol) |
52 Wk Hi
% From Hi |
Featured
Date |
Price
Featured |
Pivot Featured |
|
Max Buy |
TIBX
-
NASDAQ
Tibco Software Inc
COMPUTER SOFTWARE and SERVICES - Business Software and Services
|
$25.57
|
+0.26
1.03% |
$25.70
|
1,072,048
38.41% of 50 DAV
50 DAV is 2,791,000
|
$25.49
0.31%
|
2/1/2011
|
$24.35
|
PP = $22.18
|
|
MB = $23.29
|
Most Recent Note - 2/14/2011 2:46:09 PM
G - Inched to another new 52-week high today with a gain on lighter volume. Extended from its latest sound base, its prior highs in the $22 area define support. See the latest FSU analysis for details and a new annotated graph.
>>> The latest Featured Stock Update with an annotated graph appeared on 2/10/2011. Click here.
View all notes |
Alert me of new notes |
CANSLIM.net Company Profile |
SEC |
Zacks Reports |
StockTalk |
News |
Chart |
Request a new note
C
A N
S L
I M
|
UA
-
NYSE
Under Armour Inc Cl A
CONSUMER NON-DURABLES - Textile - Apparel Clothing
|
$68.96
|
-0.85
-1.22% |
$70.43
|
843,922
108.52% of 50 DAV
50 DAV is 777,700
|
$69.97
-1.44%
|
1/27/2011
|
$58.31
|
PP = $56.99
|
|
MB = $59.84
|
Most Recent Note - 2/10/2011 4:44:22 PM
G - Hit another new 52-week high with a solid gain on above average volume today. Prior resistance in the $60 area defines initial support to watch above its 50 DMA line.
>>> The latest Featured Stock Update with an annotated graph appeared on 2/1/2011. Click here.
View all notes |
Alert me of new notes |
CANSLIM.net Company Profile |
SEC |
Zacks Reports |
StockTalk |
News |
Chart |
Request a new note
C
A N
S L
I M
|
ULTA
-
NASDAQ
Ulta Salon Cosm & Frag
SPECIALTY RETAIL - Specialty Retail, Other
|
$42.99
|
+0.40
0.94% |
$43.83
|
359,154
57.93% of 50 DAV
50 DAV is 620,000
|
$42.63
0.84%
|
1/6/2011
|
$36.12
|
PP = $37.34
|
|
MB = $39.21
|
Most Recent Note - 2/11/2011 10:19:27 AM
G - Near its 52-week high today, posting its 7th consecutive small gain. It is extended from a sound base pattern, and prior highs in the $37-38 area define chart support to watch above its 50 DMA line.
>>> The latest Featured Stock Update with an annotated graph appeared on 1/6/2011. Click here.
View all notes |
Alert me of new notes |
CANSLIM.net Company Profile |
SEC |
Zacks Reports |
StockTalk |
News |
Chart |
Request a new note
C
A N
S L
I M
|