You are not logged in.
This means you
CAN ONLY VIEW reports that were published prior to Sunday, February 25, 2024.
You
MUST UPGRADE YOUR MEMBERSHIP if you want to see any current reports.
AFTER MARKET UPDATE - THURSDAY, FEBRUARY 13TH, 2020
Previous After Market Report Next After Market Report >>>
|
|
|
|
DOW |
-128.11 |
29,423.31 |
-0.43% |
|
Volume |
816,646,980 |
-12% |
|
Volume |
2,246,334,820 |
-5% |
|
NASDAQ |
-13.99 |
9,711.97 |
-0.14% |
|
Advancers |
1,427 |
50% |
|
Advancers |
1,676 |
52% |
|
S&P 500 |
-5.51 |
3,373.94 |
-0.16% |
|
Decliners |
1,450 |
50% |
|
Decliners |
1,537 |
48% |
|
Russell 2000 |
+4.36 |
1,693.74 |
+0.26% |
|
52 Wk Highs |
220 |
|
|
52 Wk Highs |
222 |
|
|
S&P 600 |
+3.75 |
1,023.47 |
+0.37% |
|
52 Wk Lows |
46 |
|
|
52 Wk Lows |
49 |
|
|
 |
Major Indices Pause at Record Highs
Kenneth J. Gruneisen - Passed the CAN SLIM® Master's Exam
The Dow fell 128 points, while the S&P 500 and the Nasdaq Composite reversed earlier session gains to end 0.2% and 0.1% lower, respectively. Advancers and decliners were evenly mixed on the NYSE and on the Nasdaq exchange. The reported volume totals were lighter than the prior session totals on the NYSE and on the Nasdaq exchange. Leadership remained strong as there were 99 high-ranked companies from the Leaders List that hit a new 52-week high and were listed on the BreakOuts Page, versus 98 on the prior session. New 52-week highs totals again solidly outnumbered new 52-week lows on the NYSE and on the Nasdaq exchange. The major indices' (M criteria) remain in a confirmed uptrend. Disciplined investors buy individual stocks on a case-by-case basis only if all key criteria are met. The Featured Stocks Page provides the most timely analysis on high-ranked leaders. Charts used courtesy of www.stockcharts.com
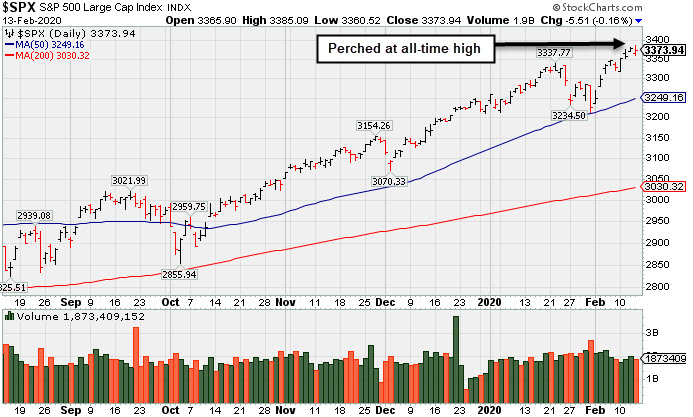
PICTURED: The S&P 500 Index is perched at its all-time high.
Stocks slipped from record highs Thursday as investors assessed a spike in reported coronavirus cases. The World Health Organization noted the sharp jump in confirmed cases in China’s Hubei province included cases from prior days and weeks, and had been largely attributed to a revised method of diagnosis.
Seven of 11 S&P 500 sectors ended in negative territory, with the Industrial group leading laggards. In earnings, Cisco (CSCO -5.23%) fell after providing disappointing forward guidance. Kraft Heinz (KHZ -7.56%) sank after the company revealed sales declined in the latest quarter. Applied Materials (AMAT +3.06%) rose after offering a positive first-quarter forecast. In other corporate news, Microsoft (MSFT -0.54%) fell after the a federal judge granted Amazon’s (AMZN -0.47%) request to temporarily block the Tech giant’s $10 billion clouding computing contract with the Pentagon.
Treasuries were slightly higher, with the yield on the 10-year note down two basis points to 1.61%. On the data front, an update showed consumer prices rose 0.1% last month, slightly below the prior figure and forecasts of a 0.2% uptick. Core CPI (excluding volatile components food and energy) advanced 2.3% year-over-year in January, climbing by the same pace for the fourth straight month.
In commodities, WTI crude rose 0.8% to $51.57/barrel despite the International Energy Agency forecasting that global oil consumption for the current quarter will decline for the first time in more than a decade. COMEX gold added 0.5% to $1,575.10/ounce. |
 Kenneth J. Gruneisen started out as a licensed stockbroker in August 1987, a couple of months prior to the historic stock market crash that took the Dow Jones Industrial Average down -22.6% in a single day. He has published daily fact-based fundamental and technical analysis on high-ranked stocks online for two decades. Through FACTBASEDINVESTING.COM, Kenneth provides educational articles, news, market commentary, and other information regarding proven investment systems that work in good times and bad.
Comments contained in the body of this report are technical opinions only and are not necessarily those of Gruneisen Growth Corp. The material herein has been obtained from sources believed to be reliable and accurate, however, its accuracy and completeness cannot be guaranteed. Our firm, employees, and customers may effect transactions, including transactions contrary to any recommendation herein, or have positions in the securities mentioned herein or options with respect thereto. Any recommendation contained in this report may not be suitable for all investors and it is not to be deemed an offer or solicitation on our part with respect to the purchase or sale of any securities. |
|
 |
Gold & Silver Index Posted Standout Gain
Kenneth J. Gruneisen - Passed the CAN SLIM® Master's Exam
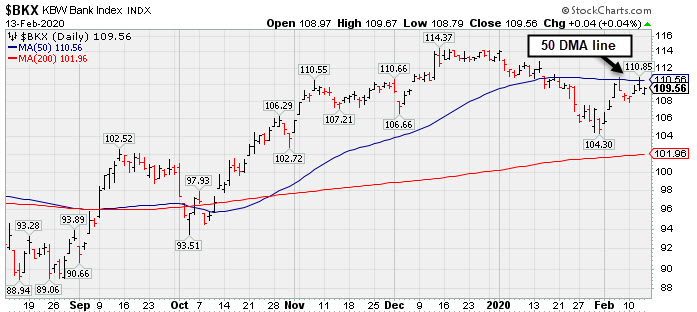
The Bank Index ($BKX +0.04%) Broker/Dealer Index ($XBD -0.33%) and Retail Index ($RLX -0.18%) sputtered. The Biotech Index ($BTK -0.47%) and the Networking Index ($NWX -0.36%) both edged lower while the Semiconductor Index ($SOX +0.08%) held its ground. Energy-linked groups had a negative bias as the Oil Services Index ($OSX -1.08%) and Integrated Oil Index ($XOI -0.71%) both fell. The Gold & Silver Index ($XAU +0.99%) was standout gainer as it ended the session higher.
PICTURED: The Bank Index ($BKX +0.04%) has been sputtering below its 50-day moving average (DMA) line.
| Oil Services |
$OSX |
64.69 |
-0.71 |
-1.09% |
-17.37% |
| Integrated Oil |
$XOI |
1,131.22 |
-8.06 |
-0.71% |
-10.97% |
| Semiconductor |
$SOX |
1,960.34 |
+1.52 |
+0.08% |
+5.99% |
| Networking |
$NWX |
571.06 |
-2.05 |
-0.36% |
-2.12% |
| Broker/Dealer |
$XBD |
302.97 |
-1.00 |
-0.33% |
+4.34% |
| Retail |
$RLX |
2,666.25 |
-4.89 |
-0.18% |
+8.86% |
| Gold & Silver |
$XAU |
103.14 |
+1.02 |
+1.00% |
-3.54% |
| Bank |
$BKX |
109.56 |
+0.05 |
+0.05% |
-3.35% |
| Biotech |
$BTK |
5,232.06 |
-24.68 |
-0.47% |
+3.25% |
|
|
|
 |
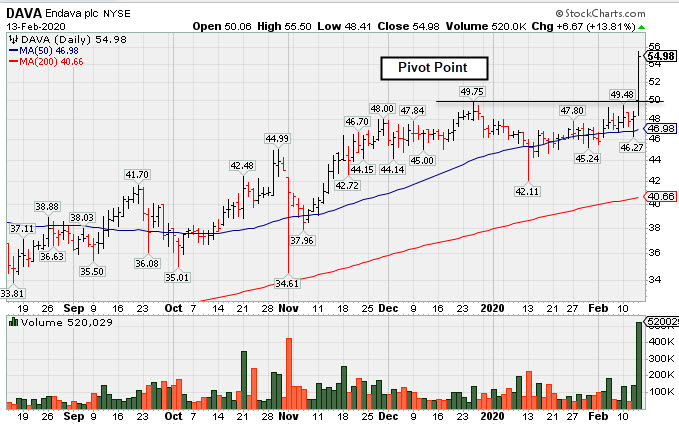
Breakout Gain Backed By +462% Above Average Volme
Kenneth J. Gruneisen - Passed the CAN SLIM® Master's Exam
Endava Plc Cl A Ads (DAVA +6.67 or +13.81% to $54.98) was highlighted in yellow with a new pivot point cited based on its 12/26/19 high plus 10 cents in the earlier mid-day report (read here) . It spiked to a new all-time high with a big volume-driven gain today triggering a technical buy signal. It found prompt support near its 50-day moving average (DMA) line ($46.95) during recent consolidations.
Bullish action came after it reported earnings +60% on +24% sales revenues for the quarter ended December 31, 2019 versus the year ago period, marking its 6th consecutive quarter with earnings increasing above the +25 minimum guideline (C criteria).
The Computer-Tech Services firm completed a Secondary Offering on 4/17/19. Limited history was noted as a concern for this UK-based Computer - Tech Services firm since it completed its $20 IPO on 7/27/18. The number of top-rated funds owning its shares rose from 66 in Mar '19 to 141 in Dec '19, a reassuring sign concerning the I criteria. Its current Up/Down Volume Ratio of 1.1 is an unbiased indication its shares have been near neutral concerning accumulation/distribution over the past 50 days. It has a Timeliness Rating of B and Sponsorship Rating of B.
" |
|
|
Color Codes Explained :
Y - Better candidates highlighted by our
staff of experts.
G - Previously featured
in past reports as yellow but may no longer be buyable under the
guidelines.
***Last / Change / Volume data in this table is the closing quote data***
Symbol/Exchange
Company Name
Industry Group |
PRICE |
CHANGE
(%Change) |
Day High |
Volume
(% DAV)
(% 50 day avg vol) |
52 Wk Hi
% From Hi |
Featured
Date |
Price
Featured |
Pivot Featured |
|
Max Buy |
 FTNT
-
NASDAQ
FTNT
-
NASDAQ
Fortinet Inc
Computer Sftwr-Security
|
$119.10
|
+1.70
1.45% |
$119.24
|
825,917
72.83% of 50 DAV
50 DAV is 1,134,000
|
$121.82
-2.23%
|
12/9/2019
|
$103.85
|
PP = $106.10
|
|
MB = $111.41
|
Most Recent Note - 2/12/2020 6:32:47 PM
G - Reported earnings +29% on +21% sales revenues for the Dec '19 quarter, continuing its strong earnings track record above the +25% minimum guideline (C criteria). Consolidating above the prior low ($112.06) and 50 DMA line ($112.05) which coincide defining important near-term support to watch.
>>> FEATURED STOCK ARTICLE : Fortinet Posted Gain for Best-Ever Close - 2/4/2020 |
View all notes |
Set NEW NOTE alert |
Company Profile |
SEC
News |
Chart |
Request a new note
C
A
S
I |
SPSC
-
NASDAQ
S P S Commerce Inc
COMPUTER SOFTWARE and SERVICES - Application Software
|
$60.04
|
+1.69
2.90% |
$60.35
|
210,347
122.51% of 50 DAV
50 DAV is 171,700
|
$59.98
0.10%
|
11/29/2019
|
$56.59
|
PP = $59.24
|
|
MB = $62.20
|
Most Recent Note - 2/12/2020 6:29:32 PM
Y - Due to report earnings news. Volume and volatility often increase near earnings news. Found support near its 50 DMA line ($56.94) during its recent consolidation. Quietly hovering only -2.7% off its all-time high, but its current Relative Strength Rating of 65 is below the 80+ minimum guideline for buy candidates. Subsequent gains above its pivot point backed by at least +40% above average volume are needed to trigger a new technical buy signal.
>>> FEATURED STOCK ARTICLE : Perched Near High Finding Support at 50-Day Average - 2/3/2020 |
View all notes |
Set NEW NOTE alert |
Company Profile |
SEC
News |
Chart |
Request a new note
C
A
S
I |
AUDC
-
NASDAQ
Audiocodes Ltd
ELECTRONICS - Scientific and Technical Instrum
|
$24.71
|
+1.40
6.01% |
$24.78
|
742,861
215.32% of 50 DAV
50 DAV is 345,000
|
$28.73
-13.99%
|
9/13/2019
|
$19.68
|
PP = $19.84
|
|
MB = $20.83
|
 Most Recent Note - 2/13/2020 5:55:38 PM
G - Rebounded near its 50 DMA line ($24.94) which may act as resistance after damaging volume-driven losses triggered technical sell signals. Fundamentals remain strong after it reported earnings +30% on +15% sales revenues for the Dec '19 quarter.
>>> FEATURED STOCK ARTICLE : Showed Resilience With Close in Upper Third of Intra-day Range - 1/27/2020 |
View all notes |
Set NEW NOTE alert |
Company Profile |
SEC
News |
Chart |
Request a new note
C
A
S
I |
CHDN
-
NASDAQ
Churchill Downs Inc
LEISURE - Gaming Activities
|
$161.70
|
+1.44
0.90% |
$163.63
|
207,826
106.03% of 50 DAV
50 DAV is 196,000
|
$161.75
-0.03%
|
10/8/2019
|
$129.77
|
PP = $132.83
|
|
MB = $139.47
|
Most Recent Note - 2/12/2020 6:30:40 PM
G - Stubbornly held its ground and hit yet another new 52-week high with today's 5th consecutive gain. Its 50 DMA line ($140) defines near-term support above the prior low ($132.55 on 1/03/19) The Jun and Sep '19 quarterly earnings versus the year ago periods were both below the +25% minimum guideline (C criteria) and raised fundamental concerns.
>>> FEATURED STOCK ARTICLE : Perched at New Record High After Recent Gains on Average Volume - 2/7/2020 |
View all notes |
Set NEW NOTE alert |
Company Profile |
SEC
News |
Chart |
Request a new note
C
A
S
I |
LULU
-
NASDAQ
Lululemon Athletica
MANUFACTURING - Textile Manufacturing
|
$253.86
|
-0.08
-0.03% |
$256.80
|
903,788
48.31% of 50 DAV
50 DAV is 1,871,000
|
$254.16
-0.12%
|
9/6/2019
|
$201.25
|
PP = $194.35
|
|
MB = $204.07
|
Most Recent Note - 2/10/2020 6:34:03 PM
G - Extended from any sound base and still hovering near its all-time high with volume totals cooling. Its 50 DMA line ($235) and prior low ($231.84 on 1/27/20) define important near-term support to watch. Fundamentals remain strong.
>>> FEATURED STOCK ARTICLE : Volume Totals Cooling While Hovering Near All-Time High - 1/30/2020 |
View all notes |
Set NEW NOTE alert |
Company Profile |
SEC
News |
Chart |
Request a new note
C
A
S
I |
Symbol/Exchange
Company Name
Industry Group |
PRICE |
CHANGE
(%Change) |
Day High |
Volume
(% DAV)
(% 50 day avg vol) |
52 Wk Hi
% From Hi |
Featured
Date |
Price
Featured |
Pivot Featured |
|
Max Buy |
CPRT
-
NASDAQ
Copart Inc
SPECIALTY RETAIL - Auto Dealerships
|
$103.35
|
+0.86
0.84% |
$103.97
|
1,059,153
66.45% of 50 DAV
50 DAV is 1,594,000
|
$104.10
-0.72%
|
1/2/2020
|
$92.80
|
PP = $92.51
|
|
MB = $97.14
|
Most Recent Note - 2/12/2020 6:31:26 PM
G - Perched near its all-time high and stubbornly holding its ground, extended from any sound base. Its 50 DMA line ($94.78) defines near-term support above prior highs in the $91-92 area. Fundamentals remain strong.
>>> FEATURED STOCK ARTICLE : New High With Yet Another Gain Backed by Light Volume - 1/28/2020 |
View all notes |
Set NEW NOTE alert |
Company Profile |
SEC
News |
Chart |
Request a new note
C
A
S
I |
NMIH
-
NASDAQ
N M I Holdings Inc Cl A
Finance-MrtgandRel Svc
|
$29.33
|
-1.67
-5.39% |
$30.91
|
1,316,215
226.00% of 50 DAV
50 DAV is 582,400
|
$35.79
-18.05%
|
2/6/2020
|
$33.53
|
PP = $35.89
|
|
MB = $37.68
|
Most Recent Note - 2/13/2020 5:53:43 PM
Slumped further today violating its 200 DMA line ($29.56) after triggering a technical sell signal on the prior session. Reported earnings +63% on +38% sales revenues for the Dec '19 quarter. A rebound above its 50 DMA line is needed for its outlook to improve. Its Relative Strength Rating has slumped to 46. It will be dropped from the Featured Stocks list tonight.
>>> FEATURED STOCK ARTICLE : Sputtering Below 50-Day Moving Average Line Hurts Outlook - 1/31/2020 |
View all notes |
Set NEW NOTE alert |
Company Profile |
SEC
News |
Chart |
Request a new note
C
A
S
I |
SPLK
-
NASDAQ
Splunk Inc
Computer Sftwr-Database
|
$170.93
|
+1.09
0.64% |
$172.25
|
1,047,347
67.40% of 50 DAV
50 DAV is 1,554,000
|
$171.17
-0.14%
|
11/25/2019
|
$147.79
|
PP = $142.16
|
|
MB = $149.27
|
Most Recent Note - 2/10/2020 6:29:56 PM
G - Posted a solid gain on light volume today for its second-best close. It is extended from the previously noted base. Its 50 DMA line ($153) and prior highs in the $142-143 area define important support to watch on pullbacks.
>>> FEATURED STOCK ARTICLE : Volume Totals Cooling While Hovering Near All-Time High - 1/29/2020 |
View all notes |
Set NEW NOTE alert |
Company Profile |
SEC
News |
Chart |
Request a new note
C
A
S
I |
PAYC
-
NYSE
Paycom Software Inc
COMPUTER SOFTWARE and SERVICES - Application Software
|
$303.29
|
+6.93
2.34% |
$306.61
|
697,729
79.56% of 50 DAV
50 DAV is 877,000
|
$342.00
-11.32%
|
11/20/2019
|
$252.97
|
PP = $259.81
|
|
MB = $272.80
|
Most Recent Note - 2/11/2020 5:47:25 PM
G - Reported earnings +41% on +29% for the Dec '19 quarter. Very extended from any sound base. Halted its slide above its 50 DMA line ($284.69) and prior high ($279.95 on 11/27/19) after abruptly retreating from its high. More damaging losses would raise concerns and trigger a technical sell signal. See the latest FSU analysis for more details and a new annotated graph.
>>> FEATURED STOCK ARTICLE : Pulled Back Near 50-Day Average Following Strong Earnings Report - 2/11/2020 |
View all notes |
Set NEW NOTE alert |
Company Profile |
SEC
News |
Chart |
Request a new note
C
A
S
I |
BLD
-
NYSE
Topbuild Corp
Bldg-Constr Prds/Misc
|
$118.70
|
+1.05
0.89% |
$120.71
|
268,884
96.03% of 50 DAV
50 DAV is 280,000
|
$120.62
-1.59%
|
12/9/2019
|
$109.71
|
PP = $113.84
|
|
MB = $119.53
|
Most Recent Note - 2/10/2020 12:32:40 PM
Y - Touched a new 52-week high and trading near its "max buy" level with today's 4th consecutive gain. Prior high ($113.74) defines near-term support above its 50 DMA line ($108.91). See the latest FSU analysis for more details and an annotated graph.
>>> FEATURED STOCK ARTICLE : Volume Totals Cooling While Consolidating Near All-Time High - 2/6/2020 |
View all notes |
Set NEW NOTE alert |
Company Profile |
SEC
News |
Chart |
Request a new note
C
A
S
I |
Symbol/Exchange
Company Name
Industry Group |
PRICE |
CHANGE
(%Change) |
Day High |
Volume
(% DAV)
(% 50 day avg vol) |
52 Wk Hi
% From Hi |
Featured
Date |
Price
Featured |
Pivot Featured |
|
Max Buy |
TEAM
-
NASDAQ
Atlassian Corp Plc Cl A
Comp Sftwr-Spec Enterprs
|
$153.25
|
+1.71
1.13% |
$155.00
|
2,068,048
133.25% of 50 DAV
50 DAV is 1,552,000
|
$153.70
-0.29%
|
1/24/2020
|
$144.66
|
PP = $140.49
|
|
MB = $147.51
|
Most Recent Note - 2/10/2020 6:31:20 PM
G - Color code is changed to green after rising above its "max buy" level with today's 3rd consecutive gain. Rallied from a cup-with-handle base pattern with volume +514% above average behind the considerable gain on 1/24/20 triggering a technical buy signal. Bullish action came after it reported earnings +48% on +37% sales revenues for the Dec '19 quarter.
>>> FEATURED STOCK ARTICLE : Atlassian Has Been Hovering Near its All-Time High - 2/12/2020 |
View all notes |
Set NEW NOTE alert |
Company Profile |
SEC
News |
Chart |
Request a new note
C
A
S
I |
GLOB
-
NYSE
Globant SA
Computer-Tech Services
|
$126.08
|
+0.61
0.49% |
$126.80
|
180,412
71.31% of 50 DAV
50 DAV is 253,000
|
$131.00
-3.76%
|
11/14/2019
|
$106.87
|
PP = $112.43
|
|
MB = $118.05
|
Most Recent Note - 2/12/2020 6:25:24 PM
G - Consolidating near its high after wedging to new highs with gains lacking great volume conviction. Its prior high ($112.33) and 50 DMA line ($112.68) define important near-term support to watch.
>>> FEATURED STOCK ARTICLE : Encountering Distributional Pressure After Wedging to New Highs - 2/5/2020 |
View all notes |
Set NEW NOTE alert |
Company Profile |
SEC
News |
Chart |
Request a new note
C
A
S
I |
STNE
-
NASDAQ
Stoneco Ltd Cl A
Finance-CrdtCard/PmtPr
|
$42.01
|
+1.22
2.99% |
$42.37
|
2,146,330
123.57% of 50 DAV
50 DAV is 1,737,000
|
$45.72
-8.11%
|
1/22/2020
|
$43.94
|
PP = $45.72
|
|
MB = $48.01
|
Most Recent Note - 2/10/2020 6:26:40 PM
G - Violated its 50 DMA line ($40.77) with a streak of 5 consecutive losses and its color code was changed to green. A subsequent rebound and gains above the pivot point backed by at least +40% above average volume are needed to trigger a technical buy signal. See the latest FSU analysis for more details and a new annotated graph.
>>> FEATURED STOCK ARTICLE : 50-Day Moving Average Line Violation Hurts Outlook - 2/10/2020 |
View all notes |
Set NEW NOTE alert |
Company Profile |
SEC
News |
Chart |
Request a new note
C
A
S
I |
DAVA
-
NYSE
Endava Plc Cl A Ads
Computer-Tech Services
|
$54.98
|
+6.67
13.81% |
$55.50
|
520,029
565.25% of 50 DAV
50 DAV is 92,000
|
$49.75
10.51%
|
2/13/2020
|
$53.71
|
PP = $49.86
|
|
MB = $52.35
|
Most Recent Note - 2/13/2020 5:48:15 PM
Y - Finished strong after highlighted in yellow with new pivot point cited based on its 12/26/19 high plus 10 cents in the earlier mid-day report. Spiked to a new all-time high with a big gain triggering a technical buy signal. Found prompt support near its 50 DMA line ($46.95) during recent consolidations. Bullish action came after it reported earnings +60% on +24% sales revenues for the quarter ended December 31, 2019 versus the year ago period, marking its 6th consecutive quarter with earnings increasing above the +25 minimum guideline (C criteria). Completed a Secondary Offering on 4/17/19. Limited history was noted as a concern for this UK-based Computer - Tech Services firm since it completed its $20 IPO on 7/27/18. See the latest FSU analysis for more details and an annotated graph.
>>> FEATURED STOCK ARTICLE : Breakout Gain Backed By +462% Above Average Volme - 2/13/2020 |
View all notes |
Set NEW NOTE alert |
Company Profile |
SEC
News |
Chart |
Request a new note
C
A
S
I |
|
|
|
THESE ARE NOT BUY RECOMMENDATIONS!
Comments contained in the body of this report are technical
opinions only. The material herein has been obtained
from sources believed to be reliable and accurate, however,
its accuracy and completeness cannot be guaranteed.
This site is not an investment advisor, hence it does
not endorse or recommend any securities or other investments.
Any recommendation contained in this report may not
be suitable for all investors and it is not to be deemed
an offer or solicitation on our part with respect to
the purchase or sale of any securities. All trademarks,
service marks and trade names appearing in this report
are the property of their respective owners, and are
likewise used for identification purposes only.
This report is a service available
only to active Paid Premium Members.
You may opt-out of receiving report notifications
at any time. Questions or comments may be submitted
by writing to Premium Membership Services 665 S.E. 10 Street, Suite 201 Deerfield Beach, FL 33441-5634 or by calling 1-800-965-8307
or 954-785-1121.
|
|
|