You are not logged in.
This means you
CAN ONLY VIEW reports that were published prior to Monday, April 14, 2025.
You
MUST UPGRADE YOUR MEMBERSHIP if you want to see any current reports.
AFTER MARKET UPDATE - THURSDAY, FEBRUARY 13TH, 2014
Previous After Market Report Next After Market Report >>>
|
|
|
|
DOW |
+63.65 |
16,027.59 |
+0.40% |
|
Volume |
626,657,240 |
-0% |
|
Volume |
2,099,740,420 |
+10% |
|
NASDAQ |
+39.38 |
4,240.67 |
+0.94% |
|
Advancers |
2,243 |
71% |
|
Advancers |
1,884 |
70% |
|
S&P 500 |
+10.57 |
1,829.83 |
+0.58% |
|
Decliners |
774 |
25% |
|
Decliners |
708 |
26% |
|
Russell 2000 |
+15.25 |
1,147.79 |
+1.35% |
|
52 Wk Highs |
145 |
|
|
52 Wk Highs |
130 |
|
|
S&P 600 |
+8.69 |
647.49 |
+1.36% |
|
52 Wk Lows |
21 |
|
|
52 Wk Lows |
20 |
|
|
 |
Breadth Positive as Major Averages Rise Again
Kenneth J. Gruneisen - Passed the CAN SLIM® Master's Exam
Stocks advanced on Thursday for the third time this week. Volume totals were reported mixed, higher than the prior trading session's volume total on the Nasdaq exchange and lower on the NYSE. Breadth was positive as advancers led decliners by about a 3-1 ratio on the NYSE and nearly as well on the Nasdaq exchange. There were 59 high-ranked companies from the CANSLIM.net Leaders List that made new 52-week highs and appeared on the CANSLIM.net BreakOuts Page, up from the total of 54 stocks on the prior session. The list of stocks hitting new 52-week highs outnumbered new 52-week lows on the Nasdaq exchange and on the NYSE. There were gains for 8 of the 10 high-ranked companies currently included on the Featured Stocks Page. The Market (M criteria) environment has been noted as a "Confirmed Uptrend" in the newspaper after a brief correction recently raised caution flags. For any rally to be sustained it is critical for there to be healthy leadership, so it encouraging to see many stocks hitting new 52-week highs.
The Dow gained 63 points to 16,027. The S&P 500 Index increased 10 points to 1,829. The NASDAQ rose 39 points to 4,240.
Disappointing updates on the consumer and the labor market were overlooked as investors attributed weak economic data to bad weather conditions. Retail sales unexpectedly fell last month by the most since June 2012 and jobless claims unexpectedly jumped by 8,000 to 339,000. A separate report showed business inventories posted a larger-than-anticipated gain of +0.5% in December.
Overall, every sector closed in positive territory. Utilities and telecommunications were the best performing groups. Dominion Resources (D +1.9%) rallied and CenturyLink (CTL +1.9%) rose after the company topped earnings expectations. Consumer stocks also helped lift the market as Time Warner Cable (TWC +6.8%) rallied after agreeing to be acquired by Comcast (CMCSA -4.12%) for about $45.2 billion in stock.
Treasuries snapped a two-day slump and a government auction of 30-year bonds drew less-than-average demand. The 10-year note gained 15/32 to yield 2.73%. The 30-year bond rose 21/32 to yield 3.68%.
The CANSLIM.net Featured Stocks Page shows the most action-worthy candidates and their latest notes and a Headline Link directs members to the latest detailed analysis with data-packed graphs annotated by a Certified expert along with links to additional resources. The Premium Member Homepage includes "dynamic archives" to all prior pay reports published. Watch for an announcement via email concerning the next WEBCAST.
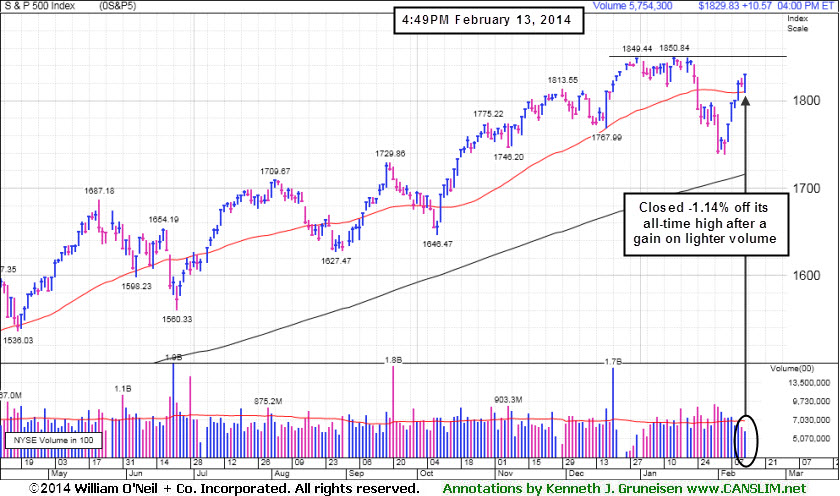
PICTURED: The S&P 500 Index rebounded further above its 50-day moving average (DMA) line. It finished -1.14% off its all-time high. The Dow Jones Industrial Average is the only one of the 3 major averages which has not yet rebounded above its respective 50 DMA line.
|
 Kenneth J. Gruneisen started out as a licensed stockbroker in August 1987, a couple of months prior to the historic stock market crash that took the Dow Jones Industrial Average down -22.6% in a single day. He has published daily fact-based fundamental and technical analysis on high-ranked stocks online for two decades. Through FACTBASEDINVESTING.COM, Kenneth provides educational articles, news, market commentary, and other information regarding proven investment systems that work in good times and bad.
Comments contained in the body of this report are technical opinions only and are not necessarily those of Gruneisen Growth Corp. The material herein has been obtained from sources believed to be reliable and accurate, however, its accuracy and completeness cannot be guaranteed. Our firm, employees, and customers may effect transactions, including transactions contrary to any recommendation herein, or have positions in the securities mentioned herein or options with respect thereto. Any recommendation contained in this report may not be suitable for all investors and it is not to be deemed an offer or solicitation on our part with respect to the purchase or sale of any securities. |
|
 |
Financial, Retail, and Tech Indexes Outpaced by Gold & Silver Index
Kenneth J. Gruneisen - Passed the CAN SLIM® Master's Exam
The Broker/Dealer Index ($XBD +1.10%) outpaced the Bank Index ($BKX +0.23%) as financial shares had a positive bias on Thursday's session. The Biotechnology Index ($BTK +1.15%), Semiconductor Index ($SOX +1.19%), and Networking Index ($NWX +0.65%) ended unanimously higher. Widespread gains also included energy-related shares as the Integrated Oil Index ($XOI +0.54%) and Oil Services Index ($OSX +0.81%) posted modest gains. The Gold & Silver Index ($XAU +3.77%) was a standout gainer.
Charts courtesy www.stockcharts.com
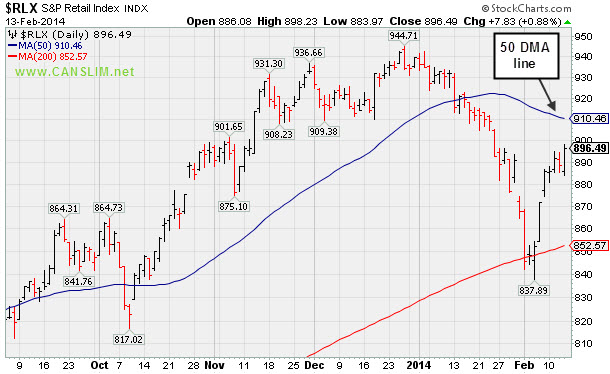
PICTURED: The Retail Index ($RLX +0.65%) is rebounding but remains trading below its 50-day moving average (DMA) line.
| Oil Services |
$OSX |
270.93 |
+2.17 |
+0.81% |
-3.59% |
| Integrated Oil |
$XOI |
1,433.02 |
+7.63 |
+0.54% |
-4.66% |
| Semiconductor |
$SOX |
556.02 |
+6.54 |
+1.19% |
+3.92% |
| Networking |
$NWX |
343.45 |
+2.22 |
+0.65% |
+6.02% |
| Broker/Dealer |
$XBD |
157.40 |
+1.71 |
+1.10% |
-1.97% |
| Retail |
$RLX |
891.79 |
+5.78 |
+0.65% |
-5.11% |
| Gold & Silver |
$XAU |
99.57 |
+3.62 |
+3.77% |
+18.32% |
| Bank |
$BKX |
68.38 |
+0.54 |
+0.80% |
-1.27% |
| Biotech |
$BTK |
2,655.81 |
+30.18 |
+1.15% |
+13.96% |
|
|
|
 |
Extended From Prior Highs After 6th Straight Gain
Kenneth J. Gruneisen - Passed the CAN SLIM® Master's Exam
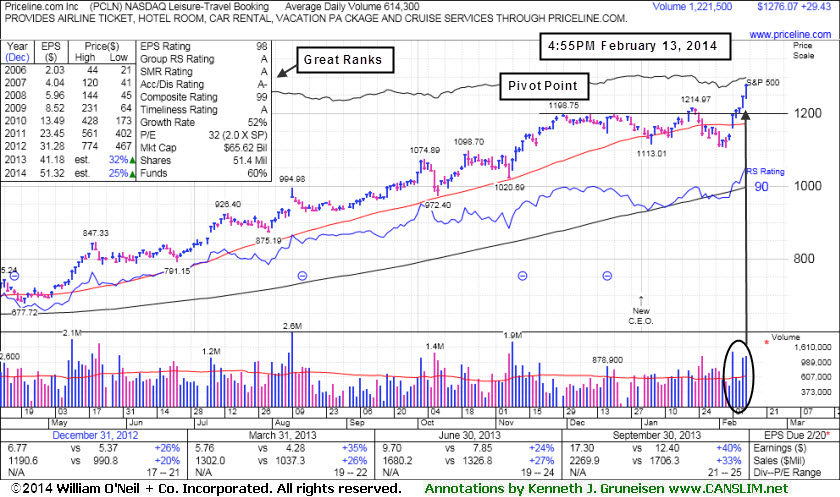
Priceline.com Inc (PCLN +$29.43 or +2.36% to $1,276.07) rallied to yet another new 52-week high with above average volume behind today's gain, getting extended from any sound base. It finished near the session high after tallying its 6th consecutive gain. The stock has faced no resistance due to overhead supply while rallying well above its prior highs and above the "max buy" level cited in prior reports. The Leisure - Travel Booking firm has earned great ranks, including the highest possible rating of 98 for earnings Per Share (EPS). Its strong annual earnings history satisfies the A criteria.
PCLN was last shown in this FSU section on 1/29/14 with annotated graphs under the headline, "Violation of 50-Day Average After Failing to Trigger New Buy Signal", slumping below its 50-day moving average (DMA) line after volume-driven losses raised concerns. The subsequent violation of the prior low ($1,113.01 on 1/06/14) raised greater concerns and triggered a more worrisome technical sell signal.
Disciplined investors watch for a proper technical buy signal before taking action and always limit losses if any stock falls more than -7% from their buy point. Any stock which is sold can always be bought back again if strength returns. In this case, strength returned and the stock was noted on 2/07/14 12:40:56 PM while rebounding above its 50 DMA line with a gap up and considerable volume-driven gain - "Color code is changed to yellow after proving resilient, but no new pivot point is being cited."
Another big factor making buy decisions difficult was the broader market (M criteria) environment in recent weeks. Concerns or questions regarding the M may have also argued all the more in favor of investors employing a tactic called "pyramiding" to allow a stock's price action dictate how heavily to accumulate any new positions. Pyramiding is taught in the Certification. The link above directs members to an example worth reviewing.
PCLN is due to report earnings for the quarter ended December 31, 2013 on February 20th. Keep in mind that volume and volatility often increase near earnings news. Its small supply of only 51.4 million outstanding shares (S criteria) can contribute to price volatility in the event of institutional buying or selling. Earnings rose +40% on +33% sales revenues for the Sep '13 quarter versus the year-ago period, above the +25% minimum earnings guideline (C criteria) and improving after a slightly sub par Jun '13 report.
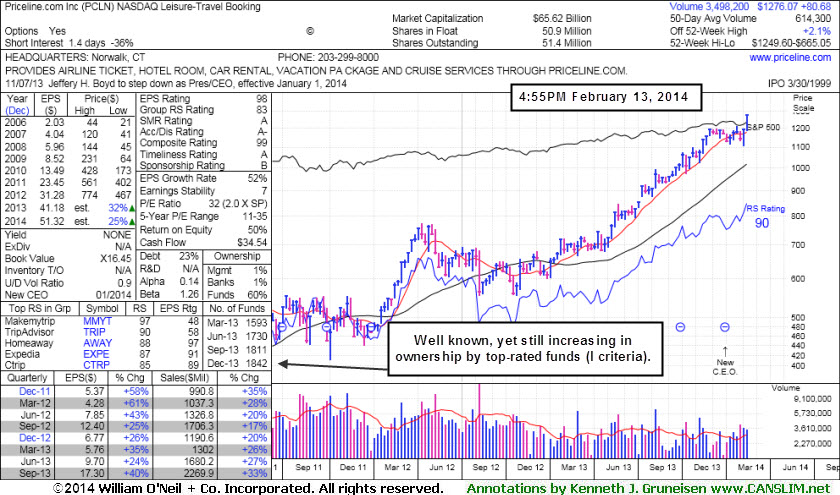
Keep in mind, the investment system's biggest winning models were typically held by at least a few mutual funds and attracting many others. However, once a stock is very heavily owned by a long list of mutual funds, as is now the case with PCLN, investors should be especially cautious and alert for any technical sell signals or fundamental disappointments which could prompt a rush for the exits. The number of top-rated funds owning its shares rose from 1,594 in Mar '13 to 1,842 in Dec '13, and increasing interest is an encouraging sign concerning the I criteria.
Below is a summary of recent notes which alerted members. Remember that your upgraded membership allows you to chose the "Set NEW NOTE alert" link for any stocks you wish closely monitor, then you will automatically receive new notes from our experts directly via email as soon as they are published, keeping you informed ahead of the subsequently published reports. All prior notes on stocks can be reviewed via the "View all notes" links and via the Company Profile pages members can go back and review all Featured Articles & Daily Graphs annotated in prior reports.
2/13/2014 12:57:34 PM - G - Hitting yet another new 52-week high with today's 6th consecutive gain, rallying with no resistance remaining due to overhead supply. Color code is changed to green after rallying above its "max buy" level.
2/12/2014 12:40:07 PM - Y - Hitting a new 52-week high with today's 5th consecutive gain and no resistance remains due to overhead supply. Color code was changed to yellow after proving resilient and rebounding above its 50 DMA line, but no new pivot point was cited.
2/7/2014 12:40:56 PM - Y - Rebounding above its 50 DMA line today with a gap up and considerable volume-driven gain. Color code is changed to yellow after proving resilient, but no new pivot point is being cited. Recent low ($1,103.90 on 2/05/14) defines near-term support to watch where further deterioration would raise greater concerns.
2/6/2014 5:59:06 PM - G - The longer it lingers below its 50 DMA line the worse its outlook gets. Recent low ($1,103.90 on 2/05/14) defines near-term support to watch where further deterioration would raise greater concerns.
1/29/2014 5:57:38 PM - G - Slumped further below its 50 DMA line today with slightly higher volume. Prior low ($1,113.01 on 1/06/13) defines near-term support to watch. See the latest FSU analysis for more details and new annotated graphs.
1/27/2014 12:50:20 PM - G - Slumping below its 50 DMA line today with a 3rd consecutive loss raising concerns. Its color code is changed to green, and the prior low ($1,113.01 on 1/06/13) defines near-term support to watch. Did not trigger a technical buy signal since recently featured in yellow.
1/24/2014 4:18:43 PM - Y - Consolidating above its 50 DMA line which recently acted as support. A volume-driven gain above its pivot point may trigger a technical buy signal, meanwhile, its 50 DMA line and prior low ($1,113.01 on 1/06/13) define near-term support to watch.
|
|
|
Color Codes Explained :
Y - Better candidates highlighted by our
staff of experts.
G - Previously featured
in past reports as yellow but may no longer be buyable under the
guidelines.
***Last / Change / Volume data in this table is the closing quote data***
Symbol/Exchange
Company Name
Industry Group |
PRICE |
CHANGE
(%Change) |
Day High |
Volume
(% DAV)
(% 50 day avg vol) |
52 Wk Hi
% From Hi |
Featured
Date |
Price
Featured |
Pivot Featured |
|
Max Buy |
EQM
-
NYSE
E Q T Midstream Partners
ENERGY - Oil and Gas Pipelines
|
$64.99
|
-1.70
-2.55% |
$67.08
|
270,393
255.09% of 50 DAV
50 DAV is 106,000
|
$67.80
-4.14%
|
12/12/2013
|
$53.17
|
PP = $56.51
|
|
MB = $59.34
|
 Most Recent Note - 2/13/2014 12:46:35 PM
G - Retreating from its 52-week high with volume running at an above average pace behind today's loss. It is extended from any sound base pattern. Prior highs in the $56 area define support to watch on pullbacks.
>>> FEATURED STOCK ARTICLE : Leader Still Extended From Any Sound Base - 2/7/2014
View all notes |
Set NEW NOTE alert |
CANSLIM.net Company Profile |
SEC
News |
Chart |
Request a new note
C
A N
S L
I M


|
FB
-
NASDAQ
Facebook Inc Cl A
INTERNET
|
$67.33
|
+2.88
4.47% |
$67.33
|
61,911,668
95.73% of 50 DAV
50 DAV is 64,676,000
|
$65.06
3.49%
|
12/12/2013
|
$51.40
|
PP = $54.93
|
|
MB = $57.68
|
Most Recent Note - 2/13/2014 4:17:40 PM
G - Finished near the session high today with a big gain on near average volume. It is extended well beyond the "secondary buy point" recently noted. Prior highs near $58 define important near-term support to watch on pullbacks. Disciplined investors avoid chasing extended stocks.
>>> FEATURED STOCK ARTICLE : Volume Totals Cooling While Holding Ground at Highs - 2/6/2014
View all notes |
Set NEW NOTE alert |
CANSLIM.net Company Profile |
SEC
News |
Chart |
Request a new note
C
A N
S L
I M
|
JAZZ
-
NASDAQ
Jazz Pharmaceuticals Plc
DRUGS - Biotechnology
|
$160.76
|
+1.37
0.86% |
$162.11
|
760,673
83.59% of 50 DAV
50 DAV is 910,000
|
$163.68
-1.78%
|
9/30/2013
|
$93.20
|
PP = $89.10
|
|
MB = $93.56
|
Most Recent Note - 2/12/2014 1:29:08 PM
G - Hitting new 52-week and all-time highs with today's 4th consecutive gain. It is extended from any sound base. Its 50 DMA line and recent lows in the $135 area define important support to watch on pullbacks.
>>> FEATURED STOCK ARTICLE : Consolidating After Getting Very Extended - 2/5/2014
View all notes |
Set NEW NOTE alert |
CANSLIM.net Company Profile |
SEC
News |
Chart |
Request a new note
C
A N
S L
I M
|
KORS
-
NYSE
Michael Kors Hldgs Ltd
RETAIL - Apparel Stores
|
$98.41
|
+2.40
2.50% |
$98.81
|
3,055,273
74.36% of 50 DAV
50 DAV is 4,109,000
|
$97.78
0.64%
|
2/4/2014
|
$90.92
|
PP = $84.68
|
|
MB = $88.91
|
Most Recent Note - 2/13/2014 4:19:08 PM
G - Hit another new 52-week high today, getting very extended from its prior base. Prior highs in the $84 area define the nearest chart support level. Disciplined investors avoid chasing extended stocks.
>>> FEATURED STOCK ARTICLE : Down on Higher Volume Ahead of Quarterly Earnings Report - 2/3/2014
View all notes |
Set NEW NOTE alert |
CANSLIM.net Company Profile |
SEC
News |
Chart |
Request a new note
C
A N
S L
I M
|
PCLN
-
NASDAQ
Priceline.com Inc
INTERNET - Internet Software and Services
|
$1,276.07
|
+29.43
2.36% |
$1,282.60
|
1,222,278
199.07% of 50 DAV
50 DAV is 614,000
|
$1,249.60
2.12%
|
12/18/2013
|
$1,156.20
|
PP = $1,198.85
|
|
MB = $1,258.79
|
Most Recent Note - 2/13/2014 6:16:03 PM
G - Ended at a new 52-week high with above average volume behind its 6th consecutive gain. Rallying with no resistance remaining due to overhead supply. Color code was changed to green after rallying above its "max buy" level. See the latest FSU analysis for more details and new annotated graphs.
>>> FEATURED STOCK ARTICLE : Extended From Prior Highs After 6th Straight Gain - 2/13/2014
View all notes |
Set NEW NOTE alert |
CANSLIM.net Company Profile |
SEC
News |
Chart |
Request a new note
C
A N
S L
I M
|
Symbol/Exchange
Company Name
Industry Group |
PRICE |
CHANGE
(%Change) |
Day High |
Volume
(% DAV)
(% 50 day avg vol) |
52 Wk Hi
% From Hi |
Featured
Date |
Price
Featured |
Pivot Featured |
|
Max Buy |
RGR
-
NYSE
Sturm Ruger & Co Inc
CONSUMER DURABLES - Sporting Goods
|
$72.76
|
-0.89
-1.21% |
$73.30
|
628,450
168.03% of 50 DAV
50 DAV is 374,000
|
$85.93
-15.33%
|
1/8/2014
|
$78.87
|
PP = $80.38
|
|
MB = $84.40
|
Most Recent Note - 2/10/2014 1:57:28 PM
G- Today's 3rd consecutive gain on light volume has it rebounding near its 50 DMA line which may now act as resistance. Faces overhead supply up through the $85 level after recent distributional action.
>>> FEATURED STOCK ARTICLE : Slumped Into Prior Base Negating Breakout and Violated 50-Day Average - 2/4/2014
View all notes |
Set NEW NOTE alert |
CANSLIM.net Company Profile |
SEC
News |
Chart |
Request a new note
C
A N
S L
I M
|
SFUN
-
NYSE
Soufun Hldgs Ltd Ads A
INTERNET - Internet Information Providers
|
$81.51
|
+3.69
4.74% |
$81.76
|
2,088,366
145.73% of 50 DAV
50 DAV is 1,433,000
|
$95.39
-14.55%
|
10/17/2013
|
$58.02
|
PP = $53.87
|
|
MB = $56.56
|
Most Recent Note - 2/13/2014 4:14:55 PM
G - Rebounded and closed above its 50 DMA line with above average volume behind today's considerable gain. The session helped its technical stance and outlook improve. It was not formed a sound base.
>>> FEATURED STOCK ARTICLE : 50-Day Moving Average Defines Near Term Support After Great Rally - 1/31/2014
View all notes |
Set NEW NOTE alert |
CANSLIM.net Company Profile |
SEC
News |
Chart |
Request a new note
C
A N
S L
I M
|
SILC
-
NASDAQ
Silicom Ltd
COMPUTER HARDWARE - Networking andamp; Communication Dev
|
$65.90
|
+0.08
0.12% |
$66.39
|
58,672
93.13% of 50 DAV
50 DAV is 63,000
|
$66.14
-0.36%
|
12/23/2013
|
$44.62
|
PP = $46.25
|
|
MB = $48.56
|
Most Recent Note - 2/12/2014 12:53:14 PM
G - Inching higher for another new 52-week high with today's 7th consecutive gain on ever-increasing volume. Extended from any sound base while on track for a 9th consecutive weekly gain. See the latest FSU analysis for more details and new annotated graphs.
>>> FEATURED STOCK ARTICLE : Stubbornly Held Ground Following Breakaway Gap - 2/11/2014
View all notes |
Set NEW NOTE alert |
CANSLIM.net Company Profile |
SEC
News |
Chart |
Request a new note
C
A N
S L
I M
|
ULTI
-
NASDAQ
Ultimate Software Group
INTERNET - Internet Software and Services
|
$164.87
|
+4.99
3.12% |
$165.11
|
278,080
146.36% of 50 DAV
50 DAV is 190,000
|
$168.43
-2.11%
|
1/27/2014
|
$153.75
|
PP = $162.98
|
|
MB = $171.13
|
Most Recent Note - 2/13/2014 4:22:17 PM
Y - Considerable gain today with near average volume for a best-ever close. Found support above its 50 DMA line following a worrisome "negative reversal" on 2/05/14. Fundamentals remain strong after solid Dec '13 earnings. See the latest FSU analysis for more details and new annotated graphs.
>>> FEATURED STOCK ARTICLE : Stalled and Encountering Distributional Pressure - 2/12/2014
View all notes |
Set NEW NOTE alert |
CANSLIM.net Company Profile |
SEC
News |
Chart |
Request a new note
C
A N
S L
I M
|
VRX
-
NYSE
Valeant Pharmaceuticals
DRUGS - Drug Manufacturers - Other
|
$141.79
|
+1.02
0.72% |
$142.41
|
1,281,257
97.81% of 50 DAV
50 DAV is 1,310,000
|
$142.82
-0.72%
|
9/11/2013
|
$100.26
|
PP = $105.50
|
|
MB = $110.78
|
Most Recent Note - 2/10/2014 1:59:16 PM
G - Hovering quietly near all-time highs, extended from any sound base. Its 50 DMA line ($122) defines near-term support to watch.
>>> FEATURED STOCK ARTICLE : Hovering Near All-Time Highs Extended From Sound Base - 2/10/2014
View all notes |
Set NEW NOTE alert |
CANSLIM.net Company Profile |
SEC
News |
Chart |
Request a new note
C
A N
S L
I M
|
Symbol/Exchange
Company Name
Industry Group |
PRICE |
CHANGE
(%Change) |
Day High |
Volume
(% DAV)
(% 50 day avg vol) |
52 Wk Hi
% From Hi |
Featured
Date |
Price
Featured |
Pivot Featured |
|
Max Buy |
|
|
|
THESE ARE NOT BUY RECOMMENDATIONS!
Comments contained in the body of this report are technical
opinions only. The material herein has been obtained
from sources believed to be reliable and accurate, however,
its accuracy and completeness cannot be guaranteed.
This site is not an investment advisor, hence it does
not endorse or recommend any securities or other investments.
Any recommendation contained in this report may not
be suitable for all investors and it is not to be deemed
an offer or solicitation on our part with respect to
the purchase or sale of any securities. All trademarks,
service marks and trade names appearing in this report
are the property of their respective owners, and are
likewise used for identification purposes only.
This report is a service available
only to active Paid Premium Members.
You may opt-out of receiving report notifications
at any time. Questions or comments may be submitted
by writing to Premium Membership Services 665 S.E. 10 Street, Suite 201 Deerfield Beach, FL 33441-5634 or by calling 1-800-965-8307
or 954-785-1121.
|
|
|

