You are not logged in.
This means you
CAN ONLY VIEW reports that were published prior to Monday, February 26, 2024.
You
MUST UPGRADE YOUR MEMBERSHIP if you want to see any current reports.
AFTER MARKET UPDATE - WEDNESDAY, FEBRUARY 12TH, 2020
Previous After Market Report Next After Market Report >>>
|
|
|
|
DOW |
+275.08 |
29,551.42 |
+0.94% |
|
Volume |
929,176,800 |
+11% |
|
Volume |
2,361,872,820 |
-3% |
|
NASDAQ |
+87.02 |
9,725.96 |
+0.90% |
|
Advancers |
1,744 |
60% |
|
Advancers |
1,915 |
60% |
|
S&P 500 |
+21.70 |
3,379.45 |
+0.65% |
|
Decliners |
1,147 |
40% |
|
Decliners |
1,261 |
40% |
|
Russell 2000 |
+11.86 |
1,689.38 |
+0.71% |
|
52 Wk Highs |
270 |
|
|
52 Wk Highs |
256 |
|
|
S&P 600 |
+6.75 |
1,019.72 |
+0.67% |
|
52 Wk Lows |
35 |
|
|
52 Wk Lows |
50 |
|
|
 |
Breadth Positive as Major Indices Extend Rally
Kenneth J. Gruneisen - Passed the CAN SLIM® Master's Exam
The Dow climbed 275 points, while the S&P 500 rose 0.7%. The Nasdaq Composite added 0.9%. Advancers led decliners by a 3-2 margin on the NYSE and on the Nasdaq exchange. The reported volume totals were mixed, higher than the prior session total on the NYSE and lighter on the Nasdaq exchange. Leadership improved as there were 98 high-ranked companies from the Leaders List that hit a new 52-week high and were listed on the BreakOuts Page, versus 114 on the prior session. New 52-week highs totals again easily outnumbered shrinking new 52-week lows on the NYSE and on the Nasdaq exchange. The major indices' (M criteria) remain in a confirmed uptrend. Disciplined investors buy individual stocks on a case-by-case basis only if all key criteria are met. The Featured Stocks Page provides the most timely analysis on high-ranked leaders. Charts used courtesy of www.stockcharts.com
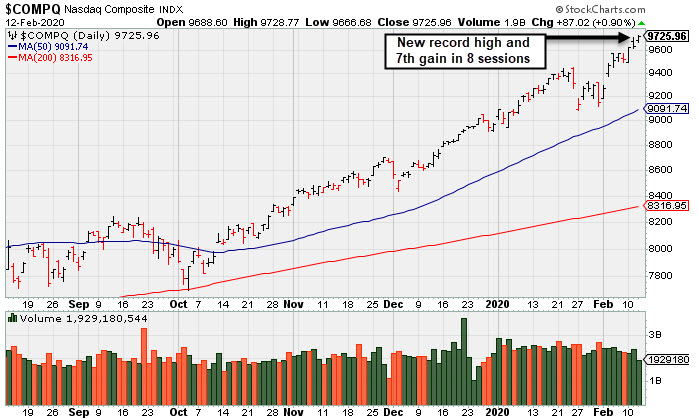
PICTURED: The Nasdaq Composite Index hit a new all-time high with a 7th gain in the span of 8 sessions.
Stocks finished higher Wednesday, with all three major U.S. equity benchmarks notching fresh all-time highs. Risk sentiment was bolstered by hopes the coronavirus can be contained by April, mitigating global economic damage as the number of new reported cases has slowed.
Ten of 11 S&P 500 sectors ended the day in positive territory, with the Consumer Discretionary and Technology sectors pacing gains. In earnings, CVS Health (CVS -0.14%) finished little changed after topping consensus profit and sales projections. Teva Pharmaceutical (TEVA +9.08%) rose following its top and bottom line beat. Meanwhile, Bed Bath & Beyond (BBBY -20.61%) tumbled after reporting a larger-than-anticipated drop in same-store sales. Lyft (LYFT -10.16%) fell despite the ride hailing service delivering better-than-expected quarterly figures. In other corporate news, travel companies that were initially effected by the virus outbreak rebounded with American Airlines (AAL +2.11%) and Wynn Resorts (WYNN +3.66%.
Treasuries weakened, with the yield on the 10-year note rising three basis points to 1.63%. In central bank news, a second day of Congressional testimony from Fed Chair Jerome Powell garnered attention. The Fed chief suggested that the central bank should be able to assess the economic impact of the coronavirus “fairly soon.” Yesterday, Powell reiterated the U.S. economy remains in a good position. On the data front, an update on the federal budget statement showed the monthly budget widened more than anticipated. In commodities, WTI crude jumped 3.2% to $51.56/barrel. |
 Kenneth J. Gruneisen started out as a licensed stockbroker in August 1987, a couple of months prior to the historic stock market crash that took the Dow Jones Industrial Average down -22.6% in a single day. He has published daily fact-based fundamental and technical analysis on high-ranked stocks online for two decades. Through FACTBASEDINVESTING.COM, Kenneth provides educational articles, news, market commentary, and other information regarding proven investment systems that work in good times and bad.
Comments contained in the body of this report are technical opinions only and are not necessarily those of Gruneisen Growth Corp. The material herein has been obtained from sources believed to be reliable and accurate, however, its accuracy and completeness cannot be guaranteed. Our firm, employees, and customers may effect transactions, including transactions contrary to any recommendation herein, or have positions in the securities mentioned herein or options with respect thereto. Any recommendation contained in this report may not be suitable for all investors and it is not to be deemed an offer or solicitation on our part with respect to the purchase or sale of any securities. |
|
 |
Tech, Retail, and Energy-Linked Groups Led Gainers
Kenneth J. Gruneisen - Passed the CAN SLIM® Master's Exam
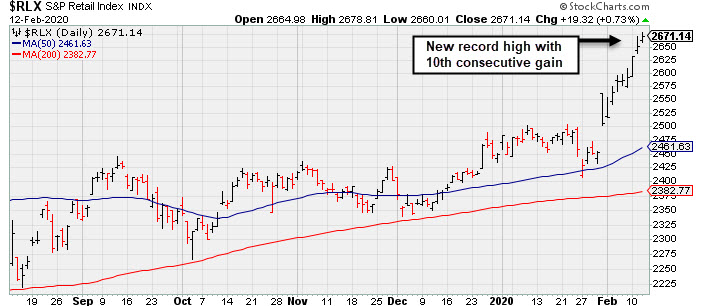
The Retail Index ($RLX +0.73%), Bank Index ($BKX +0.14%), and the Broker/Dealer Index ($XBD +0.49%) posted unanimous gains. The tech sector had a positive bias as the Biotech Index ($BTK +1.11%), Semiconductor Index ($SOX +1.44%), and the Networking Index ($NWX +1.01%) each rose. Energy-linked groups also posted gains as the Oil Services Index ($OSX +2.20%) and Integrated Oil Index ($XOI +1.65%) both rose. The Gold & Silver Index ($XAU -0.73%) was a clear laggard as it ended the session lower.
PICTURED: The Retail Index ($RLX +0.73%) rallied for new all-time highs with a streak of 10 consecutive gains.
| Oil Services |
$OSX |
65.40 |
+1.41 |
+2.20% |
-16.46% |
| Integrated Oil |
$XOI |
1,139.29 |
+18.44 |
+1.65% |
-10.33% |
| Semiconductor |
$SOX |
1,958.82 |
+27.74 |
+1.44% |
+5.90% |
| Networking |
$NWX |
573.11 |
+5.73 |
+1.01% |
-1.77% |
| Broker/Dealer |
$XBD |
303.97 |
+1.48 |
+0.49% |
+4.68% |
| Retail |
$RLX |
2,671.14 |
+19.32 |
+0.73% |
+9.06% |
| Gold & Silver |
$XAU |
102.12 |
-0.75 |
-0.73% |
-4.49% |
| Bank |
$BKX |
109.51 |
+0.15 |
+0.14% |
-3.40% |
| Biotech |
$BTK |
5,256.74 |
+57.75 |
+1.11% |
+3.74% |
|
|
|
 |
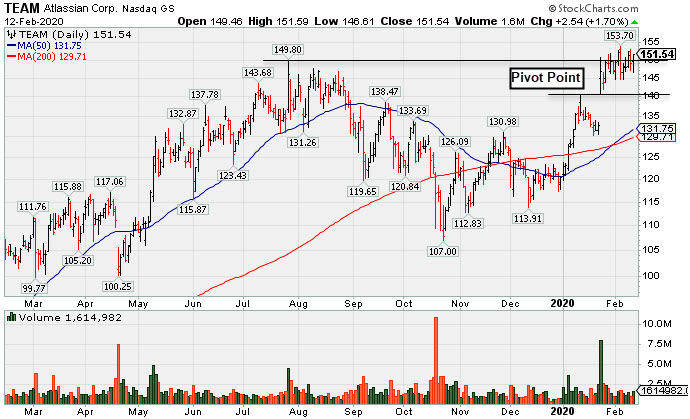
Atlassian Has Been Hovering Near its All-Time High
Kenneth J. Gruneisen - Passed the CAN SLIM® Master's Exam
Atlassian Corp (TEAM +$2.54 or +1.70% to $151.54) is perched above its "max buy" level and near its all-time high. Rallied from a cup-with-handle base pattern with volume +514% above average behind the considerable gain on 1/24/20 triggering a technical buy signal. Bullish action came after it reported earnings +48% on +37% sales revenues for the Dec '19 quarter.
TEAM was highlighted in yellow with pivot point cited based on its 1/13/20 high in the 1/24/20 mid-day report (read here). It gapped up and touched a new all-time high, rising from a cup-with-handle base pattern with a big volume-driven gain triggering a technical buy signal. Volume was +514% above average behind the big gain, action indicative of fresh institutional buying demand.
Bullish action came after it reported earnings +48% on +37% sales revenues for the Dec '19 quarter. Fundamentals remained strong while it went through a deep consolidation below its 200 DMA line since dropped from the Featured Stocks list on 9/09/19. This Australia - based software developer has shown 9 consecutive quarterly comparisons above the +25% minimum guideline (C criteria). Its annual earnings (A criteria) history has been strong since its $21 IPO on 12/10/15.
TEAM was last shown in the FSU section on 1/24/20 with an annotated graph under the headline, "Gapped Up Today Following Another Strong Earnings Report". The number of top-rated funds owning its shares rose from 266 in Sep '17 to 636 in Dec '19, a reassuring sign concerning the I criteria. It has a Timeliness Rating of A and Sponsorship Rating of A. Its current Up/Down Volume Ratio of 1.6 is an unbiased indication its shares have been under accumulation over the past 50 days. |
|
|
Color Codes Explained :
Y - Better candidates highlighted by our
staff of experts.
G - Previously featured
in past reports as yellow but may no longer be buyable under the
guidelines.
***Last / Change / Volume data in this table is the closing quote data***
Symbol/Exchange
Company Name
Industry Group |
PRICE |
CHANGE
(%Change) |
Day High |
Volume
(% DAV)
(% 50 day avg vol) |
52 Wk Hi
% From Hi |
Featured
Date |
Price
Featured |
Pivot Featured |
|
Max Buy |
 FTNT
-
NASDAQ
FTNT
-
NASDAQ
Fortinet Inc
Computer Sftwr-Security
|
$117.40
|
+0.08
0.07% |
$118.52
|
859,055
76.22% of 50 DAV
50 DAV is 1,127,000
|
$121.82
-3.63%
|
12/9/2019
|
$103.85
|
PP = $106.10
|
|
MB = $111.41
|
 Most Recent Note - 2/12/2020 6:32:47 PM
G - Reported earnings +29% on +21% sales revenues for the Dec '19 quarter, continuing its strong earnings track record above the +25% minimum guideline (C criteria). Consolidating above the prior low ($112.06) and 50 DMA line ($112.05) which coincide defining important near-term support to watch.
>>> FEATURED STOCK ARTICLE : Fortinet Posted Gain for Best-Ever Close - 2/4/2020 |
View all notes |
Set NEW NOTE alert |
Company Profile |
SEC
News |
Chart |
Request a new note
C
A
S
I |
SPSC
-
NASDAQ
S P S Commerce Inc
COMPUTER SOFTWARE and SERVICES - Application Software
|
$58.35
|
+0.55
0.95% |
$58.48
|
182,863
106.81% of 50 DAV
50 DAV is 171,200
|
$59.98
-2.72%
|
11/29/2019
|
$56.59
|
PP = $59.24
|
|
MB = $62.20
|
Most Recent Note - 2/12/2020 6:29:32 PM
Y - Due to report earnings news. Volume and volatility often increase near earnings news. Found support near its 50 DMA line ($56.94) during its recent consolidation. Quietly hovering only -2.7% off its all-time high, but its current Relative Strength Rating of 65 is below the 80+ minimum guideline for buy candidates. Subsequent gains above its pivot point backed by at least +40% above average volume are needed to trigger a new technical buy signal.
>>> FEATURED STOCK ARTICLE : Perched Near High Finding Support at 50-Day Average - 2/3/2020 |
View all notes |
Set NEW NOTE alert |
Company Profile |
SEC
News |
Chart |
Request a new note
C
A
S
I |
AUDC
-
NASDAQ
Audiocodes Ltd
ELECTRONICS - Scientific and Technical Instrum
|
$23.31
|
+0.52
2.28% |
$23.33
|
204,203
59.71% of 50 DAV
50 DAV is 342,000
|
$28.73
-18.87%
|
9/13/2019
|
$19.68
|
PP = $19.84
|
|
MB = $20.83
|
Most Recent Note - 2/10/2020 6:28:15 PM
G - A rebound above its 50 DMA line ($25.00) is needed for its outlook to improve after damaging volume-driven losses triggered technical sell signals. Fundamentals remain strong after it reported earnings +30% on +15% sales revenues for the Dec '19 quarter.
>>> FEATURED STOCK ARTICLE : Showed Resilience With Close in Upper Third of Intra-day Range - 1/27/2020 |
View all notes |
Set NEW NOTE alert |
Company Profile |
SEC
News |
Chart |
Request a new note
C
A
S
I |
CHDN
-
NASDAQ
Churchill Downs Inc
LEISURE - Gaming Activities
|
$160.26
|
+0.42
0.26% |
$161.75
|
184,719
95.22% of 50 DAV
50 DAV is 194,000
|
$160.80
-0.34%
|
10/8/2019
|
$129.77
|
PP = $132.83
|
|
MB = $139.47
|
Most Recent Note - 2/12/2020 6:30:40 PM
G - Stubbornly held its ground and hit yet another new 52-week high with today's 5th consecutive gain. Its 50 DMA line ($140) defines near-term support above the prior low ($132.55 on 1/03/19) The Jun and Sep '19 quarterly earnings versus the year ago periods were both below the +25% minimum guideline (C criteria) and raised fundamental concerns.
>>> FEATURED STOCK ARTICLE : Perched at New Record High After Recent Gains on Average Volume - 2/7/2020 |
View all notes |
Set NEW NOTE alert |
Company Profile |
SEC
News |
Chart |
Request a new note
C
A
S
I |
LULU
-
NASDAQ
Lululemon Athletica
MANUFACTURING - Textile Manufacturing
|
$253.94
|
+2.36
0.94% |
$254.16
|
658,072
35.12% of 50 DAV
50 DAV is 1,874,000
|
$252.39
0.61%
|
9/6/2019
|
$201.25
|
PP = $194.35
|
|
MB = $204.07
|
Most Recent Note - 2/10/2020 6:34:03 PM
G - Extended from any sound base and still hovering near its all-time high with volume totals cooling. Its 50 DMA line ($235) and prior low ($231.84 on 1/27/20) define important near-term support to watch. Fundamentals remain strong.
>>> FEATURED STOCK ARTICLE : Volume Totals Cooling While Hovering Near All-Time High - 1/30/2020 |
View all notes |
Set NEW NOTE alert |
Company Profile |
SEC
News |
Chart |
Request a new note
C
A
S
I |
Symbol/Exchange
Company Name
Industry Group |
PRICE |
CHANGE
(%Change) |
Day High |
Volume
(% DAV)
(% 50 day avg vol) |
52 Wk Hi
% From Hi |
Featured
Date |
Price
Featured |
Pivot Featured |
|
Max Buy |
CPRT
-
NASDAQ
Copart Inc
SPECIALTY RETAIL - Auto Dealerships
|
$102.49
|
+0.18
0.18% |
$103.14
|
1,716,610
108.58% of 50 DAV
50 DAV is 1,581,000
|
$104.10
-1.55%
|
1/2/2020
|
$92.80
|
PP = $92.51
|
|
MB = $97.14
|
Most Recent Note - 2/12/2020 6:31:26 PM
G - Perched near its all-time high and stubbornly holding its ground, extended from any sound base. Its 50 DMA line ($94.78) defines near-term support above prior highs in the $91-92 area. Fundamentals remain strong.
>>> FEATURED STOCK ARTICLE : New High With Yet Another Gain Backed by Light Volume - 1/28/2020 |
View all notes |
Set NEW NOTE alert |
Company Profile |
SEC
News |
Chart |
Request a new note
C
A
S
I |
NMIH
-
NASDAQ
N M I Holdings Inc Cl A
Finance-MrtgandRel Svc
|
$31.00
|
-4.57
-12.85% |
$34.00
|
4,148,958
828.14% of 50 DAV
50 DAV is 501,000
|
$35.79
-13.38%
|
2/6/2020
|
$33.53
|
PP = $35.89
|
|
MB = $37.68
|
Most Recent Note - 2/12/2020 12:39:05 PM
G - Gapped down today violating its 50 DMA line ($33.08) and undercutting prior lows triggering technical sell signals. Reported earnings +63% on +38% sales revenues for the Dec '19 quarter. Volume and volatility often increase near earnings news. Color code is changed to green. May likely find support near its 200 DMA line ($29.55) but a rebound above its 50 DMA line is needed for its outlook to improve.
>>> FEATURED STOCK ARTICLE : Sputtering Below 50-Day Moving Average Line Hurts Outlook - 1/31/2020 |
View all notes |
Set NEW NOTE alert |
Company Profile |
SEC
News |
Chart |
Request a new note
C
A
S
I |
SPLK
-
NASDAQ
Splunk Inc
Computer Sftwr-Database
|
$169.84
|
+1.74
1.04% |
$170.42
|
1,236,159
79.65% of 50 DAV
50 DAV is 1,552,000
|
$171.17
-0.78%
|
11/25/2019
|
$147.79
|
PP = $142.16
|
|
MB = $149.27
|
Most Recent Note - 2/10/2020 6:29:56 PM
G - Posted a solid gain on light volume today for its second-best close. It is extended from the previously noted base. Its 50 DMA line ($153) and prior highs in the $142-143 area define important support to watch on pullbacks.
>>> FEATURED STOCK ARTICLE : Volume Totals Cooling While Hovering Near All-Time High - 1/29/2020 |
View all notes |
Set NEW NOTE alert |
Company Profile |
SEC
News |
Chart |
Request a new note
C
A
S
I |
PAYC
-
NYSE
Paycom Software Inc
COMPUTER SOFTWARE and SERVICES - Application Software
|
$296.36
|
+1.60
0.54% |
$296.61
|
624,622
71.88% of 50 DAV
50 DAV is 869,000
|
$342.00
-13.35%
|
11/20/2019
|
$252.97
|
PP = $259.81
|
|
MB = $272.80
|
Most Recent Note - 2/11/2020 5:47:25 PM
G - Reported earnings +41% on +29% for the Dec '19 quarter. Very extended from any sound base. Halted its slide above its 50 DMA line ($284.69) and prior high ($279.95 on 11/27/19) after abruptly retreating from its high. More damaging losses would raise concerns and trigger a technical sell signal. See the latest FSU analysis for more details and a new annotated graph.
>>> FEATURED STOCK ARTICLE : Pulled Back Near 50-Day Average Following Strong Earnings Report - 2/11/2020 |
View all notes |
Set NEW NOTE alert |
Company Profile |
SEC
News |
Chart |
Request a new note
C
A
S
I |
BLD
-
NYSE
Topbuild Corp
Bldg-Constr Prds/Misc
|
$117.65
|
+0.44
0.38% |
$117.76
|
195,734
70.41% of 50 DAV
50 DAV is 278,000
|
$120.62
-2.46%
|
12/9/2019
|
$109.71
|
PP = $113.84
|
|
MB = $119.53
|
Most Recent Note - 2/10/2020 12:32:40 PM
Y - Touched a new 52-week high and trading near its "max buy" level with today's 4th consecutive gain. Prior high ($113.74) defines near-term support above its 50 DMA line ($108.91). See the latest FSU analysis for more details and an annotated graph.
>>> FEATURED STOCK ARTICLE : Volume Totals Cooling While Consolidating Near All-Time High - 2/6/2020 |
View all notes |
Set NEW NOTE alert |
Company Profile |
SEC
News |
Chart |
Request a new note
C
A
S
I |
Symbol/Exchange
Company Name
Industry Group |
PRICE |
CHANGE
(%Change) |
Day High |
Volume
(% DAV)
(% 50 day avg vol) |
52 Wk Hi
% From Hi |
Featured
Date |
Price
Featured |
Pivot Featured |
|
Max Buy |
TEAM
-
NASDAQ
Atlassian Corp Plc Cl A
Comp Sftwr-Spec Enterprs
|
$151.54
|
+2.54
1.70% |
$151.59
|
1,614,982
105.62% of 50 DAV
50 DAV is 1,529,000
|
$153.70
-1.41%
|
1/24/2020
|
$144.66
|
PP = $140.49
|
|
MB = $147.51
|
Most Recent Note - 2/10/2020 6:31:20 PM
G - Color code is changed to green after rising above its "max buy" level with today's 3rd consecutive gain. Rallied from a cup-with-handle base pattern with volume +514% above average behind the considerable gain on 1/24/20 triggering a technical buy signal. Bullish action came after it reported earnings +48% on +37% sales revenues for the Dec '19 quarter.
>>> FEATURED STOCK ARTICLE : Atlassian Has Been Hovering Near its All-Time High - 2/12/2020 |
View all notes |
Set NEW NOTE alert |
Company Profile |
SEC
News |
Chart |
Request a new note
C
A
S
I |
GLOB
-
NYSE
Globant SA
Computer-Tech Services
|
$125.47
|
+2.92
2.38% |
$125.91
|
288,931
115.11% of 50 DAV
50 DAV is 251,000
|
$131.00
-4.22%
|
11/14/2019
|
$106.87
|
PP = $112.43
|
|
MB = $118.05
|
Most Recent Note - 2/12/2020 6:25:24 PM
G - Consolidating near its high after wedging to new highs with gains lacking great volume conviction. Its prior high ($112.33) and 50 DMA line ($112.68) define important near-term support to watch.
>>> FEATURED STOCK ARTICLE : Encountering Distributional Pressure After Wedging to New Highs - 2/5/2020 |
View all notes |
Set NEW NOTE alert |
Company Profile |
SEC
News |
Chart |
Request a new note
C
A
S
I |
STNE
-
NASDAQ
Stoneco Ltd Cl A
Finance-CrdtCard/PmtPr
|
$40.79
|
+0.60
1.49% |
$40.81
|
1,913,122
110.84% of 50 DAV
50 DAV is 1,726,000
|
$45.72
-10.78%
|
1/22/2020
|
$43.94
|
PP = $45.72
|
|
MB = $48.01
|
Most Recent Note - 2/10/2020 6:26:40 PM
G - Violated its 50 DMA line ($40.77) with a streak of 5 consecutive losses and its color code was changed to green. A subsequent rebound and gains above the pivot point backed by at least +40% above average volume are needed to trigger a technical buy signal. See the latest FSU analysis for more details and a new annotated graph.
>>> FEATURED STOCK ARTICLE : 50-Day Moving Average Line Violation Hurts Outlook - 2/10/2020 |
View all notes |
Set NEW NOTE alert |
Company Profile |
SEC
News |
Chart |
Request a new note
C
A
S
I |
|
|
|
THESE ARE NOT BUY RECOMMENDATIONS!
Comments contained in the body of this report are technical
opinions only. The material herein has been obtained
from sources believed to be reliable and accurate, however,
its accuracy and completeness cannot be guaranteed.
This site is not an investment advisor, hence it does
not endorse or recommend any securities or other investments.
Any recommendation contained in this report may not
be suitable for all investors and it is not to be deemed
an offer or solicitation on our part with respect to
the purchase or sale of any securities. All trademarks,
service marks and trade names appearing in this report
are the property of their respective owners, and are
likewise used for identification purposes only.
This report is a service available
only to active Paid Premium Members.
You may opt-out of receiving report notifications
at any time. Questions or comments may be submitted
by writing to Premium Membership Services 665 S.E. 10 Street, Suite 201 Deerfield Beach, FL 33441-5634 or by calling 1-800-965-8307
or 954-785-1121.
|
|
|