You are not logged in.
This means you
CAN ONLY VIEW reports that were published prior to Sunday, February 25, 2024.
You
MUST UPGRADE YOUR MEMBERSHIP if you want to see any current reports.
AFTER MARKET UPDATE - TUESDAY, FEBRUARY 12TH, 2019
Previous After Market Report Next After Market Report >>>
|
|
|
|
DOW |
+372.65 |
25,425.76 |
+1.49% |
|
Volume |
872,775,970 |
+7% |
|
Volume |
2,129,147,180 |
+13% |
|
NASDAQ |
+106.72 |
7,414.62 |
+1.46% |
|
Advancers |
2,218 |
75% |
|
Advancers |
2,260 |
74% |
|
S&P 500 |
+34.93 |
2,744.73 |
+1.29% |
|
Decliners |
734 |
25% |
|
Decliners |
801 |
26% |
|
Russell 2000 |
+19.25 |
1,538.23 |
+1.27% |
|
52 Wk Highs |
94 |
|
|
52 Wk Highs |
76 |
|
|
S&P 600 |
+12.06 |
955.31 |
+1.28% |
|
52 Wk Lows |
8 |
|
|
52 Wk Lows |
13 |
|
|
 |
Breadth Positive as Leadership Expands Behind Rally
Kenneth J. Gruneisen - Passed the CAN SLIM® Master's Exam
Stocks finished firmly higher Tuesday. The Dow added 372 points to 25,425 while the S&P 500 climbed 34 points to 2,744. The Nasdaq Composite gained 106 points to 7,414. The volume totals were higher than the prior session on both the NYSE and the Nasdaq exchange, indicative of increasing institutional buying demand. Advancers led decliners by a 3-1 on the NYSE and by nearly 3-1 on the Nasdaq exchange. There were 49 high-ranked companies from the Leaders List that made a new 52-week high and were listed on the BreakOuts Page, versus the total of 43 on the prior session. New 52-week highs expanded and solidly outnumbered shrinking new 52-week lows totals on the NYSE and on the Nasdaq exchange. The major indices are in a confirmed uptrend after recently noted improvements helped to signal a change in market direction (M criteria) back to a bullish stance. The Featured Stocks Page provides the most timely analysis on high-ranked leaders. Charts used courtesy of www.stockcharts.com
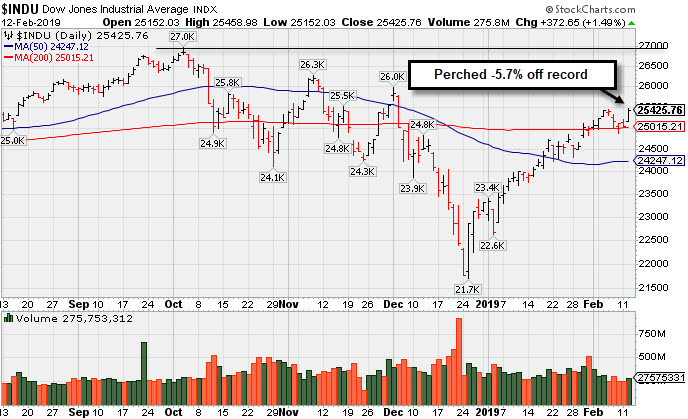
PICTURED: The Dow Jones Industrial Average is consolidating above its 200-day moving average (DMA) line, still -5.7% below its record high.
All three major averages rallied more than 1.2% amid rising optimism surrounding U.S. and Chinese trade relations. Earlier, President Trump said that he may extend the March 1st tariff deadline if a deal with China appears close. This comes ahead of high-level negotiations later this week in Beijing. Stocks were also buoyed following reports that Congress reached a tentative agreement to avoid a partial government shutdown. On the data front, a release showed the NFIB small business optimism index fell to a two-year low in January. A separate update revealed U.S. job openings jumped to a record high of 7.3 million in December.
Ten of 11 S&P 500 sectors ended in positive territory. Materials paced gains with shares of DowDuPont (DWDP +2.62%) finishing the session up. Consumer Discretionary shares also outperformed with Under Armour (UAA +6.88%) rising after the athletic apparel maker topped Wall Street profit and sales expectations. In other corporate news, shares of Coty (COTY +12.53%) surged amid reports European conglomerate JAB offered to increase its stake in the company to as much as 60%.
Treasuries weakened with the yield on the 10-year note up two basis points to 2.68%. In commodities, WTI crude jumped 1.3% to $53.09/barrel. COMEX gold added 0.2% to $1309.20/ounce amid a weaker dollar. |
 Kenneth J. Gruneisen started out as a licensed stockbroker in August 1987, a couple of months prior to the historic stock market crash that took the Dow Jones Industrial Average down -22.6% in a single day. He has published daily fact-based fundamental and technical analysis on high-ranked stocks online for two decades. Through FACTBASEDINVESTING.COM, Kenneth provides educational articles, news, market commentary, and other information regarding proven investment systems that work in good times and bad.
Comments contained in the body of this report are technical opinions only and are not necessarily those of Gruneisen Growth Corp. The material herein has been obtained from sources believed to be reliable and accurate, however, its accuracy and completeness cannot be guaranteed. Our firm, employees, and customers may effect transactions, including transactions contrary to any recommendation herein, or have positions in the securities mentioned herein or options with respect thereto. Any recommendation contained in this report may not be suitable for all investors and it is not to be deemed an offer or solicitation on our part with respect to the purchase or sale of any securities. |
|
 |
Retail, Semiconductor, Financial, and Energy-Linked Groups Rose
Kenneth J. Gruneisen - Passed the CAN SLIM® Master's Exam
The Broker/Dealer Index ($XBD +1.42%) and the Bank Index ($BKX +1.46%) both posted solid gains on Tuesday, meanwhile the Retail Index ($RLX +2.13%) tallied an even larger gain. The tech sector had a positive bias as the Semiconductor Index ($SOX +2.13%) outpaced the Biotech Index ($BTK +1.12%) while the Networking Index ($NWX +0.07%) finished flat. The Oil Services Index ($OSX +1.35%) and the Integrated Oil Index ($XOI +1.03%) both rose, meanwhile the Gold & Silver Index ($XAU -0.70%) was a clear laggard as it posted a small loss.
Charts courtesy of www.stockcharts.com
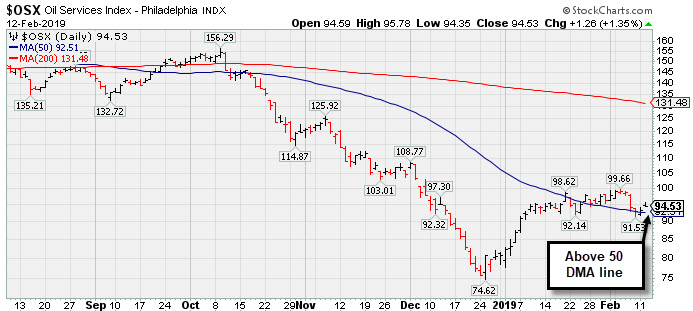 PICTURED: The chart of the Oil Services Index ($OSX +1.35%) illustrates how it rebounded from a multi-year low hit in December and it is consolidating above its 50-day moving average (DMA) line.
| Oil Services |
$OSX |
94.53 |
+1.25 |
+1.34% |
+17.28% |
| Integrated Oil |
$XOI |
1,269.66 |
+13.00 |
+1.03% |
+9.54% |
| Semiconductor |
$SOX |
1,336.72 |
+27.84 |
+2.13% |
+15.72% |
| Networking |
$NWX |
556.94 |
+0.39 |
+0.07% |
+13.97% |
| Broker/Dealer |
$XBD |
263.58 |
+3.69 |
+1.42% |
+11.06% |
| Retail |
$RLX |
2,130.81 |
+44.38 |
+2.13% |
+9.19% |
| Gold & Silver |
$XAU |
74.28 |
-0.53 |
-0.71% |
+5.12% |
| Bank |
$BKX |
98.15 |
+1.41 |
+1.46% |
+14.41% |
| Biotech |
$BTK |
4,869.59 |
+53.99 |
+1.12% |
+15.37% |
|
|
|
 |
Near High After Third Consecutive Gain with Light Volume
Kenneth J. Gruneisen - Passed the CAN SLIM® Master's Exam
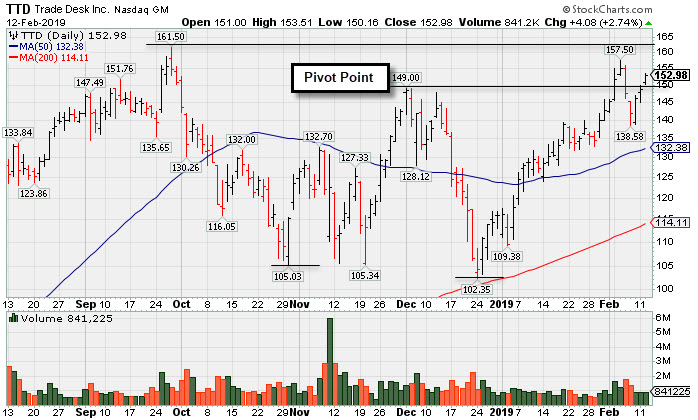
The Trade Desk Inc Cl A (TTD (+$4.08 or +2.74% to $152.98) is perched within close striking distance of its all-time high. The high-ranked Comml Svcs-Advertising firm posted a third consecutive small gain with lighter volume after 2 losses with higher volume. It was highlighted in yellow with pivot point cited based on its 12/03/18 high in the 2/06/19 mid-day report (read here). It faces little resistance due to overhead supply up to the $161 level. Its gain on 2/04/19 was backed by +48% above average volume while clearing a "double bottom" base and triggering a technical buy signal.
Recently it reported earnings +86% on +50% sales revenues for the Sep '18 quarter. Three of the past 4 quarterly comparisons were well above the +25% minimum guideline (C criteria). Its annual earnings (A criteria) history has been strong, and it has a 97 Earnings Per Share Rating.
The number of top-rated funds owning its shares rose from 280 in Mar '18 to 459 in Dec '18, a reassuring sign concerning the I criteria. Its current Up/Down Volume Ratio of 1.6 is an unbiased indication its shares have been under accumulation over the past 50 days. It has a Timeliness Rating of A and a Sponsorship Rating of B. There are only 43.2 million shares outstanding Scirieria) which can contribute to greater volatility in the event of institutional buying or selling.
Charts courtesy of www.stockcharts.com
 |
|
|
Color Codes Explained :
Y - Better candidates highlighted by our
staff of experts.
G - Previously featured
in past reports as yellow but may no longer be buyable under the
guidelines.
***Last / Change / Volume data in this table is the closing quote data***
Symbol/Exchange
Company Name
Industry Group |
PRICE |
CHANGE
(%Change) |
Day High |
Volume
(% DAV)
(% 50 day avg vol) |
52 Wk Hi
% From Hi |
Featured
Date |
Price
Featured |
Pivot Featured |
|
Max Buy |
MLR
-
NYSE
Miller Industries Inc
AUTOMOTIVE - Auto Parts
|
$29.98
|
+0.15
0.50% |
$30.27
|
20,650
64.53% of 50 DAV
50 DAV is 32,000
|
$30.84
-2.79%
|
11/30/2018
|
$28.35
|
PP = $29.50
|
|
MB = $30.98
|
 Most Recent Note - 2/12/2019 6:28:21 PM
Y - Volume totals have been cooling while still holding its ground near its all-time high. Subsequent gains above the pivot point backed by at least +40% above average volume may help clinch a proper technical buy signal. Its 50 DMA line ($28.28) defines near-term support to watch on pullbacks.
>>> FEATURED STOCK ARTICLE : Traded Above Pivot Point Recently Without Great Volume - 1/29/2019 |
View all notes |
Set NEW NOTE alert |
Company Profile |
SEC
News |
Chart |
Request a new note
C
A
S
I |
NSP
-
NYSE
Insperity Inc
Comml Svcs-Outsourcing
|
$124.32
|
-7.65
-5.80% |
$132.50
|
974,227
297.93% of 50 DAV
50 DAV is 327,000
|
$132.00
-5.82%
|
2/11/2019
|
$127.91
|
PP = $121.25
|
|
MB = $127.31
|
Most Recent Note - 2/12/2019 1:58:53 PM
Y - Pulling back abruptly today following a big gain backed by +242% above average volume for a new all-time high as a "breakaway gap" triggered a technical buy signal. Prior highs define initial support to watch. Color code was changed to yellow with new pivot point cited based on its 9/11/18 high plus 10 cents. Reported earnings +25% on +17% sales revenues for the Dec '18 quarter. The past 7 quarterly earnings increases were above the +25% minimum guideline (C criteria). Shares split 2:1 effective 12/19/17. See the latest FSU analysis for more details and an annotated graph.
>>> FEATURED STOCK ARTICLE : Big Breakaway Gap Triggered Technical Buy Signal - 2/11/2019 |
View all notes |
Set NEW NOTE alert |
Company Profile |
SEC
News |
Chart |
Request a new note
C
A
S
I |
IRBT
-
NASDAQ
Irobot Corp
CONSUMER DURABLES - Electronic Equipment
|
$114.50
|
+8.25
7.76% |
$114.81
|
1,433,475
189.36% of 50 DAV
50 DAV is 757,000
|
$118.75
-3.58%
|
2/8/2019
|
$104.92
|
PP = $103.63
|
|
MB = $108.81
|
Most Recent Note - 2/12/2019 6:33:20 PM
G - Posted a 5th consecutive volume-driven gain and its color code is changed to green after rallying above its "max buy" level. Prior high ($103) defines initial support to watch on pullbacks. See the latest FSU analysis for more details and an annotated graph.
>>> FEATURED STOCK ARTICLE : Volume-Driven Gains Cleared Prior High After Double Bottom - 2/8/2019 |
View all notes |
Set NEW NOTE alert |
Company Profile |
SEC
News |
Chart |
Request a new note
C
A
S
I |
LHCG
-
NASDAQ
L H C Group Inc
HEALTH SERVICES - Home Health Care
|
$110.66
|
+2.20
2.03% |
$110.79
|
205,995
75.46% of 50 DAV
50 DAV is 273,000
|
$112.22
-1.39%
|
1/23/2019
|
$107.29
|
PP = $107.61
|
|
MB = $112.99
|
Most Recent Note - 2/8/2019 1:21:38 PM
Y - Pulling back today for a 3rd consecutive loss with near average volume. Subsequent gains above the pivot point backed by at least +40% above average volume may help clinch a convincing technical buy signal.
>>> FEATURED STOCK ARTICLE : Healthcare Services Firm Reached a New High - 1/23/2019 |
View all notes |
Set NEW NOTE alert |
Company Profile |
SEC
News |
Chart |
Request a new note
C
A
S
I |
ENSG
-
NASDAQ
Ensign Group Inc
HEALTH SERVICES - Long-Term Care Facilities
|
$50.75
|
+2.35
4.86% |
$51.19
|
629,249
171.93% of 50 DAV
50 DAV is 366,000
|
$49.99
1.52%
|
2/7/2019
|
$48.71
|
PP = $49.06
|
|
MB = $51.51
|
Most Recent Note - 2/12/2019 1:47:31 PM
Y - Posting another big gain today and hitting a new 52-week high with volume running at an above average pace. Color code was changed to yellow with pivot point cited based on its 12/12/18 high plus 10 cents.
>>> FEATURED STOCK ARTICLE : Closed Near Pivot Point After Gap Up and Big Volume-Driven Gain - 2/7/2019 |
View all notes |
Set NEW NOTE alert |
Company Profile |
SEC
News |
Chart |
Request a new note
C
A
S
I |
Symbol/Exchange
Company Name
Industry Group |
PRICE |
CHANGE
(%Change) |
Day High |
Volume
(% DAV)
(% 50 day avg vol) |
52 Wk Hi
% From Hi |
Featured
Date |
Price
Featured |
Pivot Featured |
|
Max Buy |
BSTC
-
NASDAQ
Biospecifics Technologie
Medical-Biomed/Biotech
|
$67.37
|
-0.63
-0.93% |
$68.90
|
35,478
82.51% of 50 DAV
50 DAV is 43,000
|
$70.25
-4.10%
|
1/18/2019
|
$67.40
|
PP = $66.31
|
|
MB = $69.63
|
Most Recent Note - 2/11/2019 5:24:02 PM
Y - Hovering near its 52-week high. Thinly-traded Biomed/Biotech firm held its ground after a gain above its pivot point on 2/04/19 backed by +148% above average volume triggered a technical buy signal.
>>> FEATURED STOCK ARTICLE : Reversed Into Red After Hitting a New High - 2/5/2019 |
View all notes |
Set NEW NOTE alert |
Company Profile |
SEC
News |
Chart |
Request a new note
C
A
S
I |
UBNT
-
NASDAQ
Ubiquiti Networks
TELECOMMUNICATIONS - Diversified Communication Serv
|
$129.36
|
+0.37
0.29% |
$130.66
|
613,988
159.89% of 50 DAV
50 DAV is 384,000
|
$130.52
-0.89%
|
2/8/2019
|
$121.97
|
PP = $115.54
|
|
MB = $121.32
|
Most Recent Note - 2/11/2019 1:13:04 PM
G - Color code is changed to green after rallying above its "max buy" level. It was highlighted in yellow with new pivot point cited based on its 12/12/18 high plus 10 cents as its gapped up hitting a new all-time high on the prior session. Bullish action came after it reported earnings +75% on +23% sales revenues for the Dec '18 quarter.
>>> FEATURED STOCK ARTICLE : Consolidating Above 50-Day Moving Average - 1/31/2019 |
View all notes |
Set NEW NOTE alert |
Company Profile |
SEC
News |
Chart |
Request a new note
C
A
S
I |
NOW
-
NYSE
Servicenow Inc
Computer Sftwr-Enterprse
|
$234.65
|
+5.64
2.46% |
$236.81
|
2,364,905
101.76% of 50 DAV
50 DAV is 2,324,000
|
$232.25
1.03%
|
1/31/2019
|
$218.14
|
PP = $206.40
|
|
MB = $216.72
|
Most Recent Note - 2/12/2019 6:27:03 PM
G - Stubbornly held its ground and rallied further above its "max buy" level for yet another new all-time high. Prior high ($206) defines initial support to watch on pullbacks.
>>> FEATURED STOCK ARTICLE : Breakaway Gap Followed Strong Earnings Report - 2/1/2019 |
View all notes |
Set NEW NOTE alert |
Company Profile |
SEC
News |
Chart |
Request a new note
C
A
S
I |
PAYC
-
NYSE
Paycom Software Inc
COMPUTER SOFTWARE and SERVICES - Application Software
|
$173.34
|
+1.13
0.66% |
$174.69
|
716,073
111.71% of 50 DAV
50 DAV is 641,000
|
$179.22
-3.28%
|
2/6/2019
|
$171.66
|
PP = $164.18
|
|
MB = $172.39
|
Most Recent Note - 2/11/2019 1:04:51 PM
G - Perched at its all-time high. Color code was changed to green after rising above its "max buy" level. Prior high ($164) defines initial support to watch on pullbacks. See the latest FSU analysis for more details and an annotated graph.
>>> FEATURED STOCK ARTICLE : Breakaway Gap Backed by Volume +388% Above Average - 2/6/2019 |
View all notes |
Set NEW NOTE alert |
Company Profile |
SEC
News |
Chart |
Request a new note
C
A
S
I |
PYPL
-
NASDAQ
Paypal Holdings Inc
Finance-CrdtCard/PmtPr
|
$94.38
|
+1.69
1.82% |
$94.51
|
7,316,392
79.16% of 50 DAV
50 DAV is 9,242,000
|
$94.58
-0.21%
|
1/24/2019
|
$92.56
|
PP = $93.80
|
|
MB = $98.49
|
Most Recent Note - 2/11/2019 5:19:53 PM
Y - Posted a small gain today on light volume. Reported +25% earnings on +13% sales revenues for the Dec '18 quarter. Disciplined investors note that the recent gains above the pivot point lacked the +40% above average volume needed to trigger a proper technical buy signal.
>>> FEATURED STOCK ARTICLE : Perched Within Striking Distance of High Ahead of Earnings News - 1/24/2019 |
View all notes |
Set NEW NOTE alert |
Company Profile |
SEC
News |
Chart |
Request a new note
C
A
S
I |
Symbol/Exchange
Company Name
Industry Group |
PRICE |
CHANGE
(%Change) |
Day High |
Volume
(% DAV)
(% 50 day avg vol) |
52 Wk Hi
% From Hi |
Featured
Date |
Price
Featured |
Pivot Featured |
|
Max Buy |
ALRM
-
NASDAQ
Alarm.com Holdings Inc
Security/Sfty
|
$64.46
|
+0.57
0.89% |
$65.28
|
269,486
50.37% of 50 DAV
50 DAV is 535,000
|
$65.58
-1.71%
|
1/22/2019
|
$60.52
|
PP = $60.30
|
|
MB = $63.32
|
Most Recent Note - 2/8/2019 1:24:44 PM
G - Perched near its all-time high, trading above its "max buy" level. Prior highs in the $60 area define initial support to watch on pullbacks.
>>> FEATURED STOCK ARTICLE : Pullback Broke Steak of Gains and Reversed From New High - 1/22/2019 |
View all notes |
Set NEW NOTE alert |
Company Profile |
SEC
News |
Chart |
Request a new note
C
A
S
I |
PLNT
-
NYSE
Planet Fitness Inc Cl A
Leisure-Services
|
$58.86
|
+0.96
1.66% |
$58.89
|
769,751
60.09% of 50 DAV
50 DAV is 1,281,000
|
$59.91
-1.75%
|
11/7/2018
|
$57.10
|
PP = $55.45
|
|
MB = $58.22
|
Most Recent Note - 2/11/2019 5:18:54 PM
Y - Color code is changed to yellow while quietly consolidating just below its "max buy" level. Its 50 DMA line ($55.85) defines important near-term support to watch above the recent low ($48).
>>> FEATURED STOCK ARTICLE : Hovering in a Tight Range Near All-Time High - 1/25/2019 |
View all notes |
Set NEW NOTE alert |
Company Profile |
SEC
News |
Chart |
Request a new note
C
A
S
I |
TEAM
-
NASDAQ
Atlassian Corp Plc Cl A
Comp Sftwr-Spec Enterprs
|
$106.12
|
+1.55
1.48% |
$106.59
|
1,457,297
81.92% of 50 DAV
50 DAV is 1,779,000
|
$106.40
-0.26%
|
1/7/2019
|
$94.68
|
PP = $98.31
|
|
MB = $103.23
|
Most Recent Note - 2/11/2019 5:21:47 PM
G - Quiet gain today hit another new all-time high. Recent gains have lacked great volume conviction. Gains and a strong close above the pivot point backed by at least +40% above average volume are needed to clinch a proper technical buy signal. Its 50 DMA line ($90.34) and prior low define near-term support to watch on pullbacks. Fundamentals remain strong.
>>> FEATURED STOCK ARTICLE : Volume Light While Hovering Near High - 1/28/2019 |
View all notes |
Set NEW NOTE alert |
Company Profile |
SEC
News |
Chart |
Request a new note
C
A
S
I |
TTD
-
NASDAQ
The Trade Desk Inc Cl A
Comml Svcs-Advertising
|
$152.98
|
+4.08
2.74% |
$153.51
|
840,930
76.66% of 50 DAV
50 DAV is 1,097,000
|
$161.50
-5.28%
|
2/6/2019
|
$148.65
|
PP = $149.00
|
|
MB = $156.45
|
Most Recent Note - 2/12/2019 6:30:15 PM
Y - Posted a 3rd consecutive gain today with lighter than average volume. Faces little resistance due to overhead supply up to the $161 level. Gain on 2/04/19 was backed by +48% above average volume while clearing a "double bottom" base. Reported earnings +86% on +50% sales revenues for the Sep '18 quarter. Three of the past 4 quarterly comparisons were well above the +25% minimum guideline (C criteria). See the latest FSU analysis for more details and a new annotated graph.
>>> FEATURED STOCK ARTICLE : Near High After Third Consecutive Gain with Light Volume - 2/12/2019 |
View all notes |
Set NEW NOTE alert |
Company Profile |
SEC
News |
Chart |
Request a new note
C
A
S
I |
MEDP
-
NASDAQ
Medpace Holdings Inc
Medical-Research Eqp/Svc
|
$64.43
|
+1.74
2.78% |
$64.98
|
634,082
80.47% of 50 DAV
50 DAV is 788,000
|
$69.71
-7.57%
|
1/30/2019
|
$64.10
|
PP = $65.19
|
|
MB = $68.45
|
Most Recent Note - 2/11/2019 5:25:07 PM
Y - Pulled back today for a 5th consecutive loss with higher volume. Subsequent gains above the pivot point backed by at least +40% above average volume may trigger a technical buy signal. Fundamentals remain strong. The 200 DMA line acted as support above the prior low and it has rebounded since dropped from the Featured Stocks list on 12/19/18.
>>> FEATURED STOCK ARTICLE : Rallied Near 52-Week High With a Volume-Driven Gain - 1/30/2019 |
View all notes |
Set NEW NOTE alert |
Company Profile |
SEC
News |
Chart |
Request a new note
C
A
S
I |
Symbol/Exchange
Company Name
Industry Group |
PRICE |
CHANGE
(%Change) |
Day High |
Volume
(% DAV)
(% 50 day avg vol) |
52 Wk Hi
% From Hi |
Featured
Date |
Price
Featured |
Pivot Featured |
|
Max Buy |
|
|
|
THESE ARE NOT BUY RECOMMENDATIONS!
Comments contained in the body of this report are technical
opinions only. The material herein has been obtained
from sources believed to be reliable and accurate, however,
its accuracy and completeness cannot be guaranteed.
This site is not an investment advisor, hence it does
not endorse or recommend any securities or other investments.
Any recommendation contained in this report may not
be suitable for all investors and it is not to be deemed
an offer or solicitation on our part with respect to
the purchase or sale of any securities. All trademarks,
service marks and trade names appearing in this report
are the property of their respective owners, and are
likewise used for identification purposes only.
This report is a service available
only to active Paid Premium Members.
You may opt-out of receiving report notifications
at any time. Questions or comments may be submitted
by writing to Premium Membership Services 665 S.E. 10 Street, Suite 201 Deerfield Beach, FL 33441-5634 or by calling 1-800-965-8307
or 954-785-1121.
|
|
|

