You are not logged in.
This means you
CAN ONLY VIEW reports that were published prior to Monday, April 14, 2025.
You
MUST UPGRADE YOUR MEMBERSHIP if you want to see any current reports.
AFTER MARKET UPDATE - WEDNESDAY, FEBRUARY 12TH, 2014
Previous After Market Report Next After Market Report >>>
|
|
|
|
DOW |
-30.83 |
15,963.94 |
-0.19% |
|
Volume |
627,969,590 |
-10% |
|
Volume |
1,904,661,640 |
+1% |
|
NASDAQ |
+10.25 |
4,201.29 |
+0.24% |
|
Advancers |
1,727 |
55% |
|
Advancers |
1,389 |
52% |
|
S&P 500 |
-0.49 |
1,819.26 |
-0.03% |
|
Decliners |
1,315 |
42% |
|
Decliners |
1,198 |
45% |
|
Russell 2000 |
+3.37 |
1,132.54 |
+0.30% |
|
52 Wk Highs |
111 |
|
|
52 Wk Highs |
121 |
|
|
S&P 600 |
+1.79 |
638.80 |
+0.28% |
|
52 Wk Lows |
18 |
|
|
52 Wk Lows |
18 |
|
|
 |
Major Averages Ended Mixed With Slightly Positive Breadth
Kenneth J. Gruneisen - Passed the CAN SLIM® Master's Exam
The major averages finished mixed on Wednesday. Volume totals were reported mixed, higher than the prior trading session's volume total on the Nasdaq exchange and lower on the NYSE. Breadth was positive as advancers led decliners by about a 9-7 ratio on the NYSE and 7-6 on the Nasdaq exchange. There were 54 high-ranked companies from the CANSLIM.net Leaders List that made new 52-week highs and appeared on the CANSLIM.net BreakOuts Page, matching the total of 54 stocks on the prior session. The list of stocks hitting new 52-week highs outnumbered new 52-week lows on the Nasdaq exchange and on the NYSE. There were gains for 5 of the 10 high-ranked companies currently included on the Featured Stocks Page, a list that has recently been waning. The Market (M criteria) environment has been noted as a "Confirmed Uptrend" in the newspaper after a brief correction recently raised caution flags. For any rally to be sustained it is critical for there to be healthy leadership, so it encouraging to see many stocks hitting new 52-week highs.
The Dow lost 30 points to 15,963 while the S&P 500 Index closed virtually unchanged at 1,819. The NASDAQ advanced 10 points to 4,201. The major averages took a breather after a four-day advance as investors digested the latest economic data and monetary policy comments. China's exports unexpectedly jumped +10.6% in January from a year earlier, topping expectations for a gain of +0.1%. On our shores, Fed Chair Janet Yellen's comments during Tuesday's Congressional hearing were reinforced by regional president James Bullard. He said the tapering of bond purchases will likely continue as the economy continues to grow in 2014. Additionally, the government posted a smaller than expected budget deficit last month.
Overall, six of the 10 S&P 500 sectors declined. The consumer staples group gave up the most ground. Procter & Gamble (PG -1.71%) fell after cutting its full-year sales and earnings outlook. Utility and energy stocks added to the downside as Spectra Energy (SE -1.38%) and Chevron (CVX -0.49) fell. However, those losses were offset by gains in technology and industrials including Qualcomm (QCOM +1.06%) and Caterpillar (CAT +1.27%).
Treasury prices declined for a second day and a government auction of 10-year notes drew less-than-average demand. The 10-year note fell 9/32 to yield 2.76%. The 30-year bond lost 18/32 to yield 3.72%.
The CANSLIM.net Featured Stocks Page shows the most action-worthy candidates and their latest notes and a Headline Link directs members to the latest detailed analysis with data-packed graphs annotated by a Certified expert along with links to additional resources. The Premium Member Homepage includes "dynamic archives" to all prior pay reports published. Watch for an announcement via email concerning the next WEBCAST.
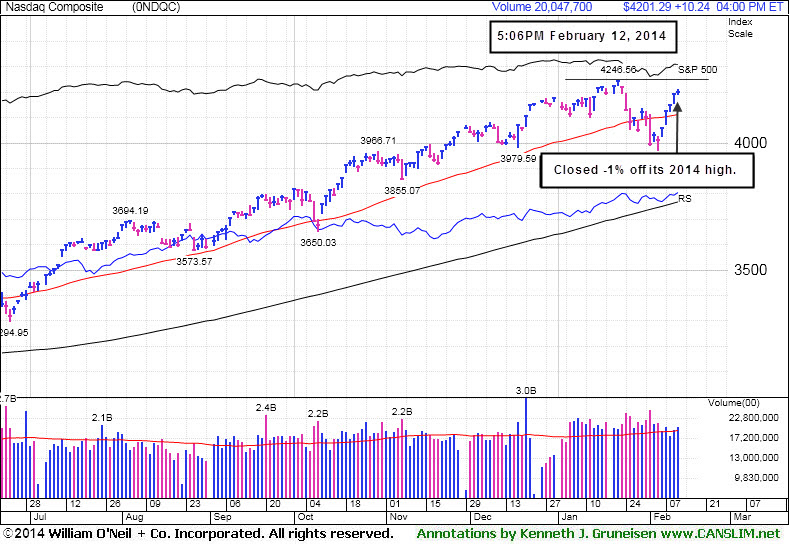
PICTURED: The Nasdaq Composite Index rebounded further above its 50-day moving average (DMA) line, showing healthier action as it finished -1% off its 2014 high. The Dow Jones Industrial Average is the only one of the 3 major averages which has not yet rebounded above its respective 50 DMA line.
|
 Kenneth J. Gruneisen started out as a licensed stockbroker in August 1987, a couple of months prior to the historic stock market crash that took the Dow Jones Industrial Average down -22.6% in a single day. He has published daily fact-based fundamental and technical analysis on high-ranked stocks online for two decades. Through FACTBASEDINVESTING.COM, Kenneth provides educational articles, news, market commentary, and other information regarding proven investment systems that work in good times and bad.
Comments contained in the body of this report are technical opinions only and are not necessarily those of Gruneisen Growth Corp. The material herein has been obtained from sources believed to be reliable and accurate, however, its accuracy and completeness cannot be guaranteed. Our firm, employees, and customers may effect transactions, including transactions contrary to any recommendation herein, or have positions in the securities mentioned herein or options with respect thereto. Any recommendation contained in this report may not be suitable for all investors and it is not to be deemed an offer or solicitation on our part with respect to the purchase or sale of any securities. |
|
 |
Semiconductor Index Led Techs; Retreat for Gold & Silver Index
Kenneth J. Gruneisen - Passed the CAN SLIM® Master's Exam
The Semiconductor Index ($SOX +0.85%) led the tech sector higher while the Biotechnology Index ($BTK +0.42%) and the Networking Index ($NWX +0.18%) posted smaller gains. The Retail Index ($RLX -0.37%) and Bank Index ($BKX -0.18%) both edged lower while the Broker/Dealer Index ($XBD +0.32%) posted a small gain. Energy-related shares edged lower as the Oil Services Index ($OSX -0.27%) and Integrated Oil Index ($XOI -0.21%) ended with small losses. The Gold & Silver Index ($XAU -2.76%) was a standout decliner.
Charts courtesy www.stockcharts.com
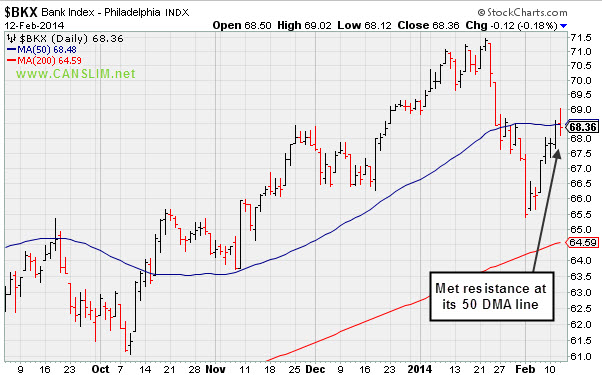
PICTURED: The Bank Index ($BKX -0.18%) met resistance at its 50-day moving average (DMA) line.
| Oil Services |
$OSX |
268.76 |
-0.73 |
-0.27% |
-4.37% |
| Integrated Oil |
$XOI |
1,425.39 |
-2.98 |
-0.21% |
-5.17% |
| Semiconductor |
$SOX |
549.48 |
+4.62 |
+0.85% |
+2.70% |
| Networking |
$NWX |
341.23 |
+0.60 |
+0.18% |
+5.34% |
| Broker/Dealer |
$XBD |
155.69 |
+0.49 |
+0.32% |
-3.03% |
| Retail |
$RLX |
888.66 |
-3.27 |
-0.37% |
-5.44% |
| Gold & Silver |
$XAU |
95.95 |
-2.72 |
-2.76% |
+14.02% |
| Bank |
$BKX |
68.36 |
-0.12 |
-0.18% |
-1.30% |
| Biotech |
$BTK |
2,625.63 |
+11.06 |
+0.42% |
+12.67% |
|
|
|
 |
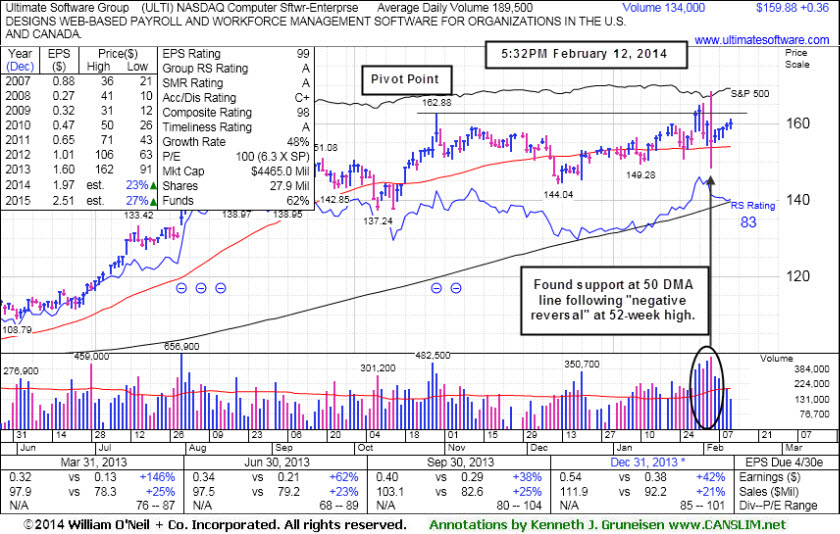
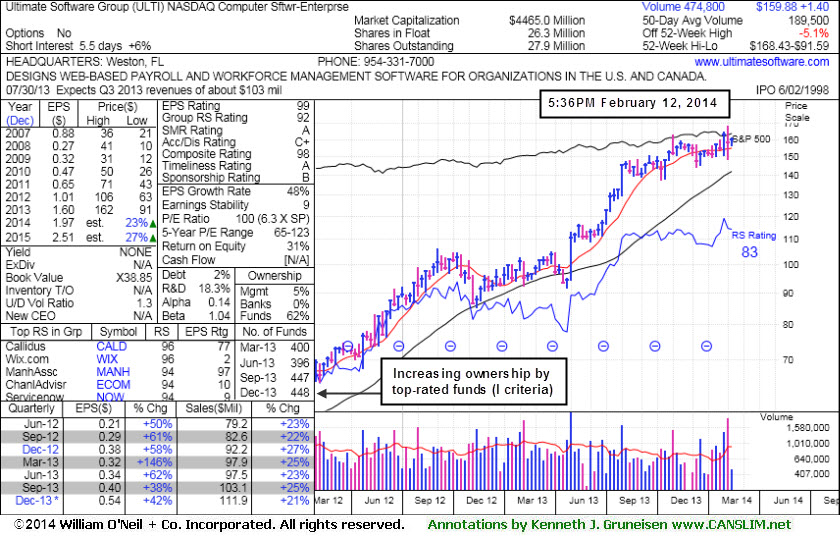
Stalled and Encountering Distributional Pressure
Kenneth J. Gruneisen - Passed the CAN SLIM® Master's Exam
Ultimate Software Group (ULTI +$0.36 or +0.23% to $159.88) has been consolidating above its 50-day moving average (DMA) line, holding its ground following a "negative reversal" on 2/05/14 and an earlier negative reversal on 2/03/14. Fundamentals remain strong after solid Dec '13 earnings up +42% on +21% sales revenues, continuing its strong earnings history satisfying the C and A criteria. Its last appearance in this FSU section was on 1/27/14 under the headline, "Forming New Base But Enduring Distributional Pressure", while testing support at its 50-day moving average (DMA) line. A new pivot point was cited based on its 10/30/13 high plus 10 cents. Subsequent volume-driven gains above the pivot point triggered a proper technical buy signal, however it soon stalled and it has clearly encountered distributional pressure. Subsequent deterioration below the 50 DMA line would trigger technical sell signals and raise concerns.
The Computer Software - Enterprise firm's Relative Strength rating of 83 now, above 80+ minimum level for buy candidates. The number of top-rated funds owning its shares rose from 395 in Dec '12 to 448 funds as of Dec '13, a reassuring trend in place concerning the I criteria. Its small supply of only 26.3 million shares (S criteria) in the public float can contribute to greater price volatility in the event of institutional buying or selling. Disciplined investors avoid chasing stocks extended more than +5% above prior highs and always limit losses by selling if any stock falls more than -7% from their purchase price.
|
|
|
Color Codes Explained :
Y - Better candidates highlighted by our
staff of experts.
G - Previously featured
in past reports as yellow but may no longer be buyable under the
guidelines.
***Last / Change / Volume data in this table is the closing quote data***
Symbol/Exchange
Company Name
Industry Group |
PRICE |
CHANGE
(%Change) |
Day High |
Volume
(% DAV)
(% 50 day avg vol) |
52 Wk Hi
% From Hi |
Featured
Date |
Price
Featured |
Pivot Featured |
|
Max Buy |
EQM
-
NYSE
E Q T Midstream Partners
ENERGY - Oil and Gas Pipelines
|
$66.69
|
+0.67
1.01% |
$67.80
|
177,630
172.46% of 50 DAV
50 DAV is 103,000
|
$67.37
-1.01%
|
12/12/2013
|
$53.17
|
PP = $56.51
|
|
MB = $59.34
|
Most Recent Note - 2/7/2014 6:11:38 PM
G - Hit a new 52-week high today. It is extended from any sound base pattern. Prior highs in the $56 area define support to watch on pullbacks. See the latest FSU analysis for more details and new annotated graphs.
>>> FEATURED STOCK ARTICLE : Leader Still Extended From Any Sound Base - 2/7/2014
View all notes |
Set NEW NOTE alert |
CANSLIM.net Company Profile |
SEC
News |
Chart |
Request a new note
C
A N
S L
I M


|
FB
-
NASDAQ
Facebook Inc Cl A
INTERNET
|
$64.45
|
-0.40
-0.62% |
$65.06
|
47,274,590
73.65% of 50 DAV
50 DAV is 64,187,000
|
$65.00
-0.85%
|
12/12/2013
|
$51.40
|
PP = $54.93
|
|
MB = $57.68
|
 Most Recent Note - 2/12/2014 1:27:19 PM
G - Color code is changed to green after getting extended beyond the "secondary buy point" recently noted. Prior highs near $58 define important near-term support to watch on pullbacks.
>>> FEATURED STOCK ARTICLE : Volume Totals Cooling While Holding Ground at Highs - 2/6/2014
View all notes |
Set NEW NOTE alert |
CANSLIM.net Company Profile |
SEC
News |
Chart |
Request a new note
C
A N
S L
I M
|
JAZZ
-
NASDAQ
Jazz Pharmaceuticals Plc
DRUGS - Biotechnology
|
$159.39
|
+3.25
2.08% |
$163.68
|
1,212,571
136.09% of 50 DAV
50 DAV is 891,000
|
$159.14
0.16%
|
9/30/2013
|
$93.20
|
PP = $89.10
|
|
MB = $93.56
|
Most Recent Note - 2/12/2014 1:29:08 PM
G - Hitting new 52-week and all-time highs with today's 4th consecutive gain. It is extended from any sound base. Its 50 DMA line and recent lows in the $135 area define important support to watch on pullbacks.
>>> FEATURED STOCK ARTICLE : Consolidating After Getting Very Extended - 2/5/2014
View all notes |
Set NEW NOTE alert |
CANSLIM.net Company Profile |
SEC
News |
Chart |
Request a new note
C
A N
S L
I M
|
KORS
-
NYSE
Michael Kors Hldgs Ltd
RETAIL - Apparel Stores
|
$96.01
|
-0.21
-0.22% |
$97.78
|
2,358,789
57.74% of 50 DAV
50 DAV is 4,085,000
|
$96.60
-0.61%
|
2/4/2014
|
$90.92
|
PP = $84.68
|
|
MB = $88.91
|
Most Recent Note - 2/12/2014 1:22:37 PM
G - Hit another new 52-week high today then reversed into the red. Color code is changed to green after rising beyond its "max buy" level and getting extended from its prior base. Prior highs in the $84 area define the nearest chart support level.
>>> FEATURED STOCK ARTICLE : Down on Higher Volume Ahead of Quarterly Earnings Report - 2/3/2014
View all notes |
Set NEW NOTE alert |
CANSLIM.net Company Profile |
SEC
News |
Chart |
Request a new note
C
A N
S L
I M
|
PCLN
-
NASDAQ
Priceline.com Inc
INTERNET - Internet Software and Services
|
$1,246.64
|
+32.71
2.69% |
$1,249.60
|
1,145,804
191.93% of 50 DAV
50 DAV is 597,000
|
$1,215.95
2.52%
|
12/18/2013
|
$1,156.20
|
PP = $1,198.85
|
|
MB = $1,258.79
|
Most Recent Note - 2/12/2014 12:40:07 PM
Y - Hitting a new 52-week high with today's 5th consecutive gain and no resistance remains due to overhead supply. Color code was changed to yellow after proving resilient and rebounding above its 50 DMA line, but no new pivot point was cited.
>>> FEATURED STOCK ARTICLE : Violation of 50-Day Average After Failing to Trigger New Buy Signal - 1/29/2014
View all notes |
Set NEW NOTE alert |
CANSLIM.net Company Profile |
SEC
News |
Chart |
Request a new note
C
A N
S L
I M
|
Symbol/Exchange
Company Name
Industry Group |
PRICE |
CHANGE
(%Change) |
Day High |
Volume
(% DAV)
(% 50 day avg vol) |
52 Wk Hi
% From Hi |
Featured
Date |
Price
Featured |
Pivot Featured |
|
Max Buy |
RGR
-
NYSE
Sturm Ruger & Co Inc
CONSUMER DURABLES - Sporting Goods
|
$73.65
|
-0.55
-0.74% |
$74.78
|
135,234
36.26% of 50 DAV
50 DAV is 373,000
|
$85.93
-14.29%
|
1/8/2014
|
$78.87
|
PP = $80.38
|
|
MB = $84.40
|
Most Recent Note - 2/10/2014 1:57:28 PM
G- Today's 3rd consecutive gain on light volume has it rebounding near its 50 DMA line which may now act as resistance. Faces overhead supply up through the $85 level after recent distributional action.
>>> FEATURED STOCK ARTICLE : Slumped Into Prior Base Negating Breakout and Violated 50-Day Average - 2/4/2014
View all notes |
Set NEW NOTE alert |
CANSLIM.net Company Profile |
SEC
News |
Chart |
Request a new note
C
A N
S L
I M
|
SFUN
-
NYSE
Soufun Hldgs Ltd Ads A
INTERNET - Internet Information Providers
|
$77.82
|
-0.20
-0.26% |
$78.80
|
5,056,774
377.09% of 50 DAV
50 DAV is 1,341,000
|
$95.39
-18.42%
|
10/17/2013
|
$58.02
|
PP = $53.87
|
|
MB = $56.56
|
Most Recent Note - 2/10/2014 5:45:03 PM
G - Traded above its 50 DMA line intra-day but encountered resistance and finished in the lower half of the session's range. A rebound above that short-term average is needed to help its outlook improve.
>>> FEATURED STOCK ARTICLE : 50-Day Moving Average Defines Near Term Support After Great Rally - 1/31/2014
View all notes |
Set NEW NOTE alert |
CANSLIM.net Company Profile |
SEC
News |
Chart |
Request a new note
C
A N
S L
I M
|
SILC
-
NASDAQ
Silicom Ltd
COMPUTER HARDWARE - Networking andamp; Communication Dev
|
$65.82
|
+0.38
0.58% |
$66.14
|
82,849
133.63% of 50 DAV
50 DAV is 62,000
|
$65.64
0.27%
|
12/23/2013
|
$44.62
|
PP = $46.25
|
|
MB = $48.56
|
Most Recent Note - 2/12/2014 12:53:14 PM
G - Inching higher for another new 52-week high with today's 7th consecutive gain on ever-increasing volume. Extended from any sound base while on track for a 9th consecutive weekly gain. See the latest FSU analysis for more details and new annotated graphs.
>>> FEATURED STOCK ARTICLE : Stubbornly Held Ground Following Breakaway Gap - 2/11/2014
View all notes |
Set NEW NOTE alert |
CANSLIM.net Company Profile |
SEC
News |
Chart |
Request a new note
C
A N
S L
I M
|
ULTI
-
NASDAQ
Ultimate Software Group
INTERNET - Internet Software and Services
|
$159.88
|
+0.36
0.23% |
$161.20
|
134,047
70.92% of 50 DAV
50 DAV is 189,000
|
$168.43
-5.08%
|
1/27/2014
|
$153.75
|
PP = $162.98
|
|
MB = $171.13
|
Most Recent Note - 2/12/2014 6:12:24 PM
Y - Consolidating above its 50 DMA line, holding its ground following a "negative reversal" on 2/05/14. Fundamentals remain strong after solid Dec '13 earnings. See the latest FSU analysis for more details and new annotated graphs.
>>> FEATURED STOCK ARTICLE : Stalled and Encountering Distributional Pressure - 2/12/2014
View all notes |
Set NEW NOTE alert |
CANSLIM.net Company Profile |
SEC
News |
Chart |
Request a new note
C
A N
S L
I M
|
VRX
-
NYSE
Valeant Pharmaceuticals
DRUGS - Drug Manufacturers - Other
|
$140.77
|
-0.54
-0.38% |
$142.82
|
1,310,185
101.41% of 50 DAV
50 DAV is 1,292,000
|
$142.45
-1.18%
|
9/11/2013
|
$100.26
|
PP = $105.50
|
|
MB = $110.78
|
Most Recent Note - 2/10/2014 1:59:16 PM
G - Hovering quietly near all-time highs, extended from any sound base. Its 50 DMA line ($122) defines near-term support to watch.
>>> FEATURED STOCK ARTICLE : Hovering Near All-Time Highs Extended From Sound Base - 2/10/2014
View all notes |
Set NEW NOTE alert |
CANSLIM.net Company Profile |
SEC
News |
Chart |
Request a new note
C
A N
S L
I M
|
Symbol/Exchange
Company Name
Industry Group |
PRICE |
CHANGE
(%Change) |
Day High |
Volume
(% DAV)
(% 50 day avg vol) |
52 Wk Hi
% From Hi |
Featured
Date |
Price
Featured |
Pivot Featured |
|
Max Buy |
|
|
|
THESE ARE NOT BUY RECOMMENDATIONS!
Comments contained in the body of this report are technical
opinions only. The material herein has been obtained
from sources believed to be reliable and accurate, however,
its accuracy and completeness cannot be guaranteed.
This site is not an investment advisor, hence it does
not endorse or recommend any securities or other investments.
Any recommendation contained in this report may not
be suitable for all investors and it is not to be deemed
an offer or solicitation on our part with respect to
the purchase or sale of any securities. All trademarks,
service marks and trade names appearing in this report
are the property of their respective owners, and are
likewise used for identification purposes only.
This report is a service available
only to active Paid Premium Members.
You may opt-out of receiving report notifications
at any time. Questions or comments may be submitted
by writing to Premium Membership Services 665 S.E. 10 Street, Suite 201 Deerfield Beach, FL 33441-5634 or by calling 1-800-965-8307
or 954-785-1121.
|
|
|

