You are not logged in.
This means you
CAN ONLY VIEW reports that were published prior to Sunday, October 27, 2024.
You
MUST UPGRADE YOUR MEMBERSHIP if you want to see any current reports.
AFTER MARKET UPDATE - FRIDAY, FEBRUARY 12TH, 2010
Previous After Market Report Next After Market Report >>>
|
|
|
|
DOW |
-45.05 |
10,099.14 |
-0.44% |
|
Volume |
1,427,248,220 |
+33% |
|
Volume |
2,331,306,100 |
+8% |
|
NASDAQ |
+6.12 |
2,183.53 |
+0.28% |
|
Advancers |
1,607 |
52% |
|
Advancers |
1,579 |
56% |
|
S&P 500 |
-2.96 |
1,075.51 |
-0.27% |
|
Decliners |
1,387 |
45% |
|
Decliners |
1,080 |
39% |
|
Russell 2000 |
+5.26 |
610.72 |
+0.87% |
|
52 Wk Highs |
63 |
|
|
52 Wk Highs |
54 |
|
|
S&P 600 |
+2.58 |
324.05 |
+0.80% |
|
52 Wk Lows |
7 |
|
|
52 Wk Lows |
17 |
|
|
 |
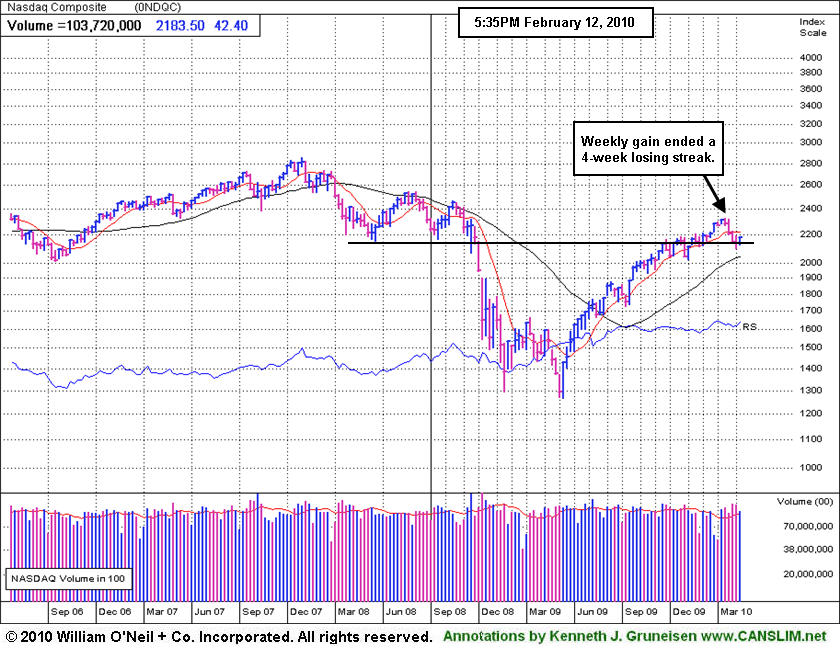
Indices' Weekly Gains Halt 4-Week Losing Streak
Adam Sarhan, Contributing Writer,
Heading into a three-day weekend, the major averages snapped a four week losing streak. While the EU said it will help Greece with its ballooning budget deficits, investors were rattled by news that China ordered its banks to set aside more money for reserves. This fanned concerns that global growth may slow as China battles inflation. Friday's mixed session was marked by higher volume totals on both exchanges. Advancers led decliners by a 3-to-2 ratio on the Nasdaq exchange and by a narrow 8-to-7 margin on the NYSE. New 52-week highs outnumbered new lows on both exchanges. There were 18 high-ranked companies from the CANSLIM.net Leaders List that made a new 52-week high and appeared on the CANSLIM.net BreakOuts Page, up from the 13 issues that appeared on the prior session.
Stocks closed lower on Monday after concern spread that several European countries may default on their debt. Greece, Spain and Portugal are the three primary suspects for the latest sovereign debt crisis. The primary concern is that these countries will need outside assistance to stay afloat as they make their way through the worst recession since WWII. Meanwhile, the Congressional Budget Office expects America’s debt to reach +65% of US GDP this year which would still be below the +77% of GDP the European Commission expects for Germany, U.K. is running closer to +80% and Japan is in the lead with a whopping +180%.
Stocks enjoyed sharp gains on Tuesday as the US dollar fell on speculation that Greece will receive European aid to tackle its massive budget deficit. European Central Bank President, Jean-Claude Trichet, unexpectedly left a meeting in Sydney one day ahead of schedule and returned to Europe to discuss this issue. In related news, European Commission President Jose Barroso supported the euro when he directly said that investors would be wrong to bet against it.Stocks closed slightly lower on Wednesday as the world awaited the EU's decision.
On Thursday, the EU stepped up and said they would help Greece tackle the worst economic crisis the continent has experienced since the euro was established over 11 years ago. It is important to note that Portugal and Spain's growing budget deficits have yet to be addressed, which could come back and haunt the EU later this year.
Domestically, the Labor Department said that weekly jobless claims unexpectedly dropped last week. The weaker than expected report is a net positive for the ailing jobs market and bodes well for the economy.
Looking at the market, as long as last Friday's lows are not breached the window remains open for a new follow-through day (FTD) to emerge. A new follow-through day will confirm the current rally attempt and will be produced when one of the major averages rallies at least +1.7% on higher volume than the prior session as a new batch of leaders breakout of sound bases. However, if last Friday's (2/05/10) lows are breached then the day count will be reset and a steeper correction may unfold.
It is also important to see how the major averages react to their respective 50-day moving average (DMA) lines which were support and are now acting as resistance. Until they all close above that important level the technical damage remaining on the charts is a concern. So far, the market's reaction has been tepid at best to the latest round of economic and earnings data which remains a concern. Remember that the market remains in a correction until a new new follow-through day emerges. Until then, patience is paramount.
Professional Money Management Services - A Winning System - Inquire today!
Our skilled team of portfolio managers knows how to follow the rules of this fact-based investment system. We do not follow opinion or the "conviction list" of some large Wall Street institution which would have us fully invested even during horrific bear markets. Instead, we remain fluid and only buy the best stocks when they are triggering proper technical buy signals. If you are not completely satisfied with the way your portfolio is being managed, Click here to email one of our portfolio managers. *Accounts over $250,000 please. ** Serious inquires only, please.
PICTURED: The Nasdaq Composite Index posted a weekly gain, ending a 4-week losing streak and trying to make a stand. Not long ago it was making headway above its March - July 2008 lows, which was an encouraging sign. That area may now serve as a support level, however, any breach of recent lows would be an ominous sign and would kill the latest rally attempt.
|
|
|
 |
Tech Strength Helps Nasdaq Composite Index Outpace Peers
Kenneth J. Gruneisen - Passed the CAN SLIM® Master's Exam
Modest gains from the Semiconductor Index ($SOX +0.54%) and Biotechnology Index ($BTK +1.11%) were enough to help the Nasdaq Composite Index and small-cap indices close Friday's session with small gains while the S&P 500 Index and Dow Jones Industrial Average ended slightly in the red. The Broker/Dealer Index ($XBD +0.76%) posted a small gain while the Bank Index ($BKX -0.84%) suffered a similar sized loss. Defensive groups had a negative bias as the Healthcare Index ($HMO -1.30%), Gold & Silver Index ($XAU -0.69%), Integrated Oil Index ($XOI -0.80%), and Oil Services Index ($OSX -0.80%) slumped. The Retail Index ($RLX +0.04%), Networking Index ($NWX +0.09%), and Internet Index ($IIX +0.09%) ended virtually unchanged.
Charts courtesy www.stockcharts.com
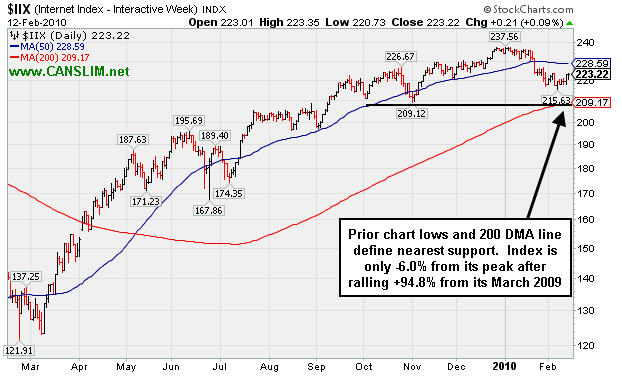
PICTURED: The Internet Index ($IIX +0.09%) slumped under its 50-day moving average (DMA) line during the current market correction. Prior chart lows and its 200 DMA line define the nearest support. This Index is only -6.0% from its peak after rallying +94.8% from its March 2009 low.
| Oil Services |
$OSX |
195.90 |
-1.57 |
-0.80% |
+0.50% |
| Healthcare |
$HMO |
1,397.09 |
-18.38 |
-1.30% |
-5.15% |
| Integrated Oil |
$XOI |
1,014.02 |
-8.16 |
-0.80% |
-5.07% |
| Semiconductor |
$SOX |
332.84 |
+1.80 |
+0.54% |
-7.52% |
| Networking |
$NWX |
226.95 |
+0.20 |
+0.09% |
-1.78% |
| Internet |
$IIX |
223.22 |
+0.21 |
+0.09% |
-4.55% |
| Broker/Dealer |
$XBD |
111.60 |
+0.84 |
+0.76% |
-3.00% |
| Retail |
$RLX |
399.50 |
+0.14 |
+0.04% |
-2.83% |
| Gold & Silver |
$XAU |
159.60 |
-1.11 |
-0.69% |
-5.14% |
| Bank |
$BKX |
44.69 |
-0.38 |
-0.84% |
+4.64% |
| Biotech |
$BTK |
992.18 |
+10.89 |
+1.11% |
+5.31% |
|
|
|
 |
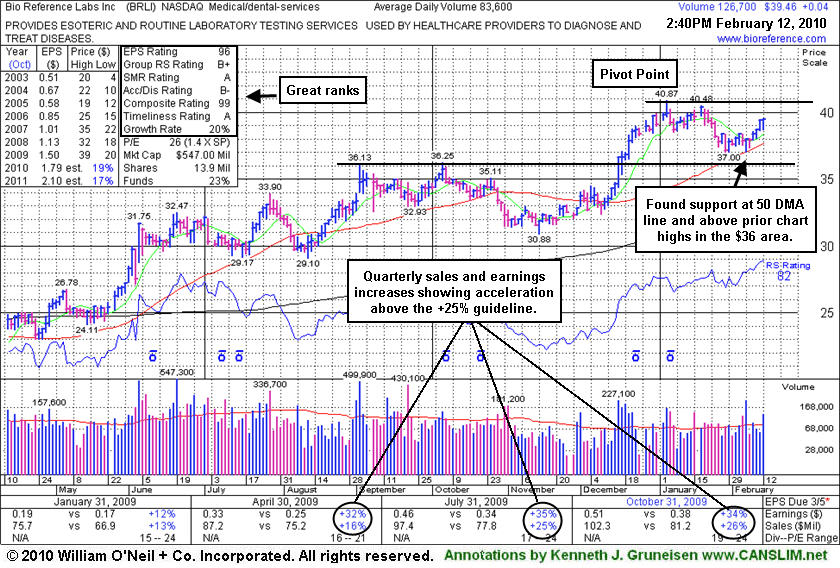
High-Ranked Medical Firm Basing Above 50-Day Average Line
Kenneth J. Gruneisen - Passed the CAN SLIM® Master's Exam
Bio-Reference Laboratories, Inc. (BRLI +$0.01 or +0.03% to $39.43) is perched less than -4% from its 52-week high, consolidating for at least 5-weeks above support at its 50-day moving average (DMA) line. It was featured in yellow in today's mid-day report (read here). Very little resistance remains due to overhead supply. Earnings growth and sales revenues growth has accelerated, with increases better than the +25% minimum guideline in recent quarters. Fundamentals are favorable with respect to the C and A criteria. The high-ranked Medical/Dental Services firm has only 13.9 million shares outstanding (S criteria) and has average daily volume under 100,000 shares, which could contribute to greater price volatility in the event of more decisive institutional buying or selling. The number of top-rated funds owning its shares rose from 77 in Mar '09 to 87 in Dec '09 which is somewhat reassuring in regard to the I criteria of the investment system. Gains above its pivot point with at least +50% above average volume could trigger a technical buy signal, however, the M criteria is an overriding concern until a follow-through-day occurs.
|
|
|
Color Codes Explained :
Y - Better candidates highlighted by our
staff of experts.
G - Previously featured
in past reports as yellow but may no longer be buyable under the
guidelines.
***Last / Change / Volume quote data in this table corresponds with the timestamp on the note***
Symbol/Exchange
Company Name
Industry Group |
Last |
Chg. |
Vol
% DAV |
Date Featured |
Price Featured |
Latest Pivot Point
Featured |
Status |
| Latest Max Buy Price |
ARST
-
|
$25.96
|
+0.42
|
221,521
46% DAV
481,300
|
12/22/2009
(Date
Featured) |
$25.94
(Price
Featured) |
PP = $27.20 |
G |
| MB = $28.56 |
Most Recent Note - 2/12/2010 5:07:09 PM
G - Posted a 4th consecutive gain today with very light volume, yet a close above its 50 DMA line helped its technical stance improve. Important support to watch now is its recent low ($22.58) and prior chart lows in the $22 area. ARST was first featured in yellow at $19.91 in the 9/01/09 mid-day report with an annotated daily graph (read here).
>>> The latest Featured Stock Update with an annotated graph appeared on 2/4/2010. click here.
|
|
C
A
S
I |
News |
Chart |
SEC
View all notes Alert
me of new notes
Company
Profile
|
BIDU
- NASDAQ
Baidu Inc Ads
INTERNET - Internet Information Providers
|
$488.00
|
+0.54
|
1,213,360
62% DAV
1,955,900
|
1/13/2010
(Date
Featured) |
$431.25
(Price
Featured) |
PP = $426.75 |
G |
| MB = $448.09 |
Most Recent Note - 2/12/2010 5:09:04 PM
G - Holding its ground at all-time highs. After reporting earnings and raising guidance it gapped up on 2/10/10 for a considerable gain with volume more than 3 times average.
>>> The latest Featured Stock Update with an annotated graph appeared on 2/11/2010. click here.
|
|
C
A
S
I |
News |
Chart |
SEC
View all notes Alert
me of new notes
Company
Profile
|
BRLI
- NASDAQ
Bio Reference Labs Inc
HEALTH SERVICES - Medical Laboratories & Researc
|
$39.43
|
+0.01
|
159,406
191% DAV
83,600
|
2/12/2010
(Date
Featured) |
$39.02
(Price
Featured) |
PP = $40.97 |
Y |
| MB = $43.02 |
Most Recent Note - 2/12/2010 5:13:34 PM
Y - Perched less than -4% from its 52-week high, consolidating for 5-weeks above support at its 50 DMA line. It was featured in yellow in today's mid-day report (read here). Very little resistance remains due to overhead supply. Earnings growth and sales revenues growth has accelerated, better than the +25% minimum guideline in recent quarters. Fundamentals are favorable with respect to the C and A criteria.
>>> The latest Featured Stock Update with an annotated graph appeared on 2/12/2010. click here.
|
|
C
A
S
I |
News |
Chart |
SEC
View all notes Alert
me of new notes
Company
Profile
|
CACC
- NASDAQ
Credit Acceptance Corp
FINANCIAL SERVICES - Credit Services
|
$39.89
|
-0.30
|
33,353
53% DAV
63,200
|
9/29/2009
(Date
Featured) |
$33.48
(Price
Featured) |
PP = $37.10 |
G |
| MB = $38.96 |
Most Recent Note - 2/12/2010 5:16:06 PM
G - Following a streak of losses it is trading just above prior chart highs in the $37 area which may act as support. Concerns were recently raised and sell signals triggered when this high-ranked Financial firm violated its 50 DMA line.
>>> The latest Featured Stock Update with an annotated graph appeared on 2/9/2010. click here.
|
|
C
A
S
I |
News |
Chart |
SEC
View all notes Alert
me of new notes
Company
Profile
|
CRM
- NYSE
Salesforce.com Inc
INTERNET - Internet Software & Services
|
$65.09
|
-0.87
|
2,037,252
109% DAV
1,862,100
|
12/18/2009
(Date
Featured) |
$67.32
(Price
Featured) |
PP = $67.82 |
G |
| MB = $71.21 |
Most Recent Note - 2/12/2010 5:18:44 PM
G - Rebounded a bit this week, but remains below its 50 DMA line. Gains above that short-term average are needed for its outlook to improve. Technically, the recent chart low ($60.30 on 2/05/10) is an important support level to watch.
>>> The latest Featured Stock Update with an annotated graph appeared on 2/10/2010. click here.
|
|
C
A
S
I |
News |
Chart |
SEC
View all notes Alert
me of new notes
Company
Profile
|
GMCR
- NASDAQ
Green Mtn Coffee Roastrs
FOOD & BEVERAGE - Processed & Packaged Goods
|
$83.71
|
+0.69
|
928,401
61% DAV
1,516,600
|
12/28/2009
(Date
Featured) |
$77.49
(Price
Featured) |
PP = $76.50 |
G |
| MB = $80.33 |
Most Recent Note - 2/12/2010 5:21:25 PM
G - Quietly consolidated in a tight trading range for the past week, basing action above its 50 DMA line and within close striking range of its 52-week high. Important initial support level to watch is recent lows in the $78 area.
>>> The latest Featured Stock Update with an annotated graph appeared on 2/2/2010. click here.
|
|
C
A
S
I |
News |
Chart |
SEC
View all notes Alert
me of new notes
Company
Profile
|
ISRG
- NASDAQ
Intuitive Surgical Inc
HEALTH SERVICES - Medical Appliances & Equipment
|
$331.82
|
+2.05
|
403,365
78% DAV
514,800
|
1/22/2010
(Date
Featured) |
$340.40
(Price
Featured) |
PP = $314.00 |
G |
| MB = $329.70 |
Most Recent Note - 2/12/2010 5:22:36 PM
G - Small gain with below average volume today. Consolidating above its 50 DMA line and prior chart highs in the $314 area that define important technical support. ISRG was featured again most recently in the 1/22/10 mid-day report (read here).
>>> The latest Featured Stock Update with an annotated graph appeared on 2/5/2010. click here.
|
|
C
A
S
I |
News |
Chart |
SEC
View all notes Alert
me of new notes
Company
Profile
|
PEGA
- NASDAQ
Pegasystems Inc
COMPUTER SOFTWARE & SERVICES - Business Software & Services
|
$35.46
|
-0.33
|
120,921
62% DAV
194,600
|
1/4/2010
(Date
Featured) |
$34.00
(Price
Featured) |
PP = $36.19 |
G |
| MB = $38.00 |
Most Recent Note - 2/12/2010 5:23:34 PM
G - Small loss on below average volume today after a small gap down. Consolidating in the $35-36 area that was a previously a stubborn resistance level. It remains in healthy shape above its 50 DMA line, but wider than usual intra-day price swings with higher volume in the prior 2 weeks with distributional action raised concerns.
>>> The latest Featured Stock Update with an annotated graph appeared on 2/8/2010. click here.
|
|
C
A
S
I |
News |
Chart |
SEC
View all notes Alert
me of new notes
Company
Profile
|
|
|
|
THESE ARE NOT BUY RECOMMENDATIONS!
Comments contained in the body of this report are technical
opinions only. The material herein has been obtained
from sources believed to be reliable and accurate, however,
its accuracy and completeness cannot be guaranteed.
This site is not an investment advisor, hence it does
not endorse or recommend any securities or other investments.
Any recommendation contained in this report may not
be suitable for all investors and it is not to be deemed
an offer or solicitation on our part with respect to
the purchase or sale of any securities. All trademarks,
service marks and trade names appearing in this report
are the property of their respective owners, and are
likewise used for identification purposes only.
This report is a service available
only to active Paid Premium Members.
You may opt-out of receiving report notifications
at any time. Questions or comments may be submitted
by writing to Premium Membership Services 665 S.E. 10 Street, Suite 201 Deerfield Beach, FL 33441-5634 or by calling 1-800-965-8307
or 954-785-1121.
|
|
|


