You are not logged in.
This means you
CAN ONLY VIEW reports that were published prior to Monday, March 10, 2025.
You
MUST UPGRADE YOUR MEMBERSHIP if you want to see any current reports.
AFTER MARKET UPDATE - TUESDAY, FEBRUARY 11TH, 2014
Previous After Market Report Next After Market Report >>>
|
|
|
|
DOW |
+192.98 |
15,994.77 |
+1.22% |
|
Volume |
696,672,560 |
+9% |
|
Volume |
1,876,621,040 |
+11% |
|
NASDAQ |
+42.87 |
4,191.04 |
+1.03% |
|
Advancers |
2,395 |
76% |
|
Advancers |
1,810 |
68% |
|
S&P 500 |
+19.91 |
1,819.75 |
+1.11% |
|
Decliners |
673 |
21% |
|
Decliners |
788 |
29% |
|
Russell 2000 |
+10.43 |
1,129.16 |
+0.93% |
|
52 Wk Highs |
92 |
|
|
52 Wk Highs |
98 |
|
|
S&P 600 |
+5.28 |
637.01 |
+0.84% |
|
52 Wk Lows |
18 |
|
|
52 Wk Lows |
14 |
|
|
 |
Major Averages Rose With Greater Volume Conviction
Kenneth J. Gruneisen - Passed the CAN SLIM® Master's Exam
The major averages staged a rally on Tuesday. Volume totals were reported higher than the prior trading session's volume totals on the Nasdaq exchange and on the NYSE, suggesting that institutional buying demand was on the rise. Breadth was positive as advancers led decliners by about a 7-2 ratio on the NYSE and 7-3 on the Nasdaq exchange. There were 54 high-ranked companies from the CANSLIM.net Leaders List that made new 52-week highs and appeared on the CANSLIM.net BreakOuts Page, up from the total of 26 stocks on the prior session. The list of stocks hitting new 52-week highs outnumbered new 52-week lows on the Nasdaq exchange and on the NYSE, an encouraging improvement. There were gains for 8 of the 10 high-ranked companies currently included on the Featured Stocks Page, a list that has recently been waning. The Market (M criteria) has a nascent rally attempt under way. Remember that for any rally to be sustained it is critical for there to be "healthy" leadership - many stocks hitting new 52-week highs.
The Dow gained 192 points to 15,994. The S&P 500 Index rose 19 points to 1819. The NASDAQ advanced 42 points to 4,191. Fed Chair Janet Yellen's first testimony to Congress was in focus. She said reductions in the central bank's bond purchases will probably continue even amid uneven employment growth and reiterated that interest rates will stay at record lows. Also from Capitol Hill, the House is expected to vote on legislation to raise the debt ceiling through March 2015 without added amendments or conditions.
As a result of the positive tone, every sector finished higher. Materials paced the advance. Mosaic (MOS +2.18%) rose after the company boosted its share repurchase program and said it expects record global shipments of potash this year. Energy stocks rose for a second day, led by Exxon Mobil's (XOM +1.33%). Telecommunication and consumer stocks also helped lift the market. Sprint (S +2.73%) and CVS Caremark (CVS +2.61%) rose after both companies posted better than projected earnings results. Rackspace (RAX -17.96%) tumbled in reaction to earnings and news its CEO was retiring.
Treasury prices declined and a government auction of three-year notes drew greater-than-average demand. The 10-year note fell 15/32 to yield 2.72%. The 30-year bond lost 22/32 to yield 3.69%. The CANSLIM.net Featured Stocks Page shows the most action-worthy candidates and their latest notes and a Headline Link directs members to the latest detailed analysis with data-packed graphs annotated by a Certified expert along with links to additional resources. The Premium Member Homepage includes "dynamic archives" to all prior pay reports published. Watch for an announcement via email concerning the next WEBCAST.
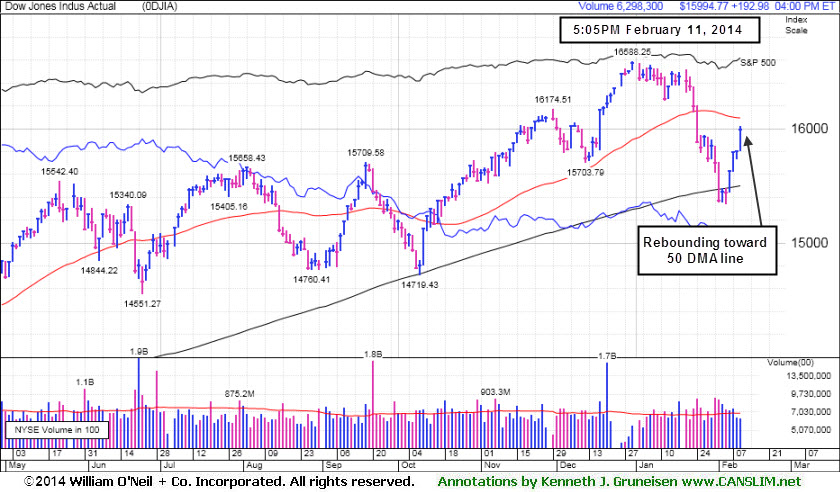
PICTURED: The Dow Jones Industrial Average rebounded near its 50-day moving average (DMA) line on Tuesday for what may be considered "Day 4" of a new rally attempt. Prior commentaries published here pointed out that last Wedneday's lows undercut Tuesday's lows for all of the major indices. Under the fact-based investment system it is most ideal for at least one of the major averages to produce as solid follow-through day (FTD) of big gains on higher volume between Days 4-7 of a new rally effort. Use caution and remain disciplined in following proper sell rules under the fact-based investment system.
|
 Kenneth J. Gruneisen started out as a licensed stockbroker in August 1987, a couple of months prior to the historic stock market crash that took the Dow Jones Industrial Average down -22.6% in a single day. He has published daily fact-based fundamental and technical analysis on high-ranked stocks online for two decades. Through FACTBASEDINVESTING.COM, Kenneth provides educational articles, news, market commentary, and other information regarding proven investment systems that work in good times and bad.
Comments contained in the body of this report are technical opinions only and are not necessarily those of Gruneisen Growth Corp. The material herein has been obtained from sources believed to be reliable and accurate, however, its accuracy and completeness cannot be guaranteed. Our firm, employees, and customers may effect transactions, including transactions contrary to any recommendation herein, or have positions in the securities mentioned herein or options with respect thereto. Any recommendation contained in this report may not be suitable for all investors and it is not to be deemed an offer or solicitation on our part with respect to the purchase or sale of any securities. |
|
 |
Gold & Silver Index Rallies Above 200-Day Average Amid Widespread Gains
Kenneth J. Gruneisen - Passed the CAN SLIM® Master's Exam
Commodity-linked groups rallied and the Gold & Silver Index ($XAU +3.81%) posted a big gain while the Integrated Oil Index ($XOI +1.63%) and the Oil Services Index ($OSX +2.23%) also rose. Gains in financial shares helped underpin the major averages' rally as the Bank Index ($BKX +0.94%) and Broker/Dealer Index ($XBD +0.96%) both tallied solid gains. The Biotechnology Index ($BTK +1.25%) and the Semiconductor Index ($SOX +1.27%) rose while the Networking Index ($NWX -0.55%) edged lower, meanwhile the Retail Index ($RLX +0.67%) posted a small gain.
Charts courtesy www.stockcharts.com
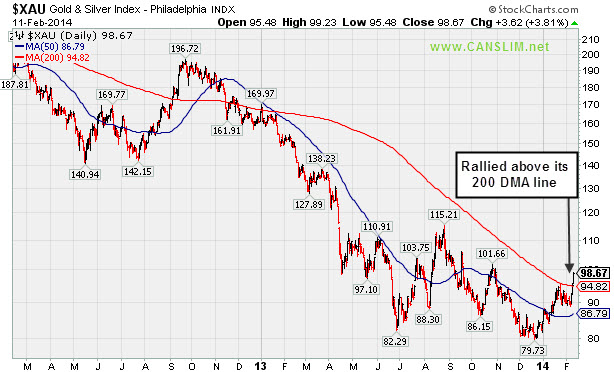
PICTURED: The Gold & Silver Index ($XAU +3.81%) has rallied above its 200-day moving average (DMA) line.
| Oil Services |
$OSX |
269.49 |
+5.89 |
+2.23% |
-4.11% |
| Integrated Oil |
$XOI |
1,428.37 |
+22.96 |
+1.63% |
-4.97% |
| Semiconductor |
$SOX |
544.86 |
+6.82 |
+1.27% |
+1.84% |
| Networking |
$NWX |
340.64 |
-1.87 |
-0.55% |
+5.15% |
| Broker/Dealer |
$XBD |
155.20 |
+1.47 |
+0.96% |
-3.34% |
| Retail |
$RLX |
891.93 |
+5.92 |
+0.67% |
-5.09% |
| Gold & Silver |
$XAU |
98.67 |
+3.62 |
+3.81% |
+17.25% |
| Bank |
$BKX |
68.48 |
+0.64 |
+0.94% |
-1.13% |
| Biotech |
$BTK |
2,614.57 |
+32.32 |
+1.25% |
+12.19% |
|
|
|
 |
Stubbornly Held Ground Following Breakaway Gap
Kenneth J. Gruneisen - Passed the CAN SLIM® Master's Exam
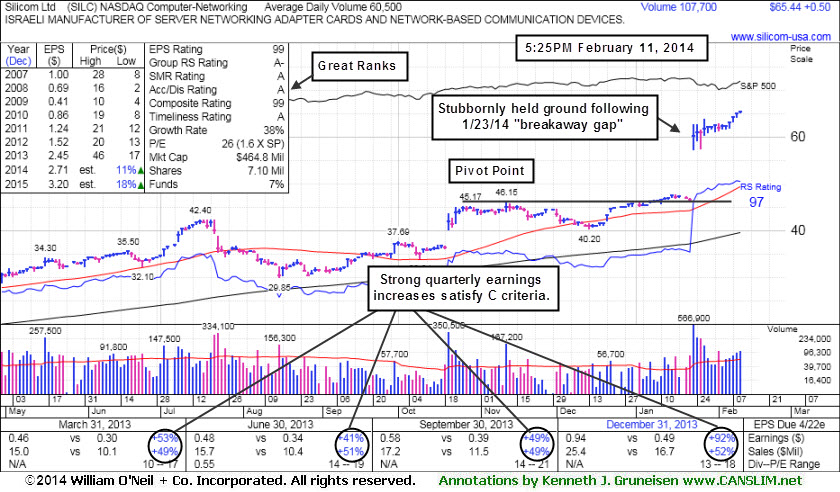
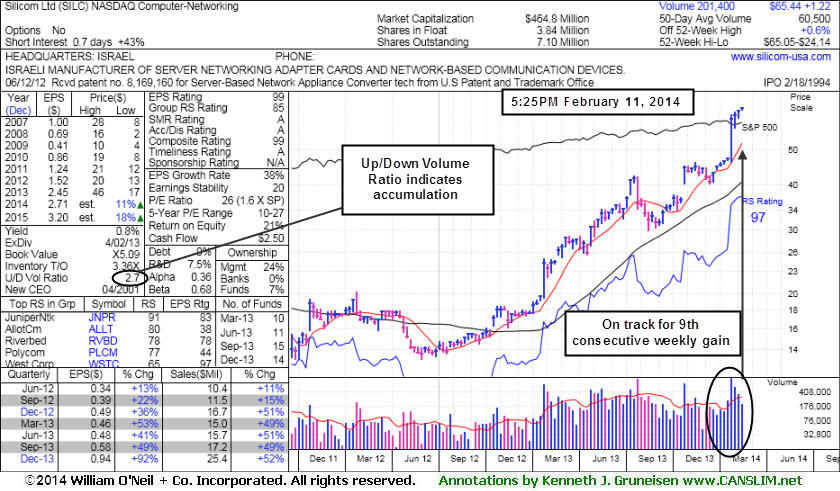
Silicom Ltd (SILC +$0.50 or +0.77% to $65.44) is hovering near its 52-week high, extended from any sound base while on track for a 9th consecutive weekly gain. It has been stubbornly holding its ground since last shown in this FSU section on 1/23/14 under the headline, "Considerable Gap Up Following Strong Earnings Report ". There was a considerable "breakaway gap" up on 1/23/14 after reporting earnings +92% on +52% sales for the Dec '13 quarter, beating consensus estimates and continuing its streak of strong quarterly earnings increases satisfying the C criteria.
After a downturn in FY '08 and '09 earnings its annual earnings (A criteria) history has shown strong and steady growth. Its small supply (S criteria) of only 3.93 million shares in the public float can contribute to greater price volatility in the event of institutional buying or selling. The number of top-rated funds owning its shares rose from 7 in Dec '12 to 14 in Dec '13, a reassuring sign concerning the I criteria. Its current Up/Down Volume Ratio of 2.7 is also an unbiased indication its shares have been under accumulation over the past 50 days."
|
|
|
Color Codes Explained :
Y - Better candidates highlighted by our
staff of experts.
G - Previously featured
in past reports as yellow but may no longer be buyable under the
guidelines.
***Last / Change / Volume data in this table is the closing quote data***
Symbol/Exchange
Company Name
Industry Group |
PRICE |
CHANGE
(%Change) |
Day High |
Volume
(% DAV)
(% 50 day avg vol) |
52 Wk Hi
% From Hi |
Featured
Date |
Price
Featured |
Pivot Featured |
|
Max Buy |
EQM
-
NYSE
E Q T Midstream Partners
ENERGY - Oil and Gas Pipelines
|
$66.02
|
+1.15
1.77% |
$67.37
|
137,134
134.45% of 50 DAV
50 DAV is 102,000
|
$65.83
0.29%
|
12/12/2013
|
$53.17
|
PP = $56.51
|
|
MB = $59.34
|
Most Recent Note - 2/7/2014 6:11:38 PM
G - Hit a new 52-week high today. It is extended from any sound base pattern. Prior highs in the $56 area define support to watch on pullbacks. See the latest FSU analysis for more details and new annotated graphs.
>>> FEATURED STOCK ARTICLE : Leader Still Extended From Any Sound Base - 2/7/2014
View all notes |
Set NEW NOTE alert |
CANSLIM.net Company Profile |
SEC
News |
Chart |
Request a new note
C
A N
S L
I M


|
FB
-
NASDAQ
Facebook Inc Cl A
INTERNET
|
$64.85
|
+1.30
2.05% |
$65.00
|
45,652,622
71.14% of 50 DAV
50 DAV is 64,174,000
|
$64.57
0.44%
|
12/12/2013
|
$51.40
|
PP = $54.93
|
|
MB = $57.68
|
Most Recent Note - 2/6/2014 5:56:26 PM
Y - Market conditions still argue against new buying efforts until a FTD from at least one of the major averages confirms a new rally. One may consider a valid secondary buy point up to $62.28, as previously noted. See the latest FSU analysis for more details and new annotated graphs.
>>> FEATURED STOCK ARTICLE : Volume Totals Cooling While Holding Ground at Highs - 2/6/2014
View all notes |
Set NEW NOTE alert |
CANSLIM.net Company Profile |
SEC
News |
Chart |
Request a new note
C
A N
S L
I M
|
JAZZ
-
NASDAQ
Jazz Pharmaceuticals Plc
DRUGS - Biotechnology
|
$156.14
|
+2.16
1.40% |
$157.28
|
1,037,422
118.16% of 50 DAV
50 DAV is 878,000
|
$159.14
-1.89%
|
9/30/2013
|
$93.20
|
PP = $89.10
|
|
MB = $93.56
|
Most Recent Note - 2/7/2014 12:21:19 PM
G - Rebounding near its 52-week high with a solid gain today. It is extended from any sound base and its 50 DMA line ($132.10 now) defines important support to watch on pullbacks.
>>> FEATURED STOCK ARTICLE : Consolidating After Getting Very Extended - 2/5/2014
View all notes |
Set NEW NOTE alert |
CANSLIM.net Company Profile |
SEC
News |
Chart |
Request a new note
C
A N
S L
I M
|
KORS
-
NYSE
Michael Kors Hldgs Ltd
RETAIL - Apparel Stores
|
$96.22
|
+0.66
0.69% |
$96.60
|
3,599,696
88.49% of 50 DAV
50 DAV is 4,068,000
|
$95.76
0.48%
|
2/4/2014
|
$90.92
|
PP = $84.68
|
|
MB = $88.91
|
Most Recent Note - 2/5/2014 12:29:08 PM
Y - Holding its ground at its 52-week high following a "breakaway gap" on the prior session new all-time highs. Reported strong +73% earnings on +59% sales revenues for the Dec '13 quarter, continuing its strong earnings record. Color code was changed to yellow with new pivot point cited based on its 12/19/13 high plus 10 cents. Considerable volume-driven gain triggered a technical buy signal, however the broader market (M criteria) environment still argues for caution until at least one of the major averages produces a solid follow-through day of gains on higher volume.
>>> FEATURED STOCK ARTICLE : Down on Higher Volume Ahead of Quarterly Earnings Report - 2/3/2014
View all notes |
Set NEW NOTE alert |
CANSLIM.net Company Profile |
SEC
News |
Chart |
Request a new note
C
A N
S L
I M
|
PCLN
-
NASDAQ
Priceline.com Inc
INTERNET - Internet Software and Services
|
$1,213.93
|
+6.11
0.51% |
$1,215.95
|
544,094
91.44% of 50 DAV
50 DAV is 595,000
|
$1,214.97
-0.09%
|
12/18/2013
|
$1,156.20
|
PP = $1,198.85
|
|
MB = $1,258.79
|
Most Recent Note - 2/7/2014 12:40:56 PM
Y - Rebounding above its 50 DMA line today with a gap up and considerable volume-driven gain. Color code is changed to yellow after proving resilient, but no new pivot point is being cited. Recent low ($1,103.90 on 2/05/14) defines near-term support to watch where further deterioration would raise greater concerns.
>>> FEATURED STOCK ARTICLE : Violation of 50-Day Average After Failing to Trigger New Buy Signal - 1/29/2014
View all notes |
Set NEW NOTE alert |
CANSLIM.net Company Profile |
SEC
News |
Chart |
Request a new note
C
A N
S L
I M
|
Symbol/Exchange
Company Name
Industry Group |
PRICE |
CHANGE
(%Change) |
Day High |
Volume
(% DAV)
(% 50 day avg vol) |
52 Wk Hi
% From Hi |
Featured
Date |
Price
Featured |
Pivot Featured |
|
Max Buy |
RGR
-
NYSE
Sturm Ruger & Co Inc
CONSUMER DURABLES - Sporting Goods
|
$74.20
|
-0.53
-0.71% |
$75.30
|
289,353
77.57% of 50 DAV
50 DAV is 373,000
|
$85.93
-13.65%
|
1/8/2014
|
$78.87
|
PP = $80.38
|
|
MB = $84.40
|
Most Recent Note - 2/10/2014 1:57:28 PM
G- Today's 3rd consecutive gain on light volume has it rebounding near its 50 DMA line which may now act as resistance. Faces overhead supply up through the $85 level after recent distributional action.
>>> FEATURED STOCK ARTICLE : Slumped Into Prior Base Negating Breakout and Violated 50-Day Average - 2/4/2014
View all notes |
Set NEW NOTE alert |
CANSLIM.net Company Profile |
SEC
News |
Chart |
Request a new note
C
A N
S L
I M
|
SFUN
-
NYSE
Soufun Hldgs Ltd Ads A
INTERNET - Internet Information Providers
|
$78.02
|
-0.81
-1.03% |
$80.65
|
1,942,890
147.08% of 50 DAV
50 DAV is 1,321,000
|
$95.39
-18.21%
|
10/17/2013
|
$58.02
|
PP = $53.87
|
|
MB = $56.56
|
Most Recent Note - 2/10/2014 5:45:03 PM
G - Traded above its 50 DMA line intra-day but encountered resistance and finished in the lower half of the session's range. A rebound above that short-term average is needed to help its outlook improve.
>>> FEATURED STOCK ARTICLE : 50-Day Moving Average Defines Near Term Support After Great Rally - 1/31/2014
View all notes |
Set NEW NOTE alert |
CANSLIM.net Company Profile |
SEC
News |
Chart |
Request a new note
C
A N
S L
I M
|
SILC
-
NASDAQ
Silicom Ltd
COMPUTER HARDWARE - Networking andamp; Communication Dev
|
$65.44
|
+0.50
0.77% |
$65.64
|
107,795
179.66% of 50 DAV
50 DAV is 60,000
|
$65.05
0.60%
|
12/23/2013
|
$44.62
|
PP = $46.25
|
|
MB = $48.56
|
 Most Recent Note - 2/11/2014 5:44:41 PM
G - Hit a new 52-week high today, getting extended from any sound base while on track for a 9th consecutive weekly gain. See the latest FSU analysis for more details and a new annotated graph.
>>> FEATURED STOCK ARTICLE : Stubbornly Held Ground Following Breakaway Gap - 2/11/2014
View all notes |
Set NEW NOTE alert |
CANSLIM.net Company Profile |
SEC
News |
Chart |
Request a new note
C
A N
S L
I M
|
ULTI
-
NASDAQ
Ultimate Software Group
INTERNET - Internet Software and Services
|
$159.52
|
+0.81
0.51% |
$160.30
|
208,011
111.83% of 50 DAV
50 DAV is 186,000
|
$168.43
-5.29%
|
1/27/2014
|
$153.75
|
PP = $162.98
|
|
MB = $171.13
|
Most Recent Note - 2/5/2014 12:40:46 PM
Y - Touched another new 52-week high then undercut its 50 DMA line following a "negative reversal" after reporting earnings +42% on +21% sales for the Dec '13 quarter. Prior gains confirmed a technical buy signal, yet recent reports cautioned members - "Broader market conditions (M criteria) argue for caution until at least one of the major averages produces a convincing follow through day of gains on higher volume."
>>> FEATURED STOCK ARTICLE : Forming New Base But Enduring Distributional Pressure - 1/27/2014
View all notes |
Set NEW NOTE alert |
CANSLIM.net Company Profile |
SEC
News |
Chart |
Request a new note
C
A N
S L
I M
|
VRX
-
NYSE
Valeant Pharmaceuticals
DRUGS - Drug Manufacturers - Other
|
$141.31
|
+3.18
2.30% |
$142.45
|
1,915,028
151.75% of 50 DAV
50 DAV is 1,262,000
|
$140.36
0.68%
|
9/11/2013
|
$100.26
|
PP = $105.50
|
|
MB = $110.78
|
Most Recent Note - 2/10/2014 1:59:16 PM
G - Hovering quietly near all-time highs, extended from any sound base. Its 50 DMA line ($122) defines near-term support to watch.
>>> FEATURED STOCK ARTICLE : Hovering Near All-Time Highs Extended From Sound Base - 2/10/2014
View all notes |
Set NEW NOTE alert |
CANSLIM.net Company Profile |
SEC
News |
Chart |
Request a new note
C
A N
S L
I M
|
Symbol/Exchange
Company Name
Industry Group |
PRICE |
CHANGE
(%Change) |
Day High |
Volume
(% DAV)
(% 50 day avg vol) |
52 Wk Hi
% From Hi |
Featured
Date |
Price
Featured |
Pivot Featured |
|
Max Buy |
|
|
|
THESE ARE NOT BUY RECOMMENDATIONS!
Comments contained in the body of this report are technical
opinions only. The material herein has been obtained
from sources believed to be reliable and accurate, however,
its accuracy and completeness cannot be guaranteed.
This site is not an investment advisor, hence it does
not endorse or recommend any securities or other investments.
Any recommendation contained in this report may not
be suitable for all investors and it is not to be deemed
an offer or solicitation on our part with respect to
the purchase or sale of any securities. All trademarks,
service marks and trade names appearing in this report
are the property of their respective owners, and are
likewise used for identification purposes only.
This report is a service available
only to active Paid Premium Members.
You may opt-out of receiving report notifications
at any time. Questions or comments may be submitted
by writing to Premium Membership Services 665 S.E. 10 Street, Suite 201 Deerfield Beach, FL 33441-5634 or by calling 1-800-965-8307
or 954-785-1121.
|
|
|

